A comprehensive guide on how to design future-proof controllers: Part 1

https://hashnode.com/utility/r?url=https%3A%2F%2Fcdn.hashnode.com%2Fres%2Fhashnode%2Fimage%2Fupload%2Fv1642053183825%2FTrLri6Qo6.jpeg%3Fw%3D1200%26h%3D630%26fit%3Dcrop%26crop%3Dentropy%26auto%3Dcompress%2Cformat%26format%3Dwebp%26fm%3Dpng

Introduction

When you are still in that learning phase with any technology, your focus is to make your app work, but I think the exponential progress starts coming when you begin to ask yourself “How can I make this better?”. One simple principle that you can immediately apply to your existing or new codebase for cleaner and more maintainable code is the Separation of Concerns principle.

Most of the server-side codebases I have come across have controllers that contain code specifying the real-world business rules on how data can be created, stored, and changed on the system. If you want to learn how to build controllers that are clean, concise, and easily maintainable, then this series is for you.

What you will learn after reading this article

  1. You will have a solid understanding of the Separation of concerns principle

  2. You will be able to identify the major steps involved in the lifecycle of a request on the server-side

  3. You will understand the role of the controller on the server side. This will ensure that the lines of code present in your controller functions are the ones that absolutely need to be in the controller

Prerequisites

  1. Understanding of client-server architecture
  2. Familiarity with model-view-controller architecture
  3. A basic understanding of Object-Oriented Programming

With all that out of the way, let’s move 🚀

Understanding Separation of concerns

What is a concern?

A concern is a section of a feature or software that handles a particular functionality in the system. A good example of a concern in a well-designed backend system is request validation, which means there is a part of the code that accepts the data coming from the client to make sure all the information is valid or at least in the right format before sending it to the other parts of the system.

What does the term Separation of concerns mean?

Since we know what a concern is, understanding the idea behind the Separation of concerns will not be difficult. Separation of concerns promotes the idea of building software in such a way that our code should be broken down into separate components or layers such that each layer handles a specific concern. An example is a feature that retrieves data from the database and then formats the data based on the client’s request. Placing both logic in the same function is a really bad idea since retrieving data from the database is a specific concern, then formatting the retrieved data is another concern.

Lifecycle of a request on the server

I have worked on building many backend systems that provide services to clients and many of them usually follow a similar pattern with 3 major steps which are mainly.

  1. Request validation: This refers to the part of your code that ensures that the data sent by a client is in a valid and acceptable format. A simple example is making sure that a value sent from the client as an email is actually a valid email address.
  2. Business logic execution: This is the section of your codebase that contains the code that enforces real-world business rules. Let’s use an app that allows a customer to transfer money from one account to another. A valid business rule is that you cannot transfer an amount that is greater than your current balance. For this app to work properly, there has to be a section of your code that compares the amount you are trying to transfer and your current balance and makes sure the business rule is obeyed. That is what we refer to as business logic.
  3. Response formatting and return:This refers to the section of your codebase responsible for making sure the data returned to the client after business logic execution is properly formatted and well presented. eg JSON, XML

Backend receives request.png

I have come across a lot of codebases that perform these three steps using a single function or method, where line 10 to 15 handles request validation, line 16 to 55 handles all the business logic with long if-else statements, loops, etc, then line 56-74 formats the response based on certain conditions, and finally, line 75 returns the data to the client. That’s about 65 lines of code in a single function! That is a ticking time bomb waiting to explode when a new engineer joins the team or when you come back to add more changes to the code.

Understanding the role of the controller in the backend request lifecycle

Imagine we have 3 tasks involving the same feature.

  1. Fix a bug in request validation
  2. Change the way data is retrieved from the database (use Eloquent ORM instead of raw queries)
  3. Add extra meta-data to the response returned to the client

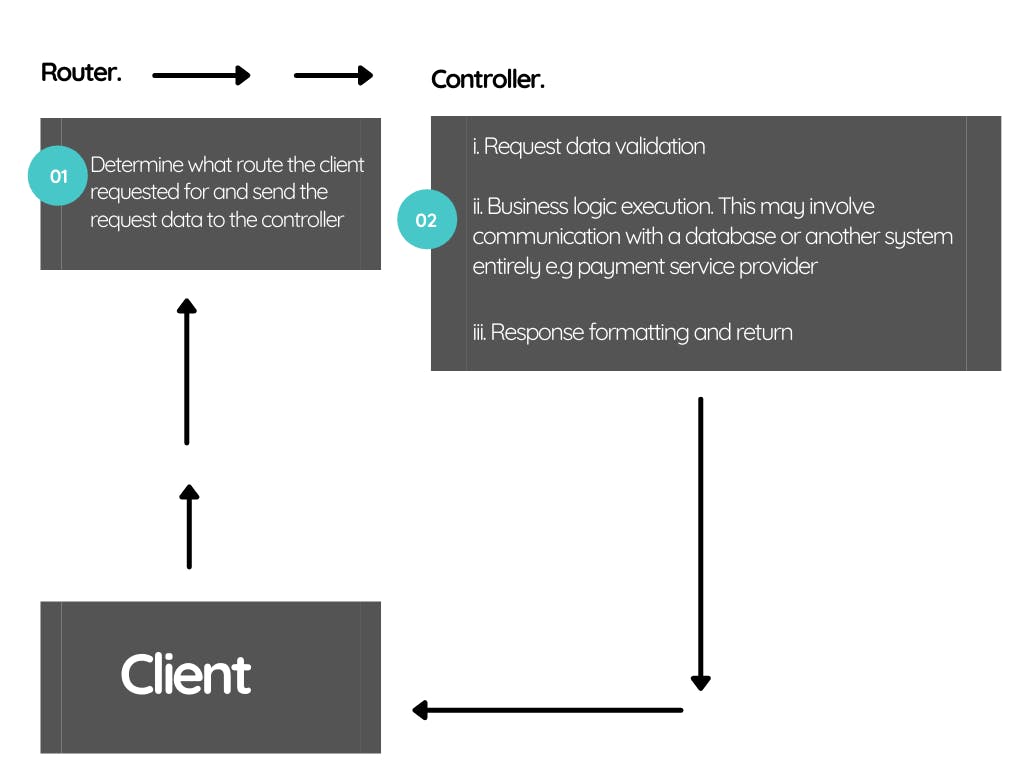
If our controllers are designed in a way where each method contains all these three major steps involved in fulfilling a request on the server-side, then the flow looks something like the image below

Backend receives request 1.png

Handling these tasks become a nightmare because everyone in the team will be modifying the same function, and good luck merging all these changes without the need to resolve merge conflicts 🙄.

So, what exactly should the controller do?

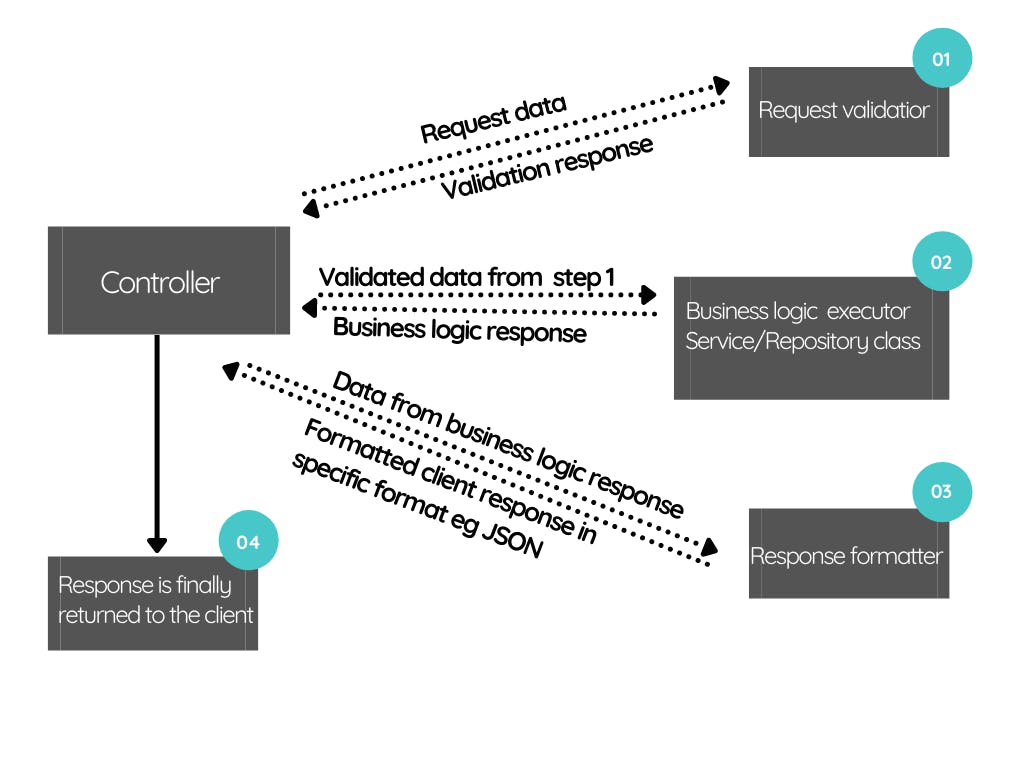
The controller should serve as a delegator, meaning that the controller accepts a request with the associated data from the client, then the controller should assign the different tasks involved in fulfilling the client’s request to different parts of the codebase, then finally, the controller sends a proper response (success or failure) to the client depending on the result of the executed code.
I have illustrated this using the image below.

controller delegator.png

If our controllers are built this way, making changes will be incredibly easy, bugs will be easy to trace and the responsibility of each class and other classes it depends on to fulfill its tasks will be immediately visible even to someone looking at the code for the first time.

There is more juicy stuff to come 😋

Like I said at the beginning of the article, this is going to be a series because there is a lot of information to digest and I want to make sure you can remember a lot after reading each article. I want to separate the concerns you know 😂, so that this article does not become massive like the controllers we will be refactoring starting from the next part. If you didn’t get that joke, then maybe next time.

In the next article, Part 2. We will be refactoring a controller function with a specific focus on the Request validation concern. We will build a Request validator class and abstract all the logic involved in validating the client’s request away from the controller. I will be using Laravel in the rest of the series.

Quick Recap

  1. Separation of concerns is simply a concept that promotes the idea that you should always look at your code to identify the different functionalities involved, and think of how you can break down the code into smaller components for clarity, easy debugging, and maintenance among other benefits.
  2. All the logic involved in fulfilling a client’s request on the server-side should not be in a single location, like a controller.
  3. The controllers should serve as classes that delegate tasks to other parts of the codebase and get’s back a response from those other parts. Depending on the response received by the controller, the controller decides if the response to send back to the client should be a success or failure response.
  4. More code might be involved when trying to break down a feature into smaller components but remember, it pays off in the long run.

It’s a wrap 🎉

I sincerely hope that you have learned something, no matter how small, after reading this. If you did, kindly drop a thumbs up.

Thanks for sticking with me till the end. If you have any suggestions or feedback, kindly drop them in the comment section. Enjoy the rest of your day…bye 😊.

Laravel News Links

Define a Route Group Controller in Laravel 8.80

https://laravelnews.imgix.net/images/laravel8.jpg?ixlib=php-3.3.1

The Laravel team released 8.80 with the ability to define a route group controller, render a string with the Blade compiler, PHPRedis serialization and compression config support, and the latest changes in the v8.x branch.

Specify a Route Group Controller

Luke Downing contributed the ability to define a controller for a route group, meaning you don’t have to repeat which controller a route uses if the group uses the same controller:

1Route::controller(PlacementController::class)

2 ->prefix('placements')

3 ->as('placements.')

4 ->group(function () {

5 Route::get('', 'index')->name('index');

6 Route::get('/bills', 'bills')->name('bills');

7 Route::get('/bills/{bill}/invoice/pdf', 'invoice')->name('pdf.invoice');

8 });

Render a String With Blade

Jason Beggs contributed a Blade::render() method that uses the Blade compiler to convert a string of Blade templating into a rendered string:

1// Returns 'Hello, Claire'

2Blade::render('Hello, ', ['name' => 'Claire']);

3 

4// Returns 'Foo '

5Blade::render('@if($foo) Foo @else Bar @endif', ['foo' => true]);

6 

7// It even supports components :)

8// Returns 'Hello, Taylor'

9Blade::render('<x-test name="Taylor" />');

PHPRedis Serialization and Compression Config Support

Petr Levtonov contributed the ability to configure PHPRedis serialization and compression options instead of needing to overwrite the service provider or define a custom driver.

The PR introduced the following serialization options:

  • NONE
  • PHP
  • JSON
  • IGBINARY
  • MSGPACK

And the following compressor options:

These options are now documented in the Redis – Laravel documentation.

Release Notes

You can see the complete list of new features and updates below and the diff between 8.79.0 and 8.80.0 on GitHub. The following release notes are directly from the changelog:

v8.80.0

Added

  • Allow enums as entity_type in morphs (#40375)
  • Added support for specifying a route group controller (#40276)
  • Added phpredis serialization and compression config support (#40282)
  • Added a BladeCompiler::render() method to render a string with Blade (#40425)
  • Added a method to sort keys in a collection using a callback (#40458)

Changed

  • Convert “/” in -e parameter to “” in Illuminate/Foundation/Console/ListenerMakeCommand (#40383)

Fixed

  • Throws an error upon make:policy if no model class is configured (#40348)
  • Fix forwarded call with named arguments in Illuminate/Filesystem/FilesystemAdapter (#40421)
  • Fix ‘strstr’ function usage based on its signature (#40457)

Laravel News

10 Fun Linux Command-Line Programs You Should Try When Bored

https://static1.makeuseofimages.com/wordpress/wp-content/uploads/2022/01/children-having-fun-with-linux-commands.jpg

The Linux terminal is a powerful utility. You can use it to control the whole system, crafting and typing commands as you go about doing your everyday tasks. But it can quickly become overwhelming to keep staring at a command line and carry on with your work.

Lucky for you, the terminal is also a source of fun. You can play around with commands, listen to music, and even play games. Although expecting a great deal of entertainment from a window full of commands would be carrying it too far, you can find utilities to bind some time when bored.

Here are some fun and entertaining commands every Linux user should try at least once.

1. CMatrix

Starting off the list with a fun tool every Linux user loves, CMatrix is a command-line utility that generates the classic “The Matrix” animation from the popular movie franchise of the same name. You can expect to see some great animations in different colors that you also get to customize.

Albeit CMatrix uses regular fonts instead of the original Japanese characters, you’ll definitely enjoy every moment you spend with the tool. Either use it as your desktop screensaver or include the program in your window manager rice screenshots, the choice is yours. You can even go to the extremes and set up a CMatrix server on a laptop that runs the program 24/7.

MAKEUSEOF VIDEO OF THE DAY

To install Cmatrix on Debian-based distros like Ubuntu:

sudo apt install cmatrix

On Arch Linux and its derivatives:

sudo pacman -S cmatrix

On RHEL-based distros like Fedora:

sudo dnf install cmatrix

2. cowsay

What does the cow say? Definitely, not just “moo.”

cowsay is an ASCII-art-based command-line utility that displays the specified input with a neat ASCII cow art. While there’s not much to this program, you can use it as a Bash prompt by invoking the program with random quotes whenever you launch a terminal instance.

cowsay "Mooooo"

To install cowsay on Debian and Ubuntu:

sudo apt install cowsay

On Arch Linux:

sudo pacman -S cowsay

On Fedora, CentOS, and RHEL:

sudo dnf install cowsay

3. sl

Everyone loves trains, especially steam locomotives. The Linux utility sl brings your favorite steam locomotive to your desk, using the terminal of course.

Running the sl command is very simple.

sl

Installing sl on Ubuntu and Debian is easy.

sudo apt install sl

Similarly, on Arch-based distributions:

sudo pacman -S sl

On Fedora, CentOS, and RHEL:

sudo dnf install sl

4. FIGlet

Have you ever seen a Linux terminal with beautifully crafted ASCII art at the top? You can achieve the same results using FIGlet, a command-line tool that converts user input into ASCII banners.

Unlike some other ASCII art generators, FIGlet doesn’t have a character limit, which is what sets it apart. You can create ASCII arts of unlimited length with the tool, although the characters might break if you supply lengthier strings.

FIGlet uses the following command syntax:

figlet "Your string here"

You can install FIGlet on Debian/Ubuntu using:

sudo apt install figlet

To install FIGlet on Arch-based distributions:

sudo pacman -S figlet

On Fedora, CentOS, and RHEL:

sudo dnf install figlet

5. fortune

Want to read a quote? Maybe something funny, or perhaps an educational message? The excitement is there every time you run fortune, as you don’t know what’s going to hit you next. fortune is a Linux utility that returns random messages and quotes on execution.

fortune

It’s easy to get engrossed in the command, reading the entertaining (mostly funny) quotes that fortune outputs. The best thing about the tool? You can pipe it with cowsay and similar programs to produce an engaging Bash prompt for yourself.

cowsay | fortune

To install fortune on Ubuntu/Debian:

sudo apt install fortune

On Arch Linux and similar distributions:

sudo pacman -S fortune-mod

Installing fortune on RHEL-based distros like Fedora and CentOS is easy as well.

sudo dnf install fortune-mod

6. xeyes

If you are someone who likes to have a pair of eyes on you every time you need to get something done, xeyes might be the best Linux tool for you. Literally, xeyes brings a pair of eyes to your desktop. The best part? The eyeballs move depending on your mouse pointer’s position.

Launching the program is easy. Simply type xeyes in the terminal and hit Enter. By default, the position of the eyes will be the top left, but you can easily change it using the -geometry flag.

On Ubuntu and Debian-based distros, you can install xeyes with APT.

sudo apt install x11-apps

To install xeyes on Arch-based distros:

sudo pacman -S xorg-xeyes

On Fedora, CentOS, and RHEL:

sudo dnf install xeyes

7. aafire

Want to make your Linux desktop lit? You need aafire. It is a terminal-based utility that starts an ASCII art fire right inside your terminal. Although you won’t physically feel the heat aafire brings to the table, it’s definitely a “cool” Linux program to have on your system.

To install aafire on Ubuntu and Debian:

sudo apt install libaa-bin

On Arch Linux and its derivatives:

sudo pacman -S aalib

On Fedora, CentOS, and other RHEL-based distros:

sudo dnf install aalib

8. espeak

Have you ever wanted your Linux desktop to speak, exactly what you want it to? espeak is a text-to-speech utility that converts a specified string to speech and returns the output in real-time. You can play around with espeak by invoking the command with song lyrics or movie dialogues.

For the test run, you can try specifying a basic string first. Don’t forget to turn up your desktop’s speaker volume.

espeak "Hello World"

You can also change the amplitude, word gap and play around with the voices with espeak. Writers can use this tool to transform their words into speech, making it a perfect tool to assess the content quality.

On Ubuntu/Debian:

sudo apt install espeak

You can install espeak on Arch Linux from the AUR.

yay -S espeak

On Fedora, CentOS, and RHEL:

sudo dnf install espeak

9. asciiquarium

For those who wish to own an aquarium someday, here’s your chance. As the name aptly suggests, asciiquarium creates a virtual aquarium inside your terminal using ASCII characters.

The fishes and the plants are colorized and that’s what makes them come to life, leaving the dull terminal screen behind. You also get to see ducks swimming in the water occasionally.

To install asciiquarium on Ubuntu and Debian:

sudo add-apt-repository ppa:ytvwld/asciiquarium
sudo apt install asciiquarium

On Arch-based distributions:

sudo pacman -S asciiquarium

Installing asciiquarium on RHEL-based distros is also easy.

sudo dnf install asciiquarium

10. rig

Want to quickly generate a fake identity for some reason? rig is what you need. Being a command-line utility, it returns output in an easy-to-read manner, for both users and computers. You can implement the functionality of rig in scripts, to test functions that require user information in bulk.

To install rig on Ubuntu and Debian:

sudo apt install rig

On Arch-based distributions:

yay -S rig

On RHEL-based distros like Fedora and CentOS:

sudo dnf install rig

Having Fun With the Linux Command Line

All the tools mentioned in the above list will guarantee you a moment of fun amidst the busy life that we’re all living. You can either install these utilities to simply play around with, or you can make something productive out of them by using them in your code.

Whatever the practical applications are, Linux programs always deliver what you expect them to. There are several other software and applications that every Linux user should know about.

The Best Linux Software and Apps

Whether you’re new to Linux or you’re a seasoned user, here are the best Linux software and apps you should be using today.

Read Next

About The Author

Deepesh Sharma
(108 Articles Published)

Deepesh is the Junior Editor for Linux at MUO. He writes informational guides on Linux, aiming to provide a blissful experience to all newcomers. Not sure about movies, but if you want to talk about technology, he’s your guy.

More
From Deepesh Sharma

Subscribe to our newsletter

Join our newsletter for tech tips, reviews, free ebooks, and exclusive deals!

Click here to subscribe

MUO – Feed

Holosun’s New RML Gives You Small, Lightweight Red or Green Laser Aiming Capability

https://cdn0.thetruthaboutguns.com/wp-content/uploads/2022/01/IMG_0461-scaled.jpg

Holosun RML Rail Mounted Laser
Holosun’s new RML Rail Mounted Laser

Next Post Coming Soon…▶

Holosun just introduced their new RML Rail Mounted Laser. It’s tiny and affordable and will come in both red and green laser versions. The RML will come in five models with MSRPs ranging from $105 to $162 and is expected to hit stores in March or April.

Here’s their press release . . .

Lasers are becoming invaluable to verify an accurate and effective aim, especially in low-light environments. Pistols and rifles fixed with lasers have been shown to improve fast target acquisition. With the growth of red dot optics, lasers have fast been growing in the industry as an alternative to mounted optics. Not only does this help to improve users’ response time, but it also makes a potential Point of Impact clear.

Holosun RML Rail Mounted Laser
Holosun is known for optics and lasers. This year, Holosun releases the RML (Rail-Mounted Laser). The RML comes in at a very manageable 1.97″×1.18″×0.91″ and 1.3 ounces. Made with a durable polymer housing, the RML is IPX8 rated for water and dust resistance. Additionally, Holosun tests each unit to 2,000G shock resistance. This guarantees that the RML is suited for use in extreme environments.

The RML is available in either a red or green laser version, both of which are class 3R and <5mW output power. The RML package includes one CR1/3N lithium battery. The laser can be adjusted by 4MOA per click and can travel a total of +/-60 MOA. The rate of travel makes it ideal for a primary or even secondary zero, providing an alternate distance point of aim from iron sights or a pistol mounted optic.

Holosun RML Rail Mounted Laser
With many features, it is easy to see why the RML is a strong contender. Holosun has made it easy to utilize the laser in multiple roles with multiple color options. For the hiker who carries a defensive pistol, the uniformed officer that relies on an alternate color laser and red dot, and everything in between, the RML fills their needs.

Specifications:

  • 520nm Green or 635nm Red, class 3R laser
  • Cr1/3N removable battery
  • Durable Polymer housing
  • 4 MOA adjustment per click
  • +/- 60 MOA laser W&E travel range
  • IPX8 water & dust resistance
  • 2000G vibration resistance
  • Dimensions: 1.97×1.18×0.91
  • Weight: 1.8oz


Next Post Coming Soon…▶

The Truth About Guns

Amazon reveals title and trailer for new ‘Lord of the Rings’ series coming to Prime Video

http://img.youtube.com/vi/uEepEyrHmtE/0.jpg

Are you ready to head back to Middle Earth? Amazon Studios revealed the title and trailer Wednesday for its highly anticipated prequel to the “Lord of the Rings” series, called “The Lord of the Rings: The Rings of Power.”

The series will debut on Prime Video on Sept. 2.

“The Rings of Power” is set in the Second Age of Middle Earth, thousands of years before the events of J.R.R. Tolkien’s “The Hobbit” and “The Lord of the Rings.”

The series “will take viewers back to an era in which great powers were forged, kingdoms rose to glory and fell to ruin, unlikely heroes were tested, hope hung by the finest of threads, and the greatest villain that ever flowed from Tolkien’s pen threatened to cover all the world in darkness,” Amazon said in its YouTube description for the trailer.

Amazon founder Jeff Bezos tweeted an image of himself holding a big slab of wood with the series title on it. “Can’t wait for you to see it,” he wrote.

IGN has behind-the-scenes details on how the title sequence was created, and it wasn’t with CGI, but rather with molten metal and a “hunk of reclaimed redwood.”

Amazon first announced that it had acquired the rights to adapt Tolkien’s work in 2017.

“’The Lord of the Rings’ is a cultural phenomenon that has captured the imagination of generations of fans through literature and the big screen,” Sharon Tal Yguado, head of Scripted Series for Amazon Studios, said in a statement at the time. 

Tolkien’s book series was named Amazon customers’ favorite book of the millennium in 1999. Director Peter Jackson’s theatrical adaptations included “The Fellowship of the Ring” (2001); “The Two Towers” (2002); and “The Return of the King” (2003). The films grossed nearly $6 billion worldwide and won a combined 17 Academy Awards, including Best Picture for “King.”

GeekWire

Our Flag Means Death (Teaser)

https://theawesomer.com/photos/2022/01/our_flag_means_death_t.jpg

Our Flag Means Death (Teaser)

Link

Rhys Darby (Murray from Flight of the Conchords) stars in this high-seas comedy adventure series about a wealthy man who abandons his life of privilege to become a pirate. Taika Waititi, the busiest man in Hollywood, does double duty as Executive Producer and performs as Blackbeard. Premieres 3.2022 on HBO Max.

The Awesomer

Pandas DataFrame Methods: drop_level(), pivot(), pivot_table(), reorder_levels(), sort_values() and sort_index()

http://img.youtube.com/vi/PMKuZoQoYE0/0.jpg

The Pandas DataFrame/Series has several methods to handle Missing Data. When applied to a DataFrame/Series, these methods evaluate and modify the missing elements.

This is Part 13 of the DataFrame methods series:

  • Part 1 focuses on the DataFrame methods abs(), all(), any(), clip(), corr(), and corrwith().
  • Part 2 focuses on the DataFrame methods count(), cov(), cummax(), cummin(), cumprod(), cumsum().
  • Part 3 focuses on the DataFrame methods describe(), diff(), eval(), kurtosis().
  • Part 4 focuses on the DataFrame methods mad(), min(), max(), mean(), median(), and mode().
  • Part 5 focuses on the DataFrame methods pct_change(), quantile(), rank(), round(), prod(), and product().
  • Part 6 focuses on the DataFrame methods add_prefix(), add_suffix(), and align().
  • Part 7 focuses on the DataFrame methods at_time(), between_time(), drop(), drop_duplicates() and duplicated().
  • Part 8 focuses on the DataFrame methods equals(), filter(), first(), last(), head(), and tail()
  • Part 9 focuses on the DataFrame methods equals(), filter(), first(), last(), head(), and tail()
  • Part 10 focuses on the DataFrame methods reset_index(), sample(), set_axis(), set_index(), take(), and truncate()
  • Part 11 focuses on the DataFrame methods backfill(), bfill(), fillna(), dropna(), and interpolate()
  • Part 12 focuses on the DataFrame methods isna(), isnull(), notna(), notnull(), pad() and replace()
  • Part 13 focuses on the DataFrame methods drop_level(), pivot(), pivot_table(), reorder_levels(), sort_values() and sort_index()

Getting Started

Remember to add the Required Starter Code to the top of each code snippet. This snippet will allow the code in this article to run error-free.

Required Starter Code

import pandas as pd
import numpy as np 

Before any data manipulation can occur, two new libraries will require installation.

  • The pandas library enables access to/from a DataFrame.
  • The numpy library supports multi-dimensional arrays and matrices in addition to a collection of mathematical functions.

To install these libraries, navigate to an IDE terminal. At the command prompt ($), execute the code below. For the terminal used in this example, the command prompt is a dollar sign ($). Your terminal prompt may be different.

$ pip install pandas

Hit the <Enter> key on the keyboard to start the installation process.

$ pip install numpy

Hit the <Enter> key on the keyboard to start the installation process.

Feel free to check out the correct ways of installing those libraries here:

If the installations were successful, a message displays in the terminal indicating the same.

DataFrame drop_level()

The drop_level() method removes the specified index or column from a DataFrame/Series. This method returns a DataFrame/Series with the said level/column removed.

The syntax for this method is as follows:

DataFrame.droplevel(level, axis=0)
Parameter Description
level If the level is a string, this level must exist. If a list, the elements must exist and be a level name/position of the index.
axis If zero (0) or index is selected, apply to each column. Default is 0 (column). If zero (1) or columns, apply to each row.

For this example, we generate random stock prices and then drop (remove) level Stock-B from the DataFrame.

nums = np.random.uniform(low=0.5, high=13.3, size=(3,4))
df_stocks = pd.DataFrame(nums).set_index([0, 1]).rename_axis(['Stock-A', 'Stock-B'])
print(df_stocks)

result = df_stocks.droplevel('Stock-B')
print(result)
  • Line [1] generates random numbers for three (3) lists within the specified range. Each list contains four (4) elements (size=3,4). The output saves to nums.
  • Line [2] creates a DataFrame, sets the index, and renames the axis. This output saves to df_stocks.
  • Line [3] outputs the DataFrame to the terminal.
  • Line [4] drops (removes) Stock-B from the DataFrame and saves it to the result variable.
  • Line [5] outputs the result to the terminal.

Output:

df_stocks

    2 3
Stock-A Stock-B    
12.327710 10.862572   7.105198  8.295885
11.474872 1.563040    5.915501  6.102915

result

  2 3
Stock-A    
12.327710 7.105198  8.295885
11.474872 5.915501  6.102915

DataFrame pivot()

The pivot() method reshapes a DataFrame/Series and produces/returns a pivot table based on column values.

The syntax for this method is as follows:

DataFrame.pivot(index=None, columns=None, values=None)
Parameter Description
index This parameter can be a string, object, or a list of strings and is optional. This option makes up the new DataFrame/Series index. If None, the existing index is selected.
columns This parameter can be a string, object, or a list of strings and is optional. Makes up the new DataFrame/Series column(s).
values This parameter can be a string, object, or a list of the previous and is optional.

For this example, we generate 3-day sample stock prices for Rivers Clothing. The column headings display the following characters.

  • A (for Opening Price)
  • B (for Midday Price)
  • C (for Opening Price)
cdate_idx = ['01/15/2022', '01/16/2022', '01/17/2022'] * 3
group_lst = list('AAABBBCCC')
vals_lst  = np.random.uniform(low=0.5, high=13.3, size=(9))

df = pd.DataFrame({'dates':  cdate_idx,
                                    'group':  group_lst,
                                   'value':  vals_lst})
print(df)

result = df.pivot(index='dates', columns='group', values='value')
print(result)
  • Line [1] creates a list of dates and multiplies this by three (3). The output is three (3) entries for each date. This output saves to cdate_idx.
  • Line [2] creates a list of headings for the columns (see above for definitions). Three (3) of each character are required (9 characters). This output saves to group_lst.
  • Line [3] uses np.random.uniform to create a random list of nine (9) numbers between the set range. The output saves to vals_lst.
  • Line [4] creates a DataFrame using all the variables created on lines [1-3]. The output saves to df.
  • Line [5] outputs the DataFrame to the terminal.
  • Line [6] creates a pivot from the DataFrame and groups the data by dates. The output saves to result.
  • Line [7] outputs the result to the terminal.

Output:

df

  dates group value
0 01/15/2022 A 9.627767
1 01/16/2022     A 11.528057
2 01/17/2022     A 13.296501
3 01/15/2022 B 2.933748
4 01/16/2022     B 2.236752
5 01/17/2022     B 7.652414
6 01/15/2022 C 11.813549
7 01/16/2022     C 11.015920
8 01/17/2022     C 0.527554

result

group A B C
dates      
01/15/2022   8.051752  9.571285   6.196394
01/16/2022  6.511448  8.158878  12.865944
01/17/2022  8.421245  1.746941  12.896975

DataFrame pivot_table()

The pivot_table() method streamlines a DataFrame to contain only specific data (columns). For example, say we have a list of countries with associated details. We only want to display one or two columns. This method can accomplish this task.

The syntax for this method is as follows:

DataFrame.pivot_table(values=None, index=None, columns=None, aggfunc='mean', fill_value=None, margins=False, dropna=True, margins_name='All', observed=False, sort=True)
Parameter Description
values This parameter is the column to aggregate and is optional.
index If the parameter is an array, it must be the same length as the data. It may contain any other data types (but not a list).
columns If an array, it must be the same length as the data. It may contain any other data types (but not a list).
aggfunc This parameter can be a list of functions. These name(s) will display at the top of the relevant column names (see Example 2).
fill_value This parameter is the value used to replace missing values in the table after the aggregation has occurred.
margins If set to True, this parameter will add the row/column data to create subtotal(s) or total(s). False, by default.
dropna This parameter will not include any columns where the value(s) are NaN. True by default.
margins_name This parameter is the name of the row/column containing the totals if margins parameter is True.
observed If True, display observed values. If False, display all observed values.
sort By default, sort is True. The values automatically sort. If False, no sort is applied.

For this example, a comma-delimited CSV file is read in. A pivot table is created based on selected parameters.

Code – Example 1:

df = pd.read_csv('countries.csv')
df = df.head(5)
print(df)

result = pd.pivot_table(df, values='Population', columns='Capital')
print(result)
  • Line [1] reads in a CSV file and saves to a DataFrame (df).
  • Line [2] saves the first five (5) rows of the CSV file to df (over-writing df).
  • Line [3] outputs the DataFrame to the terminal.
  • Line [4] creates a pivot table from the DataFrame based on the Population and Capital columns. The output saves to result.
  • Line [5] outputs the result to the terminal.

Output:

df

  Country Capital Population Area
0 Germany Berlin    83783942  357021
1 France   Paris    67081000  551695
2 Spain  Madrid    47431256  498511
3 Italy    Rome    60317116  301338
4 Poland  Warsaw    38383000  312685

result

Capital Berlin Madrid Paris Rome Warsaw
Population 83783942  47431256  67081000  60317116  38383000

For this example, a comma-delimited CSV file is read in. A pivot table is created based on selected parameters. Notice the max function.

Code – Example 2

df = pd.read_csv('countries.csv')
df = df.head(5)

result = pd.pivot_table(df, values='Population', columns='Capital', aggfunc=[max])
print(result)
  • Line [1] reads in a comma-separated CSV file and saves to a DataFrame (df).
  • Line [2] saves the first five (5) rows of the CSV file to df (over-writing df).
  • Line [3] creates a pivot table from the DataFrame based on the Population and Capital columns. The max population is a parameter of aggfunc. The output saves to result.
  • Line [4] outputs the result to the terminal.

Output:

result

  max        
Capital Berlin Madrid Paris Rome Warsaw
Population 83783942  47431256  67081000  60317116  38383000

DataFrame reorder_levels()

The reorder_levels() method re-arranges the index of a DataFrame/Series. This method can not contain any duplicate level(s) or drop level(s).

The syntax for this method is as follows:

DataFrame.reorder_levels(order, axis=0)
Parameter Description
order This parameter is a list containing the new order levels. These levels can be a position or a label.
axis If zero (0) or index is selected, apply to each column. Default is 0 (column). If zero (1) or columns, apply to each row.

For this example, there are five (5) students. Each student has some associated data with it. Grades generate by using np.random.randint().

index = [(1001, 'Micah Smith', 14), (1001, 'Philip Jones', 15), 
         	(1002, 'Ben Grimes', 16), (1002, 'Alicia Heath', 17), (1002, 'Arch Nelson', 18)]
m_index = pd.MultiIndex.from_tuples(index)
grades_lst = np.random.randint(45,100,size=5)
df = pd.DataFrame({"Grades": grades_lst}, index=m_index)
print(df)

result = df.reorder_levels([1,2,0])
print(result)
  • Line [1] creates a List of tuples. Each tuple contains three (3) values. The output saves to index.
  • Line [2] creates a MultiIndex from the List of Tuples created on line [1] and saves to m_index.
  • Line [3] generates five (5) random grades between the specified range and saves to grades_lst.
  • Line [4] creates a DataFrame from the variables on lines [1-3] and saves to df.
  • Line [5] outputs the DataFrame to the terminal.
  • Line [6] re-orders the levels as specified. The output saves to result.
  • Line [7] outputs the result to the terminal.

Output:

df

      Grades
1001 Micah Smith 14 52
  Philip Jones 15 65
1002 Ben Grimes 16 83
  Alicia Heath 17 99
  Arch Nelson  18 78

result

      Grades
Micah Smith 14 1001 52
Philip Jones 15 1001 65
Ben Grimes 16 1002 83
Alicia Heath 17 1002 99
Arch Nelson  18 1002 78

DataFrame sort_values()

The sort_values() method sorts (re-arranges) the elements of a DataFrame.

The syntax for this method is as follows:

DataFrame.sort_values(by, axis=0, ascending=True, inplace=False, kind='quicksort', na_position='last', ignore_index=False, key=None)
Parameter Description
by This parameter is a string or a list of strings. These comprise the index levels/columns to sort. Dependent on the selected axis.
axis If zero (0) or index is selected, apply to each column. Default is 0 (column). If zero (1) or columns, apply to each row.
ascending By default, True. Sort is conducted in ascending order. If False, descending order.
inplace If False, create a copy of the object. If True, the original object updates. By default, False.
kind Available options are quicksort, mergesort, heapsort, or stable. By default, quicksort. See numpy.sort for additional details.
na_position Available options are first and last (default). If the option is first, all NaN values move to the beginning, last to the end.
ignore_index If True, the axis numbering is 0, 1, 2, etc. By default, False.
key This parameter applies the function to the values before a sort. The data must be in a Series format and applies to each column.

For this example, a comma-delimited CSV file is read in. This DataFrame sorts on the Capital column in descending order.

df = pd.read_csv('countries.csv')
result = df.sort_values(by=['Capital'], ascending=False)
print(result)
  • Line [1] reads in a comma-delimited CSV file and saves to df.
  • Line [2] sorts the DataFrame on the Capital column in descending order. The output saves to result.
  • Line [3] outputs the result to the terminal.

Output:

  Country Capital Population Area
6 USA  Washington   328239523   9833520
4 Poland      Warsaw    38383000    312685
3 Italy        Rome    60317116    301338
1 France       Paris    67081000    551695
5 Russia      Moscow   146748590  17098246
2 Spain      Madrid    47431256    498511
8 India       Dheli  1352642280   3287263
0 Germany Berlin    83783942    357021
7 India Beijing  1400050000   9596961

DataFrame sort_index()

The sort_index() method sorts the DataFrame.

The syntax for this method is as follows:

DataFrame.sort_index(axis=0, level=None, ascending=True, inplace=False, kind='quicksort', na_position='last', sort_remaining=True, ignore_index=False, key=None)
Parameter Description
axis If zero (0) or index is selected, apply to each column. Default is 0 (column). If zero (1) or columns, apply to each row.
level This parameter is an integer, level name, or a list of integers/level name(s). If not empty, a sort is performed on values in the selected index level(s).
ascending By default, True. Sort is conducted in ascending order. If False, descending order.
inplace If False, create a copy of the object. If True, the original object updates. By default, False.
kind Available options are quicksort, mergesort, heapsort, or stable. By default, quicksort. See numpy.sort for additional details.
na_position Available options are first and last (default). If the option is first, all NaN values move to the beginning, last to the end.
ignore_index If True, the axis numbering is 0, 1, 2, etc. By default, False.
key This parameter applies the function to the values before a sort. The data must be in a Series format and applies to each column.

For this example, a comma-delimited CSV file is read into a DataFrame. This DataFrame sorts on the index Country column.

df = pd.read_csv('countries.csv')
df = df.set_index('Country')
result = df.sort_index()
print(result)
  • Line [1] reads in a comma-delimited CSV file and saves to df.
  • Line [2] sets the index of the DataFrame to Country. The output saves to df (over-writing original df).
  • Line [3] sorts the DataFrame (df) on the indexed column (Country) in ascending order (default). The output saves to result.
  • Line [4] outputs the result to the terminal.

Output:

  Country Population Area
China Beijing  1400050000   9596961
France Paris    67081000    551695
Germany Berlin    83783942    357021
India Dheli  1352642280   3287263
Italy Rome    60317116    301338
Poland Warsaw    38383000    312685
Russia Moscow   146748590  17098246
Spain Madrid    47431256    498511
USA Washington   328239523   9833520

Finxter

ADHD drug may protect against Alzheimer’s neurodegeneration

https://www.futurity.org/wp/wp-content/uploads/2022/01/alzheimers-disease-neurodegeneration-1600.jpgWhite pills form the shape of a brain on a black background

Boosting levels of the neurotransmitter norepinephrine with atomoxetine, a repurposed ADHD medication, may be able to stall neurodegeneration in people with early signs of Alzheimer’s disease, according to a new study.

The results appear in the journal Brain.

This is one of the first published clinical studies to show a significant effect on the protein tau, which forms neurofibrillary tangles in the brain in Alzheimer’s. In 39 people with mild cognitive impairment (MCI), six months of treatment with atomoxetine reduced levels of tau in study participants’ cerebrospinal fluid (CSF), and normalized other markers of neuro-inflammation.

The study points toward an alternative drug strategy against Alzheimer’s that does not rely on antibodies against tau or another Alzheimer’s-related protein, beta-amyloid. A recent FDA-approved drug, adacanumab, targets beta-amyloid but its benefits are controversial among experts in the field.

Larger and longer studies of atomoxetine in MCI and Alzheimer’s are warranted, the researchers conclude. The drug did not have a significant effect on cognition or other clinical outcomes, which was expected given the relatively short study duration.

“One of the major advantages of atomoxetine is that it is already FDA-approved and known to be safe,” says senior author David Weinshenker, professor of human genetics at Emory University School of Medicine. “The beneficial effects of atomoxetine on both brain network activity and CSF markers of inflammation warrant optimism.”

“We are encouraged by the results of the trial,” says lead author Allan Levey, professor of neurology at Emory University School of Medicine and director of the Goizueta Institute @Emory Brain Health. “The treatment was safe, well tolerated in individuals with mild cognitive impairment, and modulated the brain neurotransmitter norepinephrine just as we hypothesized. Moreover, our exploratory studies show promising results on imaging and spinal fluid biomarkers which need to be followed up in larger studies with longer period of treatment.”

The researchers picked atomoxetine, which is commercially available as Strattera, with the goal of boosting brain levels of norepinephrine, which they thought could stabilize a vulnerable region of the brain against Alzheimer’s-related neurodegeneration.

Norepinephrine is produced mainly by the locus coeruleus, a region of the brainstem that appears to be the first to show Alzheimer’s-related pathology—even in healthy, middle-aged people. Norepinephrine is thought to reduce inflammation and to encourage trash-removing cells called microglia to clear out aggregates of proteins such as beta-amyloid and tau. Increasing norepinephrine levels has positive effects on cognition and pathology in mouse and rat models of Alzheimer’s.

“Something that might seem obvious, but was absolutely essential, was our finding that atomoxetine profoundly increased CSF norepinephrine levels in these patients,” Weinshenker says. “For many drugs and trials, it is very difficult to prove target engagement. We were able to directly assess target engagement.”

Weinshenker also emphasizes that the trial grew out of pre-clinical research conducted in animal models, which demonstrated the potential for norepinephrine.

The researchers conducted the study between 2012 and 2018 with a cross-over design, such that half the group received atomoxetine for the first six months and the other half received placebo—then individuals switched. It is possible that participants who received atomoxetine for the first six months experienced carryover effects after treatment stopped, so their second six month period wasn’t necessarily a pure placebo.

Study participants were all diagnosed with mild cognitive impairment and had markers of potential progression to Alzheimer’s in their CSF, based on measuring tau and beta-amyloid. More information about inclusion criteria is available at clinicaltrials.gov.

The researchers measured levels of dozens of proteins in participants’ CSF; the reduction of tau from atomoxetine treatment was small—about 5% over six months—but if sustained, it could have a larger effect on Alzheimer’s pathology. No significant effect on beta-amyloid was seen.

In addition, in participants taking atomoxetine, researchers were able to detect an increase in metabolism in the medial temporal lobe, critical for memory, via PET (positron emission tomography) brain imaging.

Study participants started with a low dose of atomoxetine and ramped up to a higher dose, up to 100mg per day. Participants did experience weight loss (4 pounds, on average) and an increase in heart rate (about 5 beats per minute) while on atomoxetine, but they did not display a significant increase in blood pressure. Some people reported side effects such as gastrointestinal symptoms, dry mouth, or dizziness.

The FDA approved atomoxetine in 2002 for ADHD (attention deficit hyperactivity disorder) in children and adults, and the drug has been shown to be safe in older adults. It is considered to have low abuse potential, compared with conventional stimulants that are commonly prescribed for ADHD.

Looking ahead, it is now possible to visualize the integrity of the locus coeruleus in living people using MRI techniques, so that could be an important part of a larger follow-up study, Weinshenker says. Atomoxetine’s effects were recently studied in people with Parkinson’s disease—the benefits appear to be greater in those who have reduced integrity of the locus coeruleus.

Funding for the study was provided by the Cox and Kenan Family foundations and the Alzheimer’s Drug Discovery Foundation.

Source: Emory University

The post ADHD drug may protect against Alzheimer’s neurodegeneration appeared first on Futurity.

Futurity