O’Reilly Site Lists 165 Things Every Programmer Should Know

97 Things Every Programmer Should Know was published seven years ago by O’Reilly Media, and was described as "pearls of wisdom for programmers collected from leading practitioners." Today an anonymous reader writes:
All 97 are available online for free (and licensed under a Creative Commons Attribution 3), including an essay by "Uncle Bob" on taking personal responsibility and "Unix Tools Are Your Friend" by Athens-based professor Diomidis Spinellis, who writes that the Unix tool chest can be more useful than an IDE.
But the book’s official site is also still accepting new submissions, and now points to 68 additional "edited contributions" (plus another seven "contributions in progress"), including "Be Stupid and Lazy" by Swiss-based Java programmer Mario Fusco, and "Decouple That UI" by tech trainer George Brooke. "There is no overarching narrative," writes the site’s editor Kevlin Henney (who also wrote the original book). "The collection is intended simply to contain multiple and varied perspectives on what it is that contributors to the project feel programmers should know…anything from code-focused advice to culture, from algorithm usage to agile thinking, from implementation know-how to professionalism, from style to substance…"


Share on Google+

Read more of this story at Slashdot.

via Slashdot
O’Reilly Site Lists 165 Things Every Programmer Should Know

Maryland Legislator Wants To Keep State University Patents Away From Trolls

The EFF’s "Reclaim Invention" campaign provided the template for a patent troll-fighting bill recently introduced in the Maryland legislature to guide public universities. An anonymous reader writes:
The bill would "void any agreement by the university to license or transfer a patent to a patent assertion entity (or patent troll)," according to the EFF, requiring universities to manage their patent portfolios in the public interest. James Love, the director of the nonprofit Knowledge Ecology International, argues this would prevent assigning patents to "organizations who are just suing people for infringement," which is especially important for publicly-funded colleges. "You don’t want public sector patents to be used in a way that’s a weapon against the public." Yarden Katz, a fellow at Harvard’s Berkman Klein Center for Internet amd Society, says the Maryland legislation would "set an example for other states by adopting a framework for academic research that puts public interests front and center."
The EFF has created a web page where you can encourage your own legislators to pass similar bills, and to urge universities to pledge "not to knowingly license or sell the rights of inventions, research, or innovation…to patent assertion entities, or patent trolls."


Share on Google+

Read more of this story at Slashdot.

via Slashdot
Maryland Legislator Wants To Keep State University Patents Away From Trolls

Always Put a Comma Before “and” in a List, No Matter What Your Old Grammar Teacher Said

Did you know there is a butterfly called the comma? Now you do. Photo by Charlie Jackson.

Do you go to the store for “cupcakes, vanilla, and chocolate” or “cupcakes, vanilla and chocolate”? There’s a long-running debate over whether it’s proper to include that last comma in a list. Well, forget proper. The comma makes things clearer, and a recent lawsuit proves that.

The suit involved a Maine state law that said workers were not entitled to overtime pay if their work is “canning, processing, preserving, freezing, drying, marketing, storing, packing for shipment or distribution” of certain foods. Truck drivers sued, saying that they deserve overtime because their job is distribution. They do not do “packing for shipment or distribution”. The court agreed: if the state wanted “distribution” to be its own item in the list, they should have used a damn comma.

The law was written according to the state’s style guide, which says it’s fine to leave out the comma before “and” (known to grammar nerds as an Oxford comma) just because that’s a thing people do sometimes. But the court is right: if you want to clearly identify the items in your list, consider your commas carefully.


via Lifehacker
Always Put a Comma Before “and” in a List, No Matter What Your Old Grammar Teacher Said

Piwic raises $2 million to truly liberate your analytics

You know when you set up a website and you add a Google Analytics tracker to see how many visitors you have? What you’re actually doing is giving Google and other parties access to your stats and users. Sure there are privacy protections in place and things aren’t all that bad but what if your website or app is particularly sensitive? Then you use something like Piwik or, now, Piwik Pro.

Piwik is a completely free and open source analytics software akin to Webalizer, the analytics tool of choice for websites circa 1999. Piwik is the next generation of that product and the name sounds like “little beer” in Polish, which is also pretty exciting.

Created by Maciej Zawadziński and Piotr Korzeniowski Piwik is a proudly Polish product and is quite popular with the security conscious set. They recently raised capital from the Warsaw Equity Group to bring out a new “marketing technology suite that will provide data-sensitive companies with 100% control of their data and compliance with privacy regulations.”

“Piwik PRO is developing a comprehensive marketing technology stack, which includes web and mobile analytics, a data management platform, tag management, and content personalization. This marketing suite will provide any enterprise or organization 100 percent data ownership and privacy compliance in an on-premise or cloud environment,” said Zawadziński.

Zawadziński started one of the first blog advertising platforms in Poland and sold two companies before doubling down on Piwik Pro. Korzeniowski worked at HP and KPMG. They are currently supplying analytics fro Hewlett-Packard, Accenture, Government of Netherlands, and the European Commission.

This is one of the largest investments in the region to date – I’ve been following things over there for a while and funding is hard in Central Europe – and it points to a way forward for tech-savvy and privacy-leaning startups in Poland and all Mitteleuropa. Privacy, as they say, is pretty important.

via TechCrunch
Piwic raises $2 million to truly liberate your analytics

Percona Live Featured Session with Evan Elias: Automatic MySQL Schema Management with Skeema

Percona Live Featured Session

Percona Live Featured SessionWelcome to another post in the series of Percona Live featured session blogs! In these blogs, we’ll highlight some of the session speakers that will be at this year’s Percona Live conference. We’ll also discuss how these sessions can help you improve your database environment. Make sure to read to the end to get a special Percona Live 2017 registration bonus!

In this Percona Live featured session, we’ll meet Evan Elias, Director of Engineering, Tumblr. His session is Automatic MySQL Schema Management with SkeemaSkeema is a new open source CLI tool for managing MySQL schemas and migrations. It allows you to easily track your schemas in a repository, supporting a pull-request-based workflow for schema change submission, review, and execution.

I had a chance to speak with Evan about Skeema:

Evan EliasPercona: How did you get into database technology? What do you love about it?

Evan: I first started using MySQL at a college IT job in 2003, and over the years I eventually began tackling much larger-scale deployments at Tumblr and Facebook. I’ve spent most of the past decade working on social networks, where massive high-volume database technology is fundamental to the product. I love the technical challenges present in that type of environment, as well as the huge potential impact of database automation and tooling. In companies with giant databases and many engineers, a well-designed automation system can provide a truly enormous increase in productivity.

Percona: Your talk is called Automatic MySQL Schema Management with Skeema. What is Skeema, and how is it helpful for engineers and DBAs?

Evan: Skeema is an open source tool for managing MySQL schemas and migrations. It allows users to diff, push or pull schema definitions between the local filesystem and one or more databases. It can be configured to support multiple environments (e.g. development/staging/production), external online schema change tools, sharding, and service discovery. Once configured, an engineer or DBA can use Skeema to execute an online schema change on many shards concurrently simply by editing a CREATE TABLE statement in a file and then running “skeema push”.

Percona: What are the benefits of storing schemas in a repository?

Evan: The whole industry is moving towards infrastructure-as-code solutions, providing automated configuration which is reproducible across multiple environments. In extending this concept to database schemas, a file repository stores the desired state of each table, and a schema change is tied to simply changing these files. A few large companies like Facebook have internal closed-source tools to tie MySQL schemas to a git repo, allowing schema changes to be powered by pull requests (without any manual DBA effort). There hasn’t previously been an open source, general-purpose tool for managing schemas and migrations in this way, however. I developed Skeema to fill this gap.

Percona: What do you want attendees to take away from your session? Why should they attend?

Evan: In this session, MySQL DBAs will learn how to automate their schema change workflow to reduce manual operational work, while software engineers will discover how Skeema permits easy online migrations even in frameworks like Rails or Django. Skeema is a brand new tool, and this is the first conference session to introduce it. At this relatively early stage, feedback and feature requests from attendees will greatly influence the direction and prioritization of future development.

Percona: What are you most looking forward to at Percona Live 2017?

Evan: Percona Live is my favorite technical conference. It’s the best place to learn about all of the recent developments in the database world, and meet the top experts in the field. This is my fifth year attending in Santa Clara. I’m looking forward to reconnecting with old friends and making some new ones as well!

Register for Percona Live Data Performance Conference 2017, and see Evan present his session on Automatic MySQL Schema Management with Skeema. Use the code FeaturedTalk and receive $100 off the current registration price!

Percona Live Data Performance Conference 2017 is the premier open source event for the data performance ecosystem. It is the place to be for the open source community as well as businesses that thrive in the MySQL, NoSQL, cloud, big data and Internet of Things (IoT) marketplaces. Attendees include DBAs, sysadmins, developers, architects, CTOs, CEOs, and vendors from around the world.

The Percona Live Data Performance Conference will be April 24-27, 2017 at the Hyatt Regency Santa Clara & The Santa Clara Convention Center.

via Planet MySQL
Percona Live Featured Session with Evan Elias: Automatic MySQL Schema Management with Skeema

Monitoring Databases: A Product Comparison

Monitoring Databases PMM small

In this blog post, I will discuss the solutions for monitoring databases (which includes alerting) I have worked with and recommended in the past to my clients. This survey will mostly focus on MySQL solutions. 

One of the most common issues I come across when working with clients is monitoring and alerting. Many times, companies will fall into one of these categories:

  • No monitoring or alerting. This means they have no idea what’s going on in their environment whatsoever.
  • Inadequate monitoring. Maybe people in this camp are using a platform that just tells them the database is up or connections are happening, but there is no insight into what the database is doing.
  • Too much monitoring and alerting. Companies in this camp have tons of dashboards filled with graphs, and their inbox is full of alerts that get promptly ignored. This type of monitoring is just as useful as the first option. Alert fatigue is a real thing!

With my clients, I like to talk about what monitoring they need and what will work for them.

Before we get started, I do want to point out that I have borrowed some text and/or graphics from the websites and promotional material of some of the products I’m discussing.

Simple Alerting

Percona provides a Nagios plugin for database alerts: http://ift.tt/1RohePo.

I also like to point out to clients what metrics are important to monitor long term to make sure there are no performance issues. I prefer the following approach:

  • On the hardware level:
    • Monitor CPU, IO, network usage and how it trends monthly. If some resource consumption comes to a critical level, this might be a signal that you need more capacity.
  • On the MySQL server level:
    • Monitor connections, active threads, table locks, row locks, InnoDB IO and buffer pool usage
    • For replication, monitor seconds behind master (SBM), binlog size and replication errors. In Percona XtraDB Cluster, you might want to watch wsrep_local_recv_queue.
  • On the query level:
    • Regularly check query execution and response time, and make sure it stays within acceptable levels. When execution time approaches or exceeds established levels, evaluate ways to optimize your queries.
  • On the application side:
    • Monitor that response time is within established SLAs.

High-Level Monitoring Solution Comparison

PMM MonYOG Severalnines VividCortex SelectStar
Databases Supported MySQL, MongoDB and others with custom addons MySQL MySQL, MongoDB, PostgreSQL MySQL, MongoDB, PostgreSQL, Redis MySQL, MongoDB, PostgreSQL, Hadoop, Cassandra, Amazon Dynamo, IBM DB2, SQL Server, Oracle
Open Source x
Cost Free Subscription per node Subscription per node Subscription per instance Subscription per instance
Cloud or
On Premises
On premises On premises On premises Cloud with on premises collector Cloud with on premises collector
Has Agents x x
Monitoring x x x x x
Alerting Yes, but requires custom setup x x x x
Replication Topology Management x x
Query Analytics x x x x
Configuration Management x x
Backup Management x
OS Metrics x x x x
Configuration Advisors x x
Failover Management x x
ProxySQL and
HA Proxy Support
Monitors ProxySQL x


PMM

http://ift.tt/20RDjvr

http://ift.tt/1S6sNir

http://ift.tt/1Socbl6

Percona Monitoring and Management (PMM) is a fully open source solution for managing MySQL platform performance and tuning query performance. It allows DBAs and application developers to optimize the performance of the database layer. PMM is an on-premises solution that keeps all of your performance and query data inside the confines of your environment, with no requirement for data to cross the Internet.

Assembled from a supported package of “best-of-breed” open source tools such as Prometheus, Grafana and Percona’s Query Analytics, PMM delivers results right out of the box.

With PMM, anyone with database maintenance responsibilities can get more visibility for actionable enhancements, realize faster issue resolution times, increase performance through focused optimization and better manage resources. More information allows you to concentrate efforts on the areas that yield the highest value, rather than hunting and pecking for speed.

PMM monitors and provides performance data for Oracle’s MySQL Community and Enterprise Servers, as well as Percona Server for MySQL and MariaDB.

Alerting

In the current version of PMM, custom alerting can be set up. Percona has a guide here: http://ift.tt/2jiJvjH.

Architecture

The PMM platform is based on a simple client-server model that enables efficient scalability. It includes the following modules:

  • PMM Client is installed on every MySQL host that you want to monitor. It collects MySQL server metrics, general system metrics, and query analytics data for a complete performance overview. Collected data is sent to the PMM Server.
  • PMM Server aggregates collected data and presents it in the form of tables, dashboards and graphs in a web interface.

Monitoring Databases

MySQL Configuration

Percona recommends certain settings to get the most out of PMM. You can get more information and a guide here: http://ift.tt/2nwJ5WD.

Advantages

  • Fast setup
  • Fully supported and backed by Percona
  • Impressive roadmap ahead
  • Monitors your database in depth
  • Query analytics
  • Quick setup docker container
  • Free and open source

Disadvantages

  • New, could still have some growing pains
  • Requires agents on database machines

Severalnines

http://ift.tt/1lZf79Y

Severalnines ClusterControl provides access to 100+ key database and host metrics that matter to your operational performance. You can visualize historical performance in custom dashboards to establish operational baselines and capacity planning. It lets you proactively monitor and receive advice to address immediate and potential database and server issues, and ships with over 100 built-in advisors or easily-writeable custom advisors for your specific needs.

Severalnines is more sysadmin focused.

Architecture

ClusterControl is an agentless management and automation software for database clusters. It helps deploy, monitor, manage and scale your database server/cluster directly from ClusterControl user interface.

ClusterControl consists of four components:

Component Package Naming Role
ClusterControl controller (cmon) clustercontrol- controller The brain of ClusterControl. A backend service performing automation, management, monitoring and scheduling tasks. All the collected data will be stored directly inside CMON database
ClusterControl REST API clustercontrol-cmonapi Interprets request and response data between ClusterControl UI and CMON database
ClusterControl UI clustercontrol A modern web user interface to visualize and manage the cluster. It interacts with CMON controller via remote procedure call (RPC) or REST API interface
ClusterControl NodeJS clustercontrol-nodejs This optional package is introduced in ClusterControl version 1.2.12 to provide an interface for notification services and integration with 3rd party tools


Advantages

  • Agentless
  • Monitors, deploys and manages:
    • Database
    • Configuration
    • Backups
    • Users
  • Simple web GUI to manage your databases, alerts, users, settings
  • Can create custom monitors or jobs
  • Can off-load and compress backups
  • Great support team
  • Rich feature set and multiple databases supported

Disadvantages

  • Cost per node
  • UI can occasionally be clunky
  • Query tools lack as compared to other solutions here

MONyog

http://ift.tt/1gsatxW

MONyog MySQL Monitor and Advisor is a “MySQL DBA in a box” that helps MySQL DBAs manage more MySQL servers, tune their current MySQL servers and find and fix problems with their MySQL database applications before they can become serious problems or costly outages.

MONyog proactively monitors enterprise database environments and provides expert advice on how even those new to MySQL can tighten security, optimize performance and reduce downtime of their MySQL powered systems.

MONyog is more DBA focused and focuses on the MySQL configuration and queries.

Architecture

MONyog web server runs on Linux, monitoring MySQL on all platforms and also monitoring OS-data on Linux servers. To retrieve OS metrics, MONyog uses SSH. However, with this scenario (MONyog installed on a Linux machine) MONyog web-server/agent cannot collect Windows OS metrics.

Of course, the client where the MONyog output is viewed can be any browser supporting AJAX on any platform. MONyog can be installed on a remote PC as well as the server. It does not require processing, and with agentless monitoring it can collect and retrieve data from the server.

Advantages

  • Setup and startup within two minutes
  • Agentless
  • Good query tools
  • Manages configuration
  • Great advisors for database tuning built-in
  • Most comprehensive and detailed alerting

Disadvantages

  • Cost per node
  • Only supports MySQL

VividCortex

VividCortex is a good cloud-based tool to see what your production databases are doing. It is a modern SaaS database performance monitoring platform that significantly eases the pain of database performance at scale, on distributed and polyglot systems, for the entire engineering team. It’s hosted for you with industry-leading security, and is continuously improved and maintained. VividCortex measures and analyzes the system’s work and resource consumption. The result is an immediate insight into query performance, better performance and quality, faster time-to-market and reduced cost and effort.

Architecture

VividCortex is the combination of agent programs, APIs and a web application. You install the agents on your servers, they send data to their APIs, and you access the results through the web application at http://ift.tt/1OgyUwi. VividCortex has a diagram on their site showing how it works:

Monitoring Databases VividCortex

The agents are self-supervising, managed by an agent called vc-agent-007. You can read more about the agents in the agent-specific documentation. They send primarily time-series metrics to the APIs, at one-second granularity. It sometimes sends additional metadata as well. For example, query digests are required to show what query is responsible for specific query-related metrics.
On the backend, a distributed, fully multi-tenant service stores your data separately from all other customers. VividCortex servers are currently hosted in the Amazon AWS public cloud.

Advantages

  • Great visibility into query-level performance to pinpoint optimization efforts
  • Granularity, with the ability to identify performance fluctuations down to a one-second resolution
  • Smart anomaly detection using advanced statistics and machine learning to reduce false-positives and make alerts meaningful and actionable
  • Unique collaboration tools, enabling developers to answer many of their own questions and freeing DBAs to be more responsive and proactive.

Disadvantages

  • Cloud-based tools may not be desirable in a secure environment
  • Cost
  • Not useful if you lose outside network access during an incident
  • Dependent on AWS availability

SelectStar

https://selectstar.io

SelectStar monitors key metrics for many different database types, and has a comprehensive alerts and recommendations system. SelectStar supports monitoring and alerts on:

  • MySQL, Percona Server for MySQL, MariaDB
  • PostgreSQL
  • Oracle
  • MongoDB
  • Microsoft SQL
  • DB2
  • Amazon RDS and Aurora
  • Hadoop
  • Cassandra

The alerts and recommendations are designed to ensure you have an immediate understanding of key issues — and where they are coming from. You can pinpoint the exact database instance that may be causing the issue, or go further up the chain and see if it’s an issue impacting several database instances at the host level.

Recommendations are often tied to alerts — if you have a red alert, there’s going to be a recommendation tied to it on how you can improve. However, the recommendations pop up even if your database is completely healthy — ensuring that you have visibility into how you can improve your configuration before you actually have an issue impacting performance.

Architecture

Using agentless collectors, SelectStar gathers data from both your on-premises and AWS platforms so that you can have insight into all of your database instances.

Monitoring Databases SelectStar

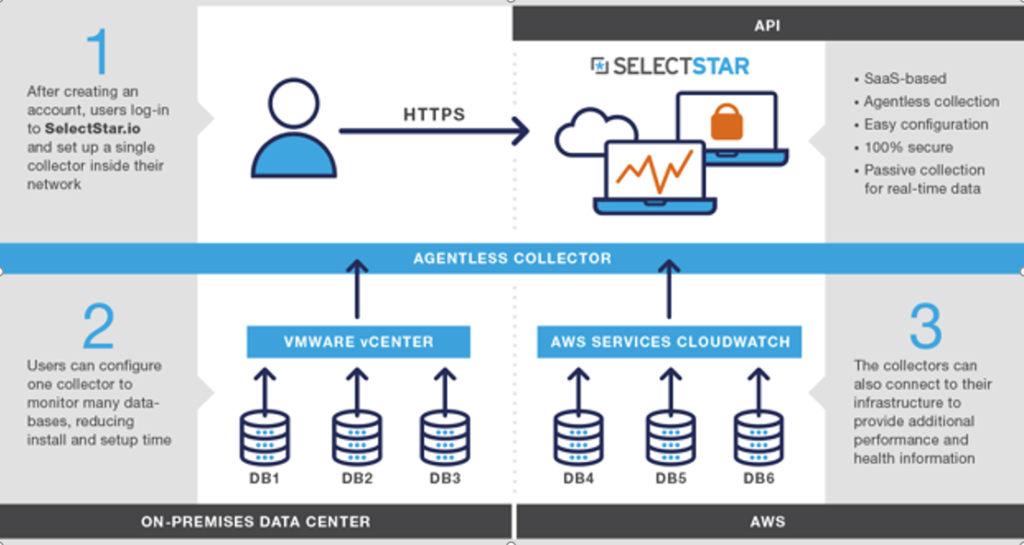
The collector is an independent machine within your infrastructure that pulls data from your database. It is low impact in order to not impact performance. This is a different approach from all of the other monitoring tools I have looked at.

Advantages

  • Multiple database technologies (the most out of the tools presented here)
  • Great visibility into query-level performance to pinpoint optimization efforts
  • Agentless
  • Good query tools
  • Great advisors for database tuning built in
  • Good alerting
  • Fast setup
  • Monitors your database in depth
  • Query analytics

Disadvantages

  • Cloud-based tools may not be desirable in a secure environment
  • Cost
  • New, could still have some growing pains
  • Still requires an on-premises collector

So What Do I Recommend?

It depends.” – Peter Z., CEO Percona

As always, I recommend whatever works best for your workload, in your environment, and within the standards of your company’s practices!

via MySQL Performance Blog
Monitoring Databases: A Product Comparison

Watch a Guy Install Every Version of Windows and Draw Dicks in All of Them

Image: YouTube / Gizmodo

Just for fun, a random YouTuber upgraded a single computer from Windows 1.0 to Windows 10—including every version in between. Seeing the whole process unfold before your eyes is nostalgic as hell. Watching a guy draw dicks in every version of Windows is a little weird, though.

Not only does this installation enthusiast draw dicks in every version of Windows, he also mixes up his methods. Obviously, there’s the obligatory early MS Paint dick drawing. But later in the version history, you’ll see dicks in PageMaker as well as Word and Excel.

Image: YouTube / TheRasteri

It’s like the Windows-based version of Jonah Hill’s strange dick-drawing habit in the movie Superbad.

All dick drawings aside, you’ll get a thrill out of seeing how hilariously awful the first version of Windows was. And it’s a blast to see games like SkiFree and PipeDream again. Remember Windows ME? I don’t.

[Digg]

via Gizmodo
Watch a Guy Install Every Version of Windows and Draw Dicks in All of Them

Millions of Records Leaked From Huge US Corporate Database

Millions of records from a commercial corporate database have been leaked. ZDNet reports: The database, about 52 gigabytes in size, contains just under 33.7 million unique email addresses and other contact information from employees of thousands of companies, representing a large portion of the US corporate population. Dun & Bradstreet, a business services giant, confirmed that it owns the database, which it acquired as part of a 2015 deal to buy NetProspex for $125 million. The purchased database contains dozens of fields, some including personal information such as names, job titles and functions, work email addresses, and phone numbers. Other information includes more generic corporate and publicly sourced data, such as believed office location, the number of employees in the business unit, and other descriptions of the kind of industry the company falls into, such as advertising, legal, media and broadcasting, and telecoms.


Share on Google+

Read more of this story at Slashdot.

via Slashdot
Millions of Records Leaked From Huge US Corporate Database