It degrades customer experience, it threatens security, and it’s a drag on time to market. It’s also a giant tax on the effectiveness of your team who are trying to manage it all with inconsistent tools and no hiring budget. Meanwhile, developers and other stakeholders, who are also under pressure to deliver more quickly, are frustrated by your inability to meet their needs fast enough. They may even be going around you.
In an attempt to address complexity, a lot of companies are throwing more and more resources at it, like beefier nodes. However, ad hoc approaches tend to cost more than making upfront investments to optimize your architecture. They also put a bandage on a much bigger issue, namely a fragmented environment that’s getting impossible to manage.
The stakes are high for you, your team, and the business. Are you doing everything you can to get database complexity under control? Ask yourself these questions:
Do you know how database complexity hurts the business?
I mean, do you fully understand the real-world costs that complexity has not just on your team but on the bottom line? For example:
53% of shoppers will leave a retailer’s site and buy from a competitor due to site slowness.
Organizations lose more than $2 million per year due to ineffective data management.
Add to these costs the risk of breaching Service Level Agreements (SLAs), which may involve penalties ranging from fee reductions to customers terminating their contracts.
Do you know what the options are to fix it?
There are several options for dealing with database complexity and operating your environment more efficiently, such as using a single kind of database, multiple kinds of databases, or moving to the public cloud. Clearly understanding the pros and cons of each is important for finding the right solution for your environment.
For example, lots of organizations are moving to the public cloud thinking it will solve their complexity, cost, and staffing problems, but will it? Are there hidden fees? What about lock-in? Not knowing the answers to these questions can make relying on a public cloud provider for support a risky proposition.
Do you know what to look for in a vendor?
For those considering the use of multiple types of databases, separating the good from the not-so-good vendors matters. That’s because choosing a vendor is not just about the database. It involves evaluating the quality of their entire platform, from support to service to tools. You need to know what to look for so you can be assured that whoever you choose offers a unified solution that supports your database environments on any infrastructure..
Take control of database complexity today
There’s a lot to tackle to solve database complexity, and it’s hard to know where to start. Our latest eBook, How to Manage Complex Database Environments Effectively cuts through the confusion, so you can start taking control of your databases today.
http://img.youtube.com/vi/gN349cSMJsE/0.jpgA new addition to the Laravel framework: more structured syntax to avoid repeating the same relationship.Laravel News Links
We’ve released a new package called spatie/laravel-sql-commenter. This one can add comments to SQL queries. These comments allow you to easily pinpoint the origin of a query when looking at your query log.
When Laravel executes an Eloquent query, it will transform it to SQL and send it to the database. Here’s what such a simple SQL query looks like.
select*from users
Using our package, you can easily add comments like this one.
We didn’t come up with that particular way of formatting a comment. We’re using sqlcommenter formatting. This formatting is supported by tools and services that allow you to inspect queries.
We are currently building Mailcoach Cloud, a service to easily send bulk mailings, drip campaigns and more via your own AWS SES, Mailgun, Postmark, Sendgrid, … account. The database of Mailcoach Cloud will be administered via PlanetScale .
On PlanetScale, you can get detailed information about the executed queries on the query insights screen.
Here’s a screenshot of a slow query (we intentionally made it slow for this example using sleep). The comments we added to the query end up as nicely formatted tags.
Using these tags, we can quickly pinpoint the source of the query and even for which client the query was executed.
Various other services, like Google Cloud Platform, will also use the comments in a similar way on their query insights pages.
You only need to install the package with Composer to add comments to all queries performed by Laravel.
composer require spatie/laravel-sql-commenter
All your queries will now have a comment that will tell you from which class, route, and/or job the query originated.
Publishing the config file can give you fine-grained control over what gets added.
Here’s what that published config file looks like.
return [/* * When set to true, comments will be added to all your queries */'enabled'=>true,/* * These classes add comments to an executed query. */'commenters'=> [Spatie\SqlCommenter\Commenters\ControllerCommenter::class=> ['includeNamespace'=>false],Spatie\SqlCommenter\Commenters\RouteCommenter::class,Spatie\SqlCommenter\Commenters\JobCommenter::class=> ['includeNamespace'=>false],Spatie\SqlCommenter\Commenters\FileCommenter::class=> ['backtraceLimit'=>20],Spatie\SqlCommenter\Commenters\CurrentUserCommenter::class,// Spatie\SqlCommenter\Commenters\FrameworkVersionCommenter::class,// Spatie\SqlCommenter\Commenters\DbDriverCommenter::class, ],/* * If you need fine-grained control over the logging, you can extend * the SqlCommenter class and specify your custom class here */'commenter_class'=>Spatie\SqlCommenter\SqlCommenter::class,];
The classes in the commenters key are responsible for adding a comment to the query. By default, we’ll add where the query originated and who is the current user.
You can easily add commenters yourself to add a comment about an aspect that is important to you. A commentator is a class that returns zero, one or more comments. Let’s look at the FrameworkVersionCommenter that ships with the package.
When you create your own commenter, don’t forget the add its class name to the commenters key of the config file.
How it works under the hood
Laravel makes adding comments to queries that are about to be executed pretty easy. We can leverage the beforeExecuting method on the DB connection. In our package, we call that function in our service provider.
You’ll notice that the query is preceded by &. This means that the query is passed by reference. This allows us to change the comment, the code that calls beforeExecuting will use the changed $query.
The comments are added to $query inside the commmentQuery method of the SqlCommenter class. This class will loop over all configured commenters to determine which comments should be added. If you’re interested in how this all works, head over the code of the SqlCommenter class.
In closing
We hope this package can help you make your query log more useful. spatie/laravel-sql-commenter was made by my colleague Rias and me. To learn more about the package, head to the the readme on GitHub.
To know more about Mailcoach Cloud, the service where we use this package ourselves, point your browser to the Mailcoach Cloud website.
This article will show you the most interesting PHP frameworks to build your career on in 2023 and beyond.
Let’s start right away with a tabular overview of the income potential of the addressed PHP frameworks:
PHP Framework Developer
Income Low ($/year)
Income High ($/year)
General PHP Developer
$44,000
$97,000
Laravel Developer
$40,000
$150,000
Symfony Developer
$68,000
$119,000
Laminas/Zend Developer
$80,000
$143,000
CodeIgniter Developer
$58,000
$117,000
CakePHP Developer
$67,000
$98,000
FlightPHP Developer
$70,000
$95,000
Lithium (li3) Web Developer
$44,000
$97,000
Okay, ready to dive into the weeds?
General PHP Developer
Before we look at an individual PHP framework, you should know the basics of PHP. This may not yet be very profitable but it is the baseline skill you can use as a fundament of your whole career. So, don’t skip it!
The average annual income of a PHP Developer is $65,590 according to PayScale (source) ranging from $44k (10th percentile) to $97k (90th percentile).
If you decide to go the route as a freelance PHP Developer, you can expect to make between $20 and $35 per hour on Upwork (source). Assuming an annual workload of 2000 hours, you can expect to make between $40,000 and $70,000 per year.
A PHP Developer specializes in designing, testing, debugging, and implementing software code in the PHP programming language — mainly used for server-side applications to serve dynamic web content.
Do you want to become a PHP Developer? Here’s a step-by-step learning path I’d propose to get started with PHP:
“Laravel is a PHP-based web application framework with expressive, elegant syntax. […] Laravel strives to provide an amazing developer experience while providing powerful features such as thorough dependency injection, an expressive database abstraction layer, queues and scheduled jobs, unit and integration testing, and more.”
Ya, well, this is marketing speak for Laravel handles the back-end part when building websites with PHP.
The average annual income of a Laravel Developer in the United States is between $40,000 (25th percentile) and $150,000 (75th percentile) with an average of $92,000 per year according to Kinsta (source).
Learn More: Read the full article with income and opportunity of this career path on the Finxter blog.
“Symfony is a set of reusable PHP components and a PHP framework for web projects.”
So, it’s a framework supporting your PHP backend development efforts.
The average annual income of a Symfony Developer in the United States is between $68,000 (25th percentile) and $119,000 (75th percentile) with an average of $96,000 per year according to Ziprecruiter (source). Top earners make $129,000 and more in the US!
Learn More: Read the full article with income and opportunity of this career path on the Finxter blog.
“Zend Framework is a collection of professional PHP packages with more than 570 million installations. It can be used to develop web applications and services using PHP 5.6+, and provides 100% object-oriented code using a broad spectrum of language features.”
A Zend/Laminas Developer creates, edits, analyzes, debugs, and supervises the development of applications written in the former Zend and current Laminas programming framework based on the PHP programming language.
The average annual income of a Zend framework (Laminas) developer in the US is $90,000 with an expected range between $110,000 and $143,000. Top Zend/Laminas developers make $200,000 and more per year in the US.
“CodeIgniter is a powerful PHP framework with a very small footprint, built for developers who need a simple and elegant toolkit to create full-featured web applications.
In particular, CodeIgniter is an Application Development Framework – a toolkit – for people who build web sites using PHP. Its goal is to enable you to develop projects much faster than you could if you were writing code from scratch, by providing a rich set of libraries for commonly needed tasks, as well as a simple interface and logical structure to access these libraries. CodeIgniter lets you creatively focus on your project by minimizing the amount of code needed for a given task.”
The average annual income of a CodeIgniter Developer in the United States is between $58,000 (25th percentile) and $117,000 (75th percentile) with an average of $90,635 per year according to Ziprecruiter (source). Top earners make $142,000 and more in the US!
Learn More: Read the full article with income and opportunity of this career path on the Finxter blog.
“CakePHP is a free, open-source, rapid development framework for PHP. It’s a foundational structure for programmers to create web applications.
CakePHP takes the monotony out of web development. They provide you with all the tools you need to get started coding what you really need to get done: the logic specific to your application.
Instead of reinventing the wheel every time you sit down to a new project, check out a copy of CakePHP and get started with the real guts of your application.”
The average annual income of a CakePHP Developer in the United States is between $67,000 (25th percentile) and $98,000 (75th percentile) with an average of $84,000 per year according to Ziprecruiter (source). Top earners make $123,000 and more in the US!
Learn More: Read the full article with income and opportunity of this career path on the Finxter blog.
Flight is a fast, simple, extensible framework for PHP. Flight enables you to quickly and easily build RESTful web applications.
A Flight PHP developer creates web apps in PHP. According to ZipRecruiter, freelance PHP developers make an average of $89,000 per year or $43 per hour. Codementor reports that freelance PHP developers make on average $61-80 per hour. (source)
Learn More: Read the full article with income and opportunity of this career path on the Finxter blog.
li₃ is the first and only major PHP framework built from the ground up for PHP 5.3+, and the first to break ground into major new technologies, including bridging the gap between relational and non-relational databases through a single, unified API.
A Lithium developer is a PHP developer. Thus, our estimation for the average annual income of a Lithium Developer is $65,590 according to PayScale (source) ranging from $44k (10th percentile) to $97k (90th percentile).
Learn More: Read the full article with income and opportunity of this career path on the Finxter blog.
Summary
The most profitable PHP framework is Laravel — if you have mastered it you can expect to earn up to $143,000. The easiest PHP framework to make a relatively high amount of money with on the low end is Laminas (Zend) due to its unique business value for many companies. Per comparison, a general PHP developer makes between $44,000 and $97,000 per year.
The Transcend JetDrive Lite is as close as you can get to upgrading the internal storage on your modern MacBook Pro, but hard drive-like speeds limit its uses.
Designed for the 2021 16-inch MacBook Pro and 14-inch MacBook Pro, the Transcend JetDrive Lite 330 is a small chip of solid-state storage that slips into the SD card reader to expand capabilities. You’ll hardly even notice it is there while you can add up to 1TB of additional storage.
Design and use
When Apple first added an SD card reader to the Mac, a slew of third-paltry adapters flooded the market. We vividly remember when an early company called Nifty MiniDrive launched that had an anodized aluminum edge to blend into your Mac seamlessly.
Early Nifty MiniDrive in red anodized aluminum
There was enough space in these Mac back then that the Nifty MiniDrive would act as an adapter for microSD cards. They even came in multiple colors.
The Transcend JetDrive Lite 330
It is the Nifty MiniDrive and other early entrants that have set the stage for the Transcend JetDrive Lite 330. It isn’t Transcend’s first drive and they do have some that fit MacBooks as far back as 2010.
All of these drives slip into the SD card slots on your Mac but are sized as to only stick out a hair. Because of this, there is very little overlap in models. Each MacBook with an SD slot has its own corresponding JetDrive.
Back of the 1TB Transcend JetDrive Lite 330
The JetDrive Lite is all plastic with a little lip that protrudes out from the edge of your Mac. It is small enough that it doesn’t get in the way and is just big enough to grasp if you need to remove it.
We were able to remove the JetDrive with just our fingers, but if you have no fingernails you may struggle a bit. Some others we’ve seen have sat flush but required a tool to remove. This way, you can pop it out anytime, anywhere — no tool necessary.
Front of the JetDrive Lite
Transcend has made the JetDrive Lite available in four capacities for the 2021 MacBook Pros. We checked out the 1TB version but 512GB, 256GB, and 128GB capacities are also available.
Speed and performance
Transcend is promising speeds of 95 MB/s and 75 MB/s for reading and writing, respectively. In our copious testing, the JetDrive Lite is on par for these numbers.
Blackmagic Disk Speed Test yielded 90.2 MB/s and 75.2 MB/s, in line with expectations. This puts the JetDrive Lite on the same level as UHS-I SD cards
Testing the JetDrive speeds
As the recent MacBook Pros are capable of UHS-II speeds — up to 312 MB/s — we wanted to know why the company had opted for the slower speeds.
They told AppleInsider that the biggest benefit of the JetDrive Lite is its compact size and ability to be perpetually in your machine and ready for use, not for high-speed transfers.
While this is undoubtedly true, jumping to UHS-II speeds seems not only possible — given the size of UHS-II MicroSD cards — but significantly beneficial to the end-user. Despite the convenience, this was our biggest pain point while using the JetDrive Lite.
Moving to UHS-II speeds would surely up the cost of the drive. This may have been a compromise Transcend was unwilling to make.
Uses and applications
Apple’s current portable Mac lineup does not support user-upgradable storage. Meaning the storage you opt for on purchase is what you’ll be working with years later.
Side view of the JetDrive Lite
The JetDrive is no substitute for the blazing fast internal SSD but it is by far the easiest way to add up to 1TB of additional storage to your Mac. With its speed limitations, there are practical — and non-practical uses for such storage.
By far one of the most common ways to use the JetDrive is to employ it as your Time Machine backup. This works if you have less data on your internal than the JetDrive. If you have the 256GB or 512GB SSD and don’t use all of it, the 1TB JetDrive will be sufficient for this.
We only had about 300GB of data on our internal drive so we wanted to test using the JetDrive as a backup solution. We enabled this and allowed Time Machine to chug away overnight for the initial backup. When we woke our machine the following morning, it had finished.
Using the JetDrive as a backup device
Each subsequent backup took mere moments — depending on how much the data on our Mac changed. Don’t forget though, that if something happens to your Mac, your backup may be lost too. An off-site backup or cloud backup is always ideal.
We preferred to use our JetDrive though just for extra storage. We started saving images and documents not stored in iCloud. Accessing files is relatively speedy depending on their size.
It’s also proved useful for storing movies. When we head out on trips, we download some movies and TV shows to our Mac to access while on the go. These aren’t crucial files which means if we have to remove the card, we aren’t missing much.
It took roughly 45 seconds for us to transfer a 3.75 GB movie to the JetDrive, which isn’t instantaneous, but fast enough to be useful.
While it works well enough for everyday files, we wouldn’t rely on it for video editing. The speed required to edit a 4K video and the vast size of the library makes the JetDrive unusable for this application.
Should you buy the Transcend JetDrive Lite?
Cost-wise, the JetDrive Lite 330 is neither good nor bad. Apple charges $200 to upgrade from 512GB to 1TB of storage. You can spend less than that on the 1TB JetDrive Lite, though it is certainly slower.
1TB Transcend JetDrive Lite 330
If you opt for the 2TB MacBook Pro, Apple charges a whopping $600 from the base configuration and $400 over the 1TB option. Some may opt for slower speeds to save hundreds of dollars.
At the same time, off-brand MicroSD cards are as cheap as $50 for 1TB. Name-brand microSD cards are priced more competitively with the JetDrive Lite.
Overall, this makes JetDrive a solid choice to expand your storage without breaking the bank. It could even save you money based on your needs. Regardless, it’s absolutely the most seamless aftermarket solution out there.
Transcend JetDrive Lite Pros
Designed exclusively for the 2021 MacBook Pros
Doesn’t stick out the side of your Mac
Closest you can get to upgrading your internal storage
Good option for Time Machine backups or storing additional files
This six-part documentary series tells the history of Industrial Light & Magic. It features interviews with famous filmmakers and the people behind George Lucas’ esteemed visual effects studio, and explores how they created some of the most memorable movie scenes of all time. Arrives on Disney+ 7.27.22.
Encrypting Laravel Eloquent models with CipherSweet
July 1st, 2022
CipherSweet is a backend library developed by Paragon Initiative Enterprises for implementing searchable field-level encryption. It can encrypt and decrypt values in a very secure way. It is also able to create blind indexes. A blind index can be used to perform some targeted searches on the encrypted data. The indexes themselves are unreadable by humans.
We’ve just released laravel-ciphersweet. This package is a wrapper over CipherSweet, which allows you to easily use it with Laravel’s Eloquent models.
Preparing your model and choosing the attributes that should be encrypted#
Add the CipherSweetEncrypted interface and UsesCipherSweet trait to the model that you want to add encrypted fields to.
You’ll need to implement the configureCipherSweet method to configure CipherSweet.
use Spatie\LaravelCipherSweet\Contracts\CipherSweetEncrypted;use Spatie\LaravelCipherSweet\Concerns\UsesCipherSweet;use ParagonIE\CipherSweet\EncryptedRow;use Illuminate\Database\Eloquent\Model;classUserextendsModelimplementsCipherSweetEncrypted{useUsesCipherSweet;publicstaticfunctionconfigureCipherSweet(EncryptedRow $encryptedRow):void { $encryptedRow->addField('email')->addBlindIndex('email',newBlindIndex('email_index')); }}
We’ve also added a small helper command to the package that allows you to generate a new key in a way that is suggested by Paragon Initiative Enterprises.
This encryption key is used to encrypt your values.
The command will update all the encrypted fields and blind indexes of the model.
If you have a lot of rows, this process can take a long time since encryption is a resource intensive operation. Don’t worry if it times out for some reason, the command is always restartable and only tries to encrypt models when it’s needed.
Even though values are encrypted, you can still search them using a blind index. The blind indexes will have been built up when you ran the command to encrypt the model values.
Our package provides a whereBlind and orWhereBlind scope to search on blind indexes.
The first parameter is the column, the second the index name you set up when calling ->addBlindIndex, the third is the raw value, the package will automatically apply any transformations and hash the value to search on the blind index.
CipherSweet is a very powerful library, and our package makes it very approachable. Of course, be very sure about what columns actually need encrypting, and don’t overdo it, encryption is resource intensive and comes with some downsides.
We’ll be using this package sparingly in the development of our upcoming SaaS mailcoach.cloud to protect the personal information that will be stored by our users.
Of course, laravel-ciphersweet isn’t the first package that our team has built. On our company website, check out all of our open source packages in this long list. If you want to support us, consider picking up any of our paid products.
Mega Process takes us on a tour of Zion Industrial Co., which apparently is the last shovel factory in South Korea. The laborious process starts with freshly-cut oak trees, milling the timber into boards, sanding until round, trimming, then splitting, steaming, and bending the wood to hold the shape for its handle.
Mega Process takes us on a tour of Zion Industrial Co., which apparently is the last shovel factory in South Korea. The laborious process starts with freshly-cut oak trees, milling the timber into boards, sanding until round, trimming, then splitting, steaming, and bending the wood to hold the shape for its handle.
The homemade gun was used to assassinate former PM Abe in Japan. IMG Twitter
U.S.A. –-(AmmoLand.com)-— Former Japanese Prime Minister Shinzo Abe was assassinated with a homemade gun on July 8th, 2022, in the Japanese city of Nara.
From video of the event, it appears the assassin fired his weapon at Abe from a distance of 20 to 30 feet. The two distinct shots were fired about a second apart and produced copious amounts of white smoke.
Early reports were of wounds to the neck and chest. It is unknown what sort of projectiles were used in the homemade weapon.
Such firearms are extremely easy to make for anyone with a rudimentary ability to use hand tools.
This correspondent made several similar homemade, electrically actuated, multishot, muzzleloading black powder firearms 40 years ago. Electrical firing mechanisms are much easier to make than percussion systems used in modern firearms. A simple switch is a trigger for each barrel. Batteries supply the power to ignite each charge. If you want multiple shots, multiple barrels are used. A nine-volt battery worked well in my 40-year-old experiments, as did a four-pack of AA batteries.
A simple galvanized water pipe is plenty strong to withstand black powder pressures for a few shots. The firearm used in the assassination appears to be close to a 12 gauge bore size. Larger bores and projectiles create sufficient energies at the lower velocities on such firearms.
The propellants for such guns are easily made at home. Many high school students successfully made black powder in my youth. Fireworks can be disassembled as another source of propellant. It has been reported that people in prisons and the former Soviet Union used ground-up match heads as a propellant. Making propellant is much more dangerous than making the guns.
Japan Abe Assassinated with Electrically Fired Homemade Double-Barreled Gun
This correspondent disagrees with professor Daniel Foote of Tokyo.
“This actually shows the extent that Japan gun laws are working,” said Daniel Foote, a professor at the University of Tokyo specializing in law and society. “Very few people have the ability to create such a weapon.”
It is unlikely the professor has ever done the experimental work to make such weapons. Forty years ago, this correspondent was able to make a four-shot repeater from 12 dollars of materials obtained from a hardware store and Radio Shack, using about 12 hours’ worth of labor. In order to be effective with such weapons, testing and practice is necessary. It appears the former Naval officer did the preparation required.
Police found several possible explosives during a raid on Yamagami’s home, and the suspect confessed that he had “manufactured multiple pistols and explosives so far,” NHK said.
Other local reports said that he told cops he initially planned to blow up Abe, but decided to instead build a gun because he feared a bomb was less reliable.
Some sources are saying the assassination occurred at 10 feet. In the video referenced above, the distance appears to be 20 to 30 feet. There did not appear to be any sights on the homemade firearm. Today, some sort of laser pointer would be easy to install and bore sight. But NO mention of a laser has been made to this correspondent’s knowledge.
The successful assassination of former Japanese PM Abe, with a homemade firearm in a country with some of the most extreme firearms restrictions on the planet, shows how difficult it is to regulate what is essentially a 15th-century technology.
About Dean Weingarten:
Dean Weingarten has been a peace officer, a military officer, was on the University of Wisconsin Pistol Team for four years, and was first certified to teach firearms safety in 1973. He taught the Arizona concealed carry course for fifteen years until the goal of Constitutional Carry was attained. He has degrees in meteorology and mining engineering, and retired from the Department of Defense after a 30 year career in Army Research, Development, Testing, and Evaluation.

 Database complexity is bad for business.
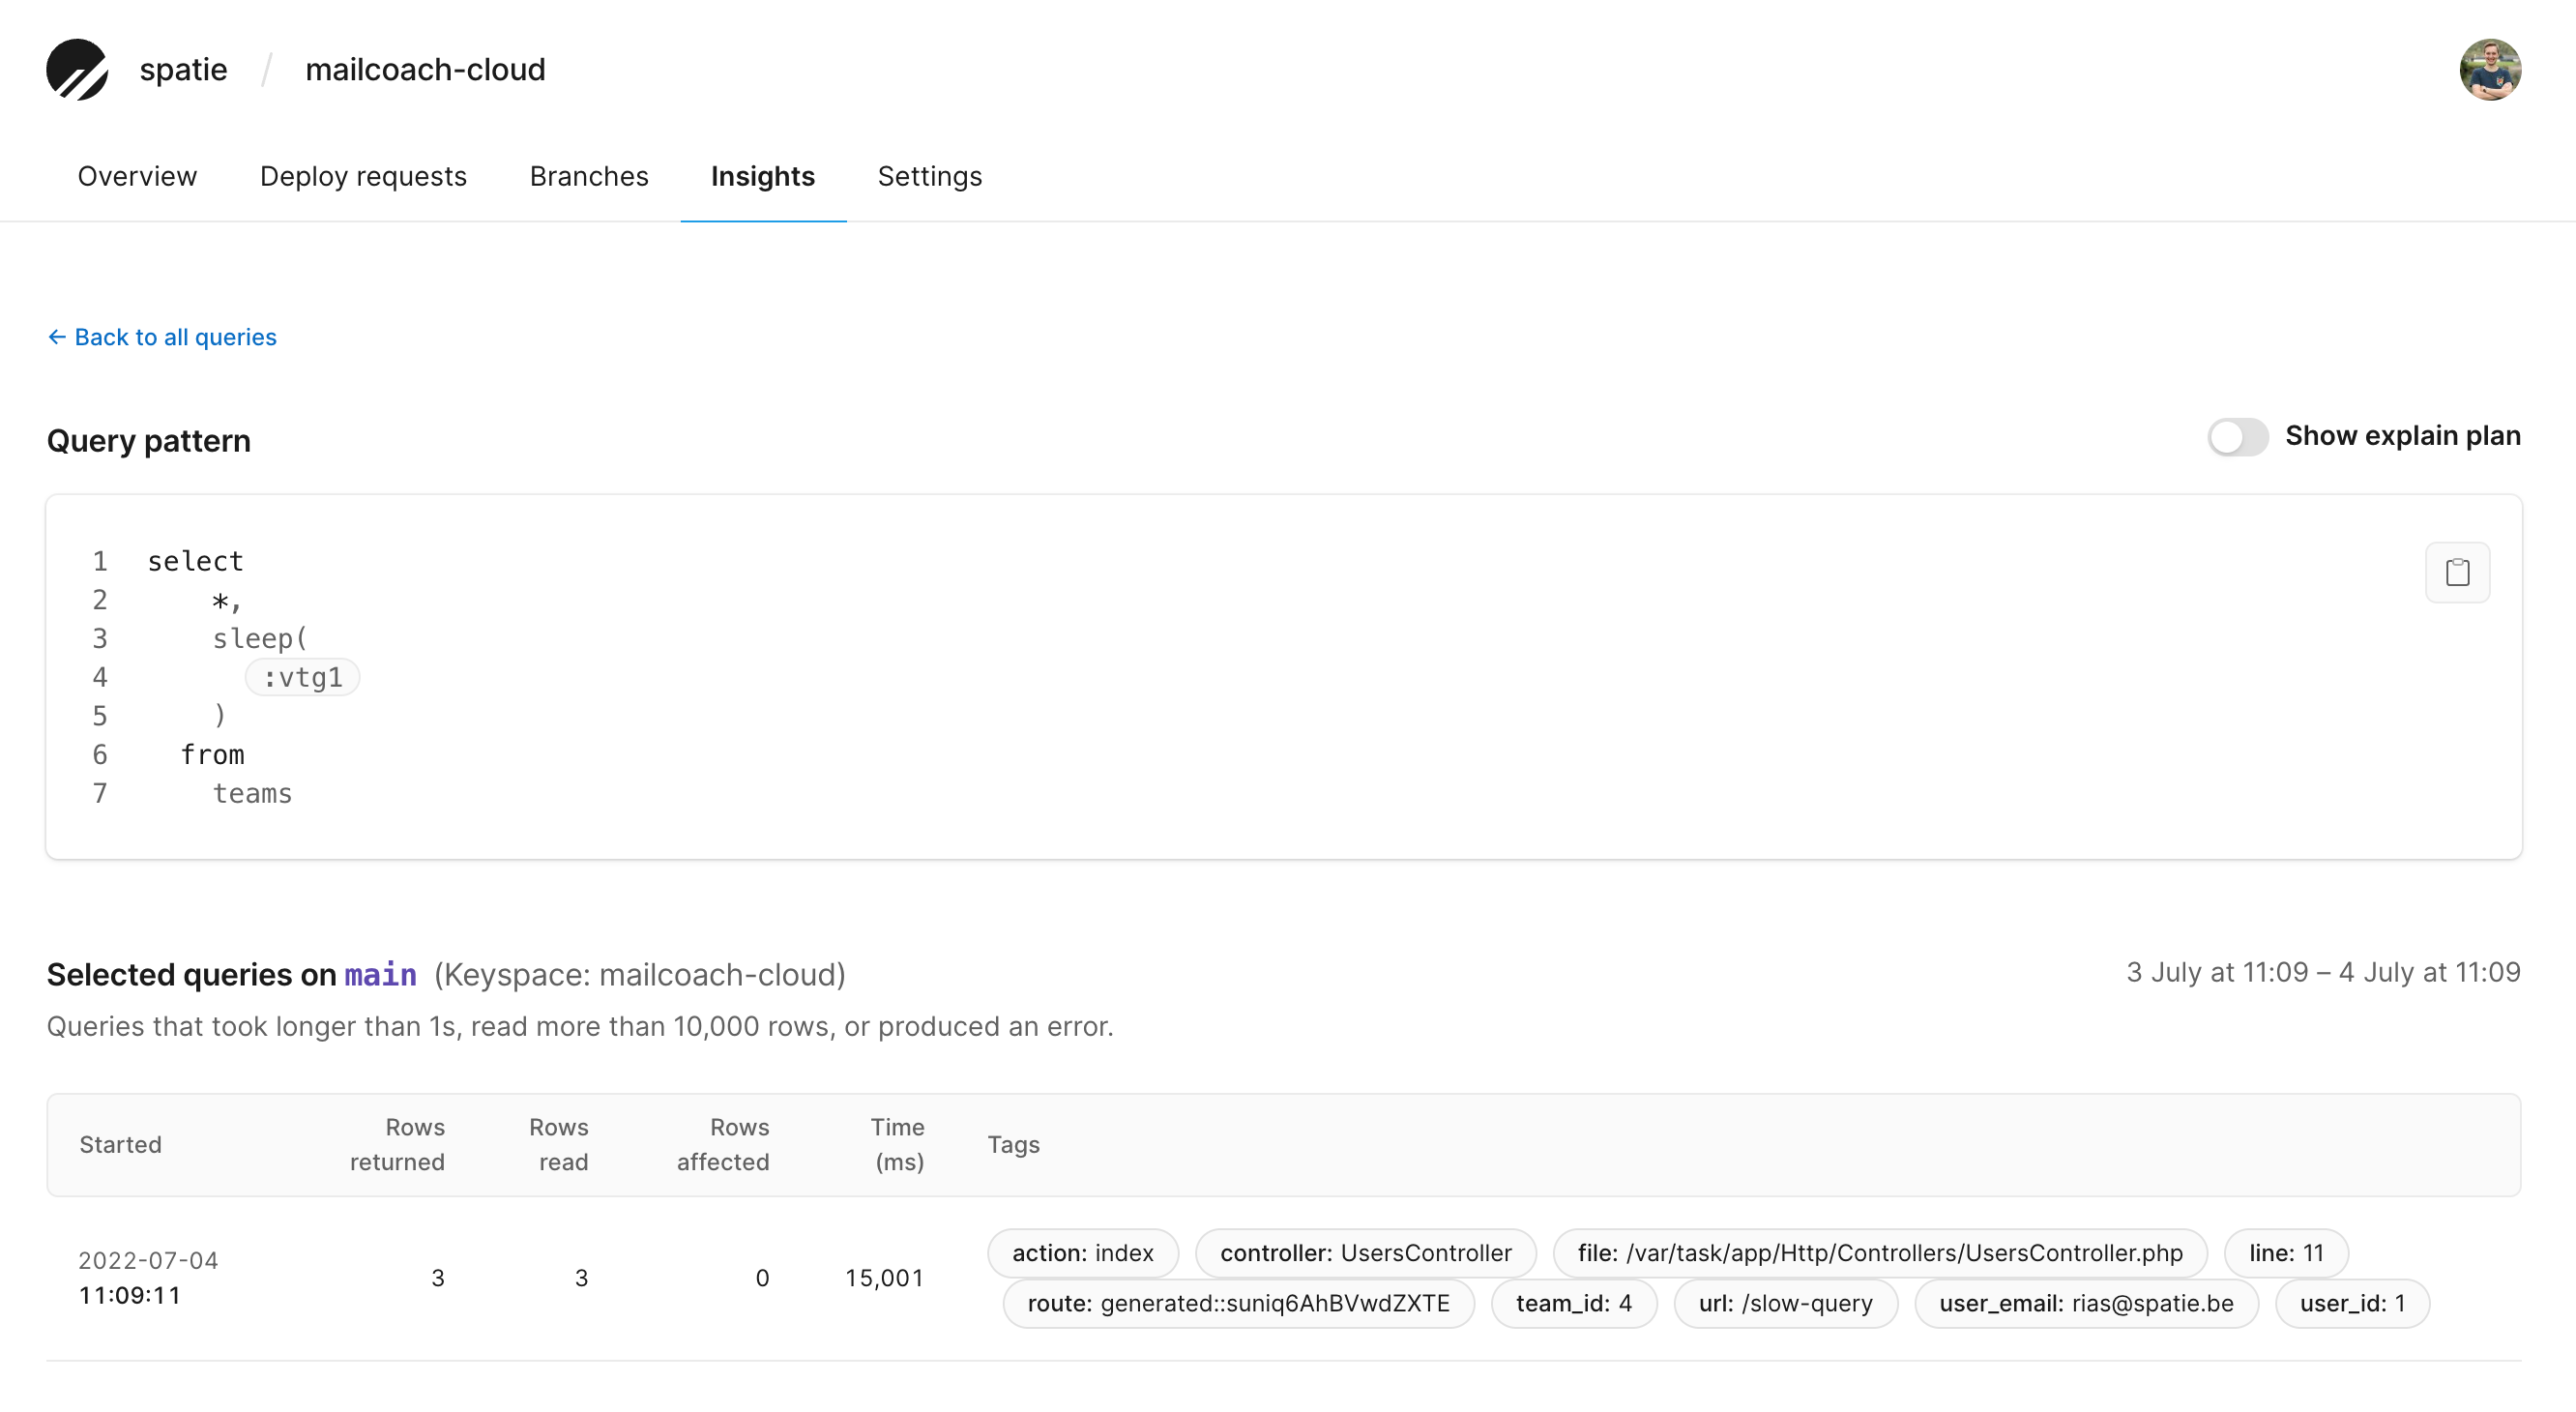

 Learn More: Read the