https://static0.makeuseofimages.com/wordpress/wp-content/uploads/wm/2025/07/plex-apple-tv-app-icon.jpg
One of the hardest lessons I learned shortly after I started my Plex server was to never ignore organizing your library. It’s one of those tidbits you wish someone would tell you before you start using Plex, but live and learn, right? Having a good foundation beforehand is important and will literally save you hours, possibly days, of backtracking and fiddling.
However, there’s one app that was particularly great at not only putting the finishing touches on my library, but it also helped fix cover images, artwork, subtitles, and even the naming scheme. If you’re going to run your own Plex server, FileBot double-checks your work so you don’t have to.
FileBot is a simple but effective double-checker
It’s like my second-in-command
 Brady Meyers / MakeUseOf
FileBot isn’t a Plex plugin or an add-on, but a separate app, so you won’t need to fiddle with Docker (although you still have that option). You download the app and use it to locate your library folders, though there is a choice between a one-year or lifetime license. Installing it is still free, but a license is required for continued use. However, older versions also work, as long as you avoid updating them.
What you do with FileBot is have it scan your Plex library for the sake of mass organizing your media. Did you make the same mistake I did and haphazardly name movies and TV shows? Did you bother creating enough folders? Maybe your media is missing cover photos (or needs new ones) or lacks subtitles? FileBot rectifies those mistakes by fetching metadata that Plex might have missed.
Fixing the problem with cover images
Sometimes Plex doesn’t get it right
It’s not that Plex is bad at grabbing cover images, but it doesn’t always get it right. For example, I have Clash of the Titans on my server. Which one, you ask? Well, Plex incorrectly chose the cover art from the 2010 remake, when it’s actually the original film from 1981, in all its stop-motion glory.
Ideally, you want to do this before you rename your media files so you can knock out two birds with one stone. On the right-hand side, in the Rename tab, click Settings—the tiny wrench and screwdriver icon, then open Post Process.
Make sure Fetch artwork and Fetch cover images are check-marked, then click OK. When you’re ready to rename your media files, FileBot will also download images. More importantly, Plex will look nice and organized when everything is said and done.
Unifying my Plex library’s naming scheme
This is what I get for being lazy
The most powerful use case for FileBot, and the biggest reason I needed to use it, was to fix the really poor naming scheme I had going. I was far too careless with how files were named, like the lack of capitalization, using abbreviations, or just a lack of basic episode structure. It was downright frustrating finding a specific episode because I had duplicate names or failed to specify the number.
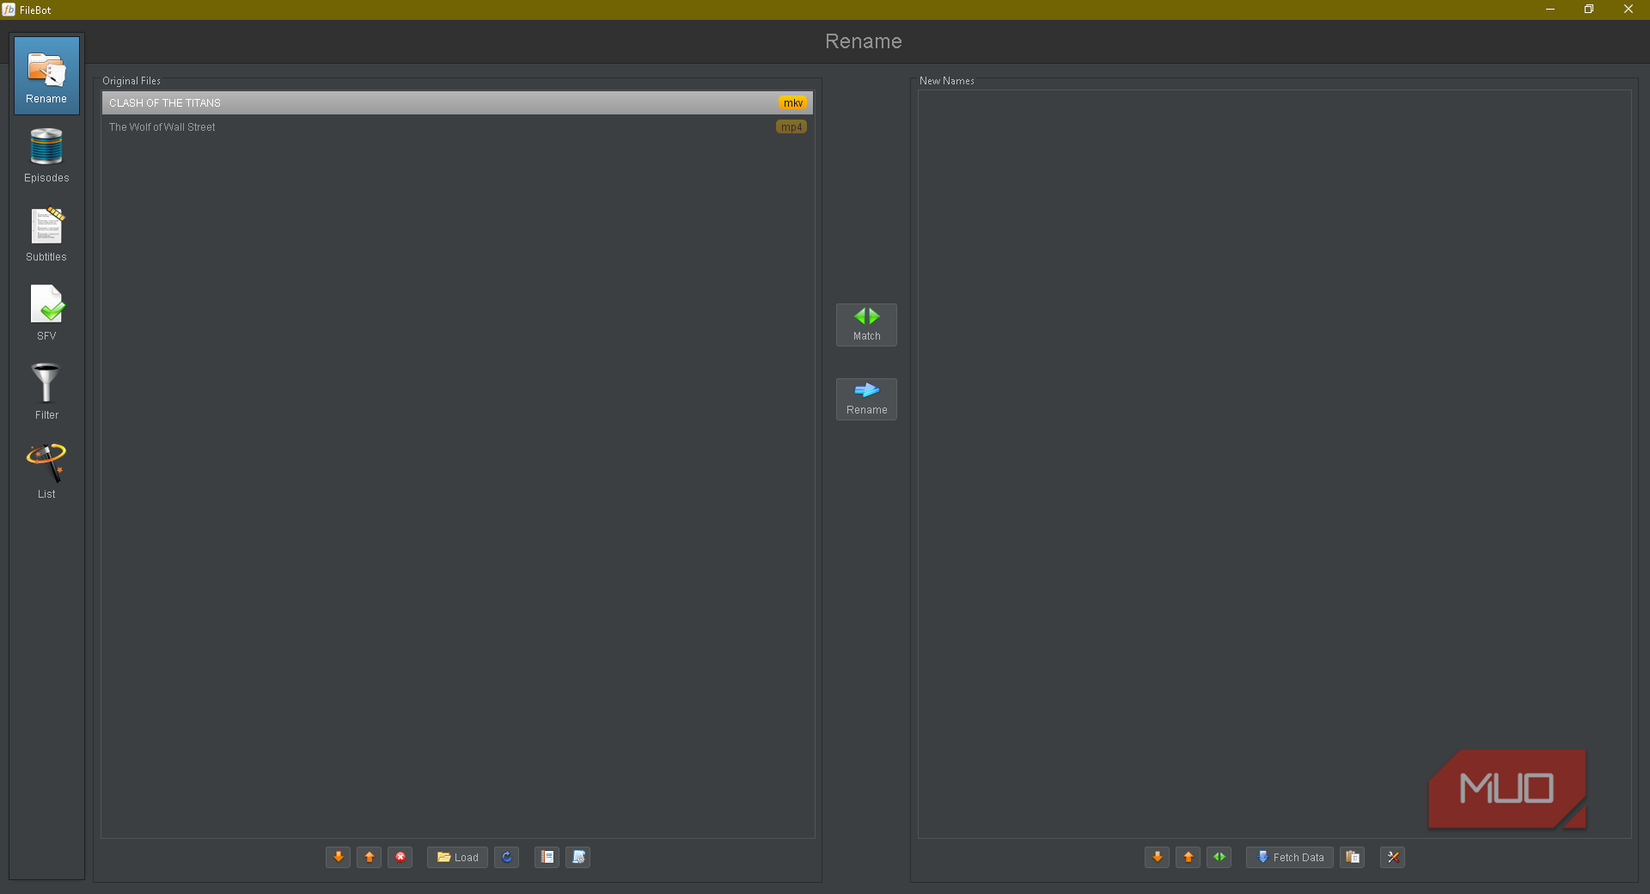
FileBot can take my entire Plex library and rename it with just a few clicks. Additionally, you can adjust the way movies, shows, and even music are formatted. Click Rename on the left-hand side, then Load at the bottom, and locate a folder you want to edit. On the right-hand side, click Fetch Data, then Edit Format from the menu.
Here’s where you can either write your own script or pick any of the formats already written under Examples. Also, on the bottom-left, use the arrows to switch between content types, like movies, TV shows, and music. Clicking on the line of code will then set the format, and you can finalize with Use Format. Exit the menu, then highlight every file on the left. Click Match, then finalize with Rename. It’s that easy!
I save time downloading subtitles
You can pick and choose a lot of languages
Depending on the software you use, ripping DVDs can be a lengthy and tedious process. I find it to be the worst part of setting up your Plex server, as you’re limited to playing a single movie at a time. So, what I do is limit the number of assets I have to rip, which means goodbye subtitles. However, this does introduce another problem: I like subtitles, especially when I’m watching anime in its original language.
Luckily, FileBot can help me out with that, too; in fact, I find it easier to rip a couple of movies without subtitles, then download them after and even snag a couple of languages the original DVDs may not have. You will need an OpenSubtitles account, though, since that’s where FileBot pulls translations from. The way it works is so simple, and I attribute that to FileBot’s basic UI.
On the left-hand side, click on Subtitles. You can then log into your OpenSubtitles account using the little green button next to the language drop-down menu at the top. To the left of that is where you search for a specific movie, and the Find button to the right of the language drop-down menu is what you use to scan for subtitles. Double-click on any of the search results, and FileBot will download them right away.
I just love that FileBot is so easy to use
My Plex library would probably still be an awkward, uncoordinated mess if it weren’t for FileBot. What I do appreciate is how easy it was to rectify the inconsistencies in naming and artwork, given its surprisingly simple UI. I’ll gladly trade features if it means having an easier time installing an app and navigating the menus.
MakeUseOf