An anonymous reader quotes a report from New Scientist: People withAlzheimer’s disease have lower levels of lithium in their brains, and giving lithium to mice with symptoms of the condition reverses cognitive decline. Together, the findings suggest that lithium deficiency could be a driver of Alzheimer’s disease and that low-dose lithium medications could help treat it. […] [Bruce Yanknerat Harvard University] and his colleagues analyzed levels of 27 metals in the brains of 285 people after they died, 94 of whom were diagnosed with Alzheimer’s disease and 58 of whom had mild cognitive impairment, a precursor of the condition. The other participants showed no signs of cognitive decline at the time of their death.
Lithium levels in the prefrontal cortex — a brain region crucial for memory and decision-making — were about 36 percent lower, on average, in people with Alzheimer’s disease than in those without any cognitive decline. For those with mild cognitive impairment, lithium levels were about 23 percent lower. "We suspect that’s due to a number of environmental factors: dietary intake, genetics and so forth," says Yankner. Yet there seemed to be another reason, too. In those with Alzheimer’s disease, clumps of proteins called amyloid plaques contained nearly three times the amount of lithium as plaque-free regions of their brain. "Lithium becomes sequestered in these plaques," says Yankner. "We have two things going on. There is impaired uptake of lithium [in the brain] very early on and then, as the disease progresses, the lithium that is in the brain is further diminished by being bound to amyloid."
To understand how this influences cognition, the team genetically engineered 22 mice to develop Alzheimer’s-like symptoms and reduced their lithium intake by 92 percent. After about eight months, the animals performed significantly worse on multiple memory tests compared with 16 mice on a standard diet. It took lithium-deficient mice around 10 seconds longer to find a hidden platform in a water maze, for example, even after six days of training. Their brains also contained nearly two and a half times as many amyloid plaques. Genetic analysis of brain cells from the lithium-deficient mice showed increased activity in genes related to neurodegeneration and Alzheimer’s. They also had more brain inflammation and their immune cells were less able to clear away amyloid plaques, changes also seen in people with Alzheimer’s disease.
The team then screened different lithium compounds for their ability to bind to amyloid and found that lithium orotate — a naturally occurring compound in the body formed by combining lithium with orotic acid — appeared to be the least likely to get trapped within plaques. Nine months of treatment with this compound significantly reduced plaques in mice with Alzheimer’s-like symptoms, and they also performed as well on memory tests as normal mice. These results suggest lithium orotate could be a promising treatment for Alzheimer’s. The findings have been published in the journal Nature.
For decades, the common way to set fence posts was to dig a hole below the frostline, tamp some gravel in the bottom for drainage, place your post, then set it in concrete.
This is time-, materials- and labor-intensive. To dig the hole, you need a post hole digger or a powered auger, both of which are hard work.
You need gravel, as well as concrete and water; transporting those heavy items to a remote jobsite is another hassle. Mixing the concrete and water requires a wheelbarrow or tubs, which get messy and need to be cleaned afterwards. Lastly you have to wait for the concrete to set before you can apply any pressure to the post, for instance to tension the wire fencing it will support.
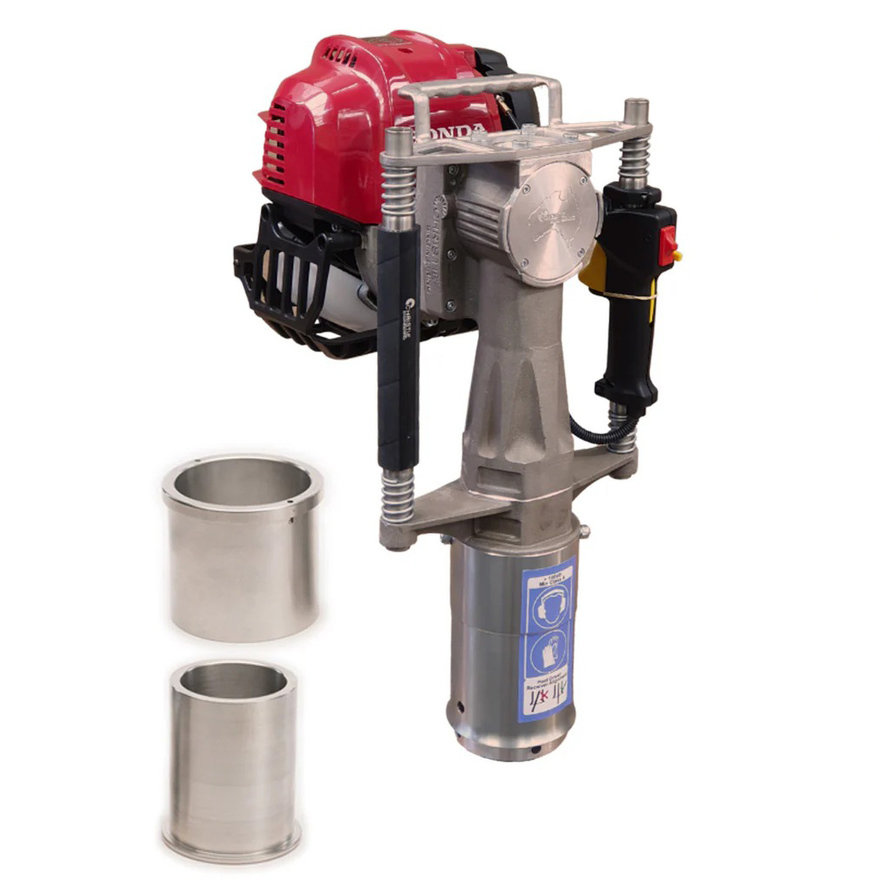
It’s little wonder that gas-powered fence post drivers are growing in popularity. These portable tools use a small engine to power an internal hammering mechanism.
In the absence of concrete, stability is achieved simply by driving the post deep into the ground. Once you’ve muscled the tool into place, it does the bulk of the work.
For shorter people, or for driving extra-tall fence posts, models like this Easy Petrol Post Driver offer extension handles.
These tools, which generally weigh 25-35 lbs, are far easier to haul to a jobsite than all of the materials required for a concrete-set post. All you need is the tool and a gas can.
In Friday’s LinkSwarm, we covered how Sig Saur’s problem with uncommanded discharges from the P320 got still more serious with the death of an Air Force airman. This has been a low-level, intermittent story that’s been bubbling on for many years now, with no root cause anyone could find for the problem.
Well, we may finally have the root cause.
But first the caveat: I am not a gunsmith, and I have no way to determine how plausible the explanation is, if the methodology is sound, or if the applies to a significant number of P320s rather than the one the YouTuber is testing.
Executive Summary: YouTuber Wyoming Gun Project was able to get repeated P320 discharges by putting one millimeter of pressure (not a full pull) on the trigger and manipulating the overly loose slide.
That should not happen.
If you just want to skip to the money shot, skip to the beginning of the second video. But first up, I have Forgotten Weapons’ Ian McCollum describing the issue in detail with his usual clarity. (I don’t think he had seen Wyoming Gun Project’s video before recording this.)
“Things have changed again for Sig with the death of a US Air Force serviceman, from apparently a P320 in its holster. Obviously, not good.”
“I think it has gotten to the point where Sig is now faced with a problem they cannot solve. They have two problems now. One of them in theory they can solve, and that is a hypothetical mechanical problem with the 320 that causes it to fire without someone pulling the trigger or commanding it to fire.”
I’m skipping over the part where he says that no root cause was found, because, again, this video came presumably out before he had a chance to see the Wyoming Gun Project video.
“There have been dozens of [P320] lawsuits, and only two of them have actually come back with Sig being found liable.”
“But even if they do fix it, they have a secondary problem right now that I don’t think is surmountable. They can theoretically fix the mechanical problem. What they cannot fix is the reputational issue.”
“The fundamental issue here is that the 320 doesn’t offer anything different from any of its competitors.” Shooters originally liked the modular design, but now lots of platforms do that, and now there are better choices in the same space. No institutional buyer is going to choose the P320 over competing choices now because the risk is too high.
“What does the SIG 320 offer us that would convince us to buy it despite this element of unknown potential risk? Nothing. That’s the problem.”
“There are actually three separate problems with the 320. Two of them absolutely 100% provable. The third one is still the jury’s out, literally and figuratively.”
“Problem number one was the drop safety. There was a legit drop safety problem with the original 320s. And it’s entirely Sig’s fault. They should have been more careful. That’s like, you know, it’s not like surprise drop safety. What? We didn’t even think about drop safety. No, they they should have been more careful.”
“And when the guns proved to have a drop safety fault, they didn’t recall them, presumably because that would have been super expensive even at that point. They offered a voluntary upgrade, which a lot of people didn’t get because they’re like, ‘Ah, my gun doesn’t need it. It’s fine. It’s voluntary. That means it’s not that important.’”
“Because that happened, Sig got into people’s heads, oh, that’s the gun that fires if you drop it. And it was true. I mean, within the limitations of the actual mechanical flaws of the drop safety.”
“The second issue is Sig did not put a trigger safety on the 320. Do you technically need it? No.” Presumably to differentiate on better trigger feel.
McCollum thinks that’s a mistake. “It’s not an issue with the trigger pull and it very much does prevent accidental discharges with holsters. If your holster is kind of wonky, if you get your shirt caught when you’re holstering the pistol. Absolutely a thing that can happen and that does happen and that a trigger safety will often prevent from turning into a fired gun.”
“I don’t know how many of their unintended discharge incidents are the result of something catching on the trigger and unintentionally pulling it, but I feel pretty safe assuming it’s greater than 0%. And so if they had a trigger safety on the gun, it would have prevented some percentage of these issues.”
Given the first two problems, shooters now just assume there’s a third, still unidentified flaw lurking in the gun.
“If you’re another gun company looking at this situation, I think one of the lessons to take away from it is you need to take safety seriously enough that you address it in positions where, you know, do we really need to hand like is this enough of a safety issue that we really need to do it? Maybe make sure that you’ve pushed that decision boundary pretty darn close to yes, we should always do something in favor of more safety in the design.”
“Could Sig survive recalling all the 320s that are out there? I don’t know. Maybe, maybe not.”
“Looking at the other guns that Sig has available, I think their best option would be to expand the P365 in scope and scale this thing out of production and replace it. You know, they’ve got the 365 macro, come up with like the 365 service issue size. The P365 is a fundamentally different mechanism than the 320.”
“The 320 is a development off the P250. And that’s probably where some of its problems originate from, if not all of them.”
Now the Wyoming Gun Project video:
It’s a 40 minute video, because he goes into significant detail on his methodology. So you get lots of caliper measurement, among other things.
“Basically we were able to input a millimeter or less of downward movement on the sear and get this slide by manipulating the slide. We’re able to get it to go off and actually fire a primed case five times in a row.”
That’s bad.
Measuring off the grip: “66.62mm was where the wall was. So that’s the start. That’s the end of the pre-travel, but the start of the actual trigger pull where we’re moving parts, right?”
65.69 is where he’s able to set the screw so that the striker will actuate by touching the slide.
“I’m not a math wiz, but that’s less than one millimeter. Less than one millimeter into the firing sequence and it just dropped the striker.”
“If this trigger, this trigger assembly in here is less than 1mm out of spec, you could have a potential problem.”
“That’s kind of simulating of it’s rolling around in a cop’s holster. Now, we saw the first one was less than a millimeter. So, if one of these parts is out of spec, less than a millimeter, or what if this is able to because this affects the trigger when you pull it back.”
The screw, which a lot of people have focused on, is to simulate the 1mm pull without having the inherent imprecision having an actual human finger there would introduce. “This is a tool to simulate to take the human factor out so that you same people that will come in my comments and say this aren’t going, ‘You pulled the trigger with your finger, bro.’ I didn’t. I didn’t. But I simulated a human taking up the pre-travel going through the firing motion or the firing sequence.”
“The FBI report said there was a ledge on, it was either the sear or the the striker hook, I don’t remember, and you pulled the trigger a little bit less than a millimeter, less than one millimeter, and it caught on that ledge and then you holstered your gun. Okay, this is a G-code holster. Then you holstered your gun, and it just went off.”
“So some people were like, ‘Put it in a holster and see if it goes off.’ There it is.”
I’m skipping over a lot of methodology walk-through here.
“There should be absolutely no way that you should be able to put input into the slide and it drops the striker. No way. There should be none.”
“Why, if you move the slide, will it set the sear off? If you’re halfway into the if you’re not even halfway less than a millimeter, less than one millimeter, and you bump the slide, and it has the potential to go off.”
He gets the gun to fire with the 1mm screw setting by manipulating the slide, and seems very surprised that he could do it.
“The striker safety is working. Look at that. The spring is working. Holy crap. Holy crap.”
Then he gets the P320 to go off again, under the same circumstances, four more times. “That was five in a row, guys. Five in a row. Is that consistent enough for some of the people out there? Do you want me to do it every day until Sig fixes the gun?”
While this is not quite “vice-gripped to a test mount on a granite slab table in an FBI safety lab” level quality control, it does indeed seem pretty repeatable. It’s a cascading failure where two separate things have to go wrong. But neither of those two separate things is some inconceivable, unlikely scenario.
Bonus video: Penguinz0 commenting on the situation, which is where I first heard about the Wyoming Gun Project video, and includes a lot of footage from that video, if you just want the Cliff Notes version.
“It’s a widely reported problem apparently linked to more than a hundred incidents since 2016, with at least 80 injuries.” Ouch! If those numbers are true, it seems this is a much wider-spread problem than I thought.
“Even in my neck of the woods here in Tampa, an officer in 2020 had the weapon fire while in his jacket while he was adjusting it.”
“I don’t think this is going to happen all the time to every P320 out there, but the fact that it can happen at all is concerning.”
Star Trek faces an uncertain future at the moment, as shows that helped define its streaming renaissance endone by one, and little is known about what lies on the horizon (especially thanks to current events in our own world). So it’s perhaps fitting, then, that the one new show we do know is coming is all about welcoming a new generation back to Star Trek‘s fundamental ideals after a similar period of uncertainty: Starfleet Academy.
To close out today’s packed Hall H panel at San Diego Comic-Con, Paramount released the first trailer for Star Trek: Starfleet Academy. Set in the 32nd century after the events of Star Trek: Discovery, the series will follow the first new class of cadets to enroll at the titular academy in San Francisco in over a century, as the Federation rebuilds and reconnects after the cataclysmic events of “The Burn” from Discovery‘s third season.
The new trailer, aside from being packed with references to all of Star Trek history (from Academy wing names to courses on figures like Captain Sisko), introduces us to a whole host of new and familiar faces as classes begin. The series will be led by Holly Hunter, who plays Nahla Ake, the captain of the U.S.S. Athena, a long-lived half-Lanthanite (the same humanoid species as Strange New Worlds‘ Commander Pelia, played by Carol Kane) who also serves as the Academy’s chancellor.
Among the senior staff at the academy, she’ll be joined by Discovery‘s Tig Notaro and Voyager‘s Robert Picardo, reprising their roles as Jett Reno and the Emergency Medical Hologram simply known as the Doctor, respectively—they’ll also be joined in a guest star capacity by Discovery‘s Mary Wiseman and Oded Fehr as Sylvia Tilly and Admiral Vance, respectively. One new addition to the campus staff is Gina Yashere’s Lura Thok, the Athena‘s first officer as well as Starfleet Academy’s cadet master—fascinatingly, a half-Klingon, half-Jem’Hadar, the genetically engineered footsoldiers of the Dominion from Deep Space Nine.
Of course, an academy needs students, and Starfleet Academy will follow a whole host of new recruits making their way through training. Here’s the rundown:
Sandro Rosta plays Caleb Mir, a troubled orphan who finds himself in the unlikely circumstance of signing up for Starfleet, with a connection to Chancellor Ake, and currently unsure of which division track he will fit into.
Karim Diané plays Jay-Den Kraag, a Klingon cadet in the sciences division who aspires to be a medical officer.
Kerrice Brooks plays Sam, a.k.a. Series Acclimation Mil, the first member of her species, the Kasqians, to sign up for Starfleet as a member of the operations division.
George Hawkins plays Darem Reymi, a command-track cadet from the wealthy world of the Khionians.
Bella Shepard plays Genesis Lythe, another command-track student from the planet Dar-Sha, and the daughter of a Starfleet admiral looking to step out of the shadow of her family’s legacy.
Although it’s unclear if she’ll play an attending academy student, the young cast is rounded out by Zoë Steiner playing Tarima Sadal, the daughter of the president of Betazed (a long-time member of the Federation, although it’s currently unknown if the planet left and rejoined during the Burn).
Even if Starfleet Academy is a school-set series, Star Trek still needs a baddie, and the show will have one in the form of Paul Giamatti, cheekily and mysteriously introduced at the end of the trailer. Giamatti plays Nus Braka, a seedy gang leader (and himself another half-Klingon, this time a Klingon/Tellarite hybrid) who has some ominous connections to one of the new cadets at the academy.
The first season of Starfleet Academy is set to begin streaming on Paramount+ in early 2026. The show has already been renewed for a second season.
More rimfire and fold-ability for the People! Smith & Wesson has released the M&P FPC 22LR folding rifle and the M&P22X pistol, both chambered in .22 Long Rifle. The M&P FPC 22LR and M&P22X share magazines and offer suppressor-ready features.
The FPC 22LR rifle has a 16.25-inch threaded barrel and includes three 20-round magazines. It features a Picatinny rail, M-LOK slots, and a folding mechanism compatible with top-mounted optics.
The has a 4.1-inch suppressor-ready barrel, full-size frame, Picatinny rail, and two 20-round magazines compatible with the FPC. It includes Hi-Viz LiteWave H3 sights with customizable fiber optics and a hammer-fired trigger.
Both are optics-ready and available in 10-round compliant models.
M&P FPC 22LR Specification
Caliber: .22 Long Rifle
Overall Length: 30.375 inches
Folded Length: 16.375 inches
Barrel: 16.25 inches, threaded (½ x 28)
Stock: Fixed, 14.5-inch length of pull, with magazine storage
Magazines: Three 20-round magazines included (10-round compliant models available)
Handguard: Features upper Picatinny rail and M-LOK® slots for accessory mounting
Folding Mechanism: Horizontal folding with locking latch, compatible with most top-mounted optics
Grip: Compact, with four interchangeable palmswell inserts
Trigger: Flat-face design with crisp break and reset
Optics-Ready: Accepts standard red dot sights
The MSRP is $549, and you can’t fold that in half.
M&P22X Pistol Specifications
Caliber: .22 Long Rifle
Frame: Full-size
Barrel: 4.1 inches, suppressor-ready with ½ x 28 thread adaptor and wrench included
Magazines: Two 20-round magazines included, compatible with M&P FPC 22LR (10-round compliant models available)
Sights: Hi-Viz® LiteWave H3® fiber optic front sight, black serrated square-notch rear sight; includes replacement tool with red, white, and green fiber optic options
Rail: Picatinny-style for accessory mounting
Grip: Slim design for reduced recoil
Trigger: Hammer-fired, crisp pull
Optics-Ready: Compatible with standard red dot sights
The M&P® 22X has an MSRP of $499.
It’s pretty cool to be able to buy both a rifle and pistol in .22LR for around 1000 bucks. To keep my own training and skills entertained, I shot some suppressed 22LR yesterday, and I can’t recommend it enough.
Other times, you just call up a company’s IT service desk and pretend to be an employee who needs a password reset, an Okta multifactor authentication reset, and a Microsoft multifactor authentication reset… and it’s done. Without even verifying your identity.
So you use that information to log in to the target network and discover a more trusted user who works in IT security. You call the IT service desk back, acting like you are now this second person, and you request the same thing: a password reset, an Okta multifactor authentication reset, and a Microsoft multifactor authentication reset. Again, the desk provides it, no identity verification needed.
So you log in to the network with these new credentials and set about planting ransomware or exfiltrating data in the target network, eventually doing an estimated $380 million in damage. Easy, right?
According to The Clorox Company, which makes everything from lip balm to cat litter to charcoal to bleach, this is exactly what happened to it in 2023. But Clorox says that the "debilitating" breach was not its fault. It had outsourced the "service desk" part of its IT security operations to the massive services company Cognizant—and Clorox says that Cognizant failed to follow even the most basic agreed-upon procedures for running the service desk.
In the words of a new Clorox lawsuit, Cognizant’s behavior was "all a devastating lie," it "failed to show even scant care," and it was "aware that its employees were not adequately trained."
"Cognizant was not duped by any elaborate ploy or sophisticated hacking techniques," says the lawsuit, using italics to indicate outrage emphasis. "The cybercriminal just called the Cognizant Service Desk, asked for credentials to access Clorox’s network, and Cognizant handed the credentials right over. Cognizant is on tape handing over the keys to Clorox’s corporate network to the cybercriminal—no authentication questions asked."
I can has password reset?
From 2013 through 2023, Cognizant had helped "guard the proverbial front door" to Clorox’s network by running a "service desk" that handled common access requests around passwords, VPNs, and multifactor authentication (MFA) such as SMS codes.
This gadget converts any TV with a USB port into a digital signboard, like the ones you see in restaurants. It’s compatible with dozens of digital signage content management services (subscribed separately) to display and manage one or more digital signs from your phone. In addition to still images, the signage stick can stream 4K video and supports Wi-Fi 6E connectivity.
Suppressors come with their own set of pros and cons and useful tools to have. The alignment rod is one such tool! Learn more and get the right one for you.Recoil


 Suppressors come with their own set of pros and cons and useful tools to have. The alignment rod is one such tool! Learn more and get the right one for you.Recoil