Key Takeaways
- The len() function is useful for determining the number of items in a list, saving time and code compared to manual calculation.
- The append() function adds a new item to the end of a list, allowing for easy modification based on conditions or user input.
- The extend() function adds multiple items to an existing list at once, simplifying the process of modifying a list with new elements.
Lists form an essential part of data structures and algorithms in Python. They play an important role, and ignoring them in your projects is almost impossible.
Due to the large importance of lists, Python provides some built-in functions to perform common list operations. These functions aim to help developers work faster and easier.
1. The len() Function
Use the len() function to get the number of items inside a list. Here’s an example:
 my_list = [1, 2, 3, "hello", "rice", "code", 1.2]
list_length = len(my_list)
print(list_length)
Without the len() function, you would have to manually calculate length, like in this example which uses a Python for loop:
 my_list = [1, 2, 3, "hello", "rice", "code", 1.2]
count = 0

for i in my_list:
    count += 1

print(count)
From this example, it is obvious that the len() function saves some code. Ensure you use it whenever the need arises.
2. The append() Function
The append() function adds a new item to the end of your list. A good use of this is to add an item to your list after your code fulfills a certain condition. Here’s a simple example:
 my_list = [1, 2, 3, "hello", "rice", "code", 1.2]
question = input("Do you love Python?: ").lower()

if question == "yes":
    my_list.append("Python is the best!!")
else:
    my_list.append("You should try Python")

print(my_list)
This example uses an if statement to add a certain sentence to the initial list based on the user’s input.
The append() function can add only one item at a time to your list. Instead of the append function, you can use an operator instead:
 my_list = [1, 2, 3, "hello", "rice", "code", 1.2]
my_list += ["Python is the best!!"]
Using the addition operator will ultimately be less efficient because it doesn’t modify your initial list. Instead, it creates a new list in memory and adds a new item to it. The append() function modifies your initial list directly.
3. The extend() Function
The extend() function is a built-in function that adds several items to an existing list at once. It takes in the new items as an argument and modifies your existing list with the argument. Here’s how to use the extend() function:
 my_list = [1, 2, 3, "hello", "rice", "code", 1.2]

my_list.extend(["item", "muo", 350])

print(my_list)
The extend() function can only take one argument, so you should add all your items to a list like the code above.
4. The reverse() Function
The reverse function simply rewrites your list in the reverse order. Here’s an example of the reverse function in use:
 my_list = [1, 2, 3, "hello", "rice", "code"]

my_list.reverse()
print(my_list)
To reverse a list without using the reverse() function, you would need to slice your list. Here’s an example:
 my_list = [1, 2, 3, "hello", "rice", "code"]

reversed_list = my_list[::-1]
print(reversed_list)
In the above example, my_list[::-1] creates a reversed copy of the original list. This means you’ll have two lists in memory, which is not the best approach if you simply want to reverse the original list.
5. The insert() Function
The insert() function modifies a list and adds an item to it like the append() function. However, the insert() function allows you to specify the index (position) of your new item in the list. Here’s an example:
 my_list = [1, 2, 3, "hello", "rice", "code"]

my_list.insert(0, "first")
print(my_list)
From the above code, this is the correct syntax to use the insert() function:
your_list.insert(index, new_list_item)
6. The sort() Function
The sort() function takes a list of a particular data type and rearranges the elements in ascending order. Here’s an example:
 my_list = [1, 2, 10, 30, 3, 2.4]
my_list2 = ['code', 'rice', 'zion', 'hello']

my_list.sort()
my_list2.sort()

print(my_list)
print(my_list2)
If you use the sort() function on a list with different data types, such as strings and numbers, you will get a TypeError.
7. The count() Function
The count() function counts the number of times a specific element occurs in a list and returns the value to you. Here’s how to use it:
 my_list = ['code', 10, 30, 'code', 3, 'code', 'rice', 5]
print(my_list.count('code'))
Performing such an operation without the count() function would require you to write more code. Here’s an example:
 my_list = ['code', 10, 30, 'code', 3, 'code', 'rice', 5]
count_code = 0

for item in my_list:
    if item == 'code':
        count_code += 1

print(count_code)
The len() function will return the total number of elements in a list, while the count() function will return the number of times a specific element occurs in a list.
Using List Functions to Write Better Code
When working with lists in Python, it is important to use the available list functions to write efficient and clean code. They generally save you from writing complex and time-consuming code.
List functions enable you to easily perform common list operations, giving you more time to focus on other parts of your code.
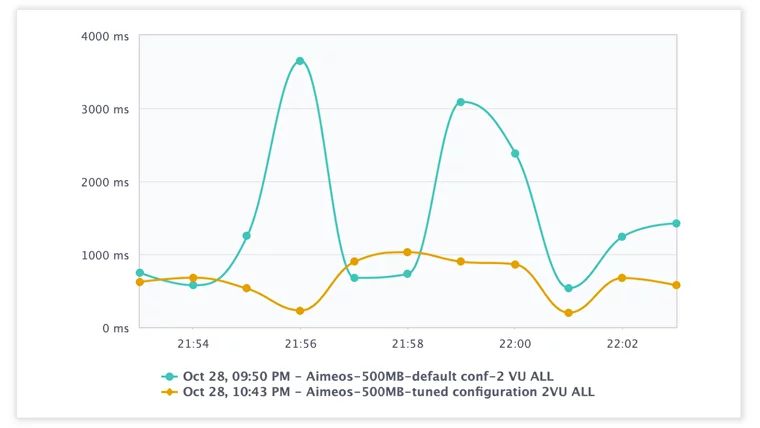 Response Time (ms), Aimeos Tuned MySQL Configuration vs Default
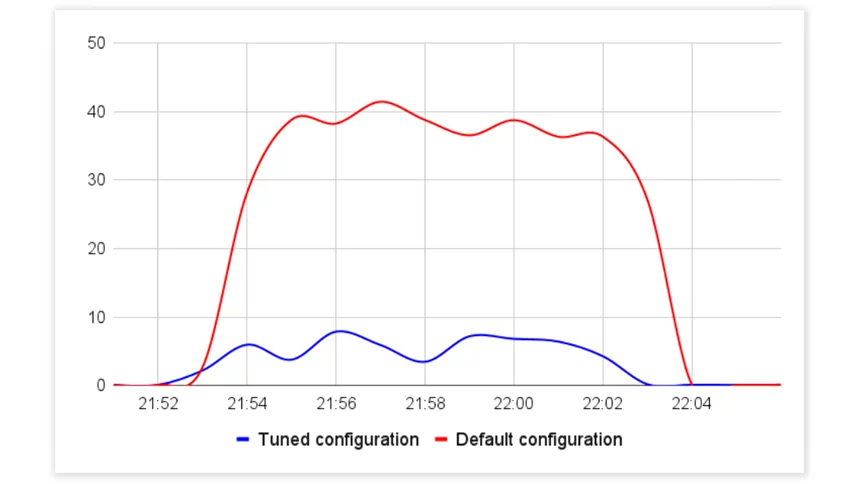 CPU Utilization (%), Aimeos Tuned MySQL Configuration vs Default
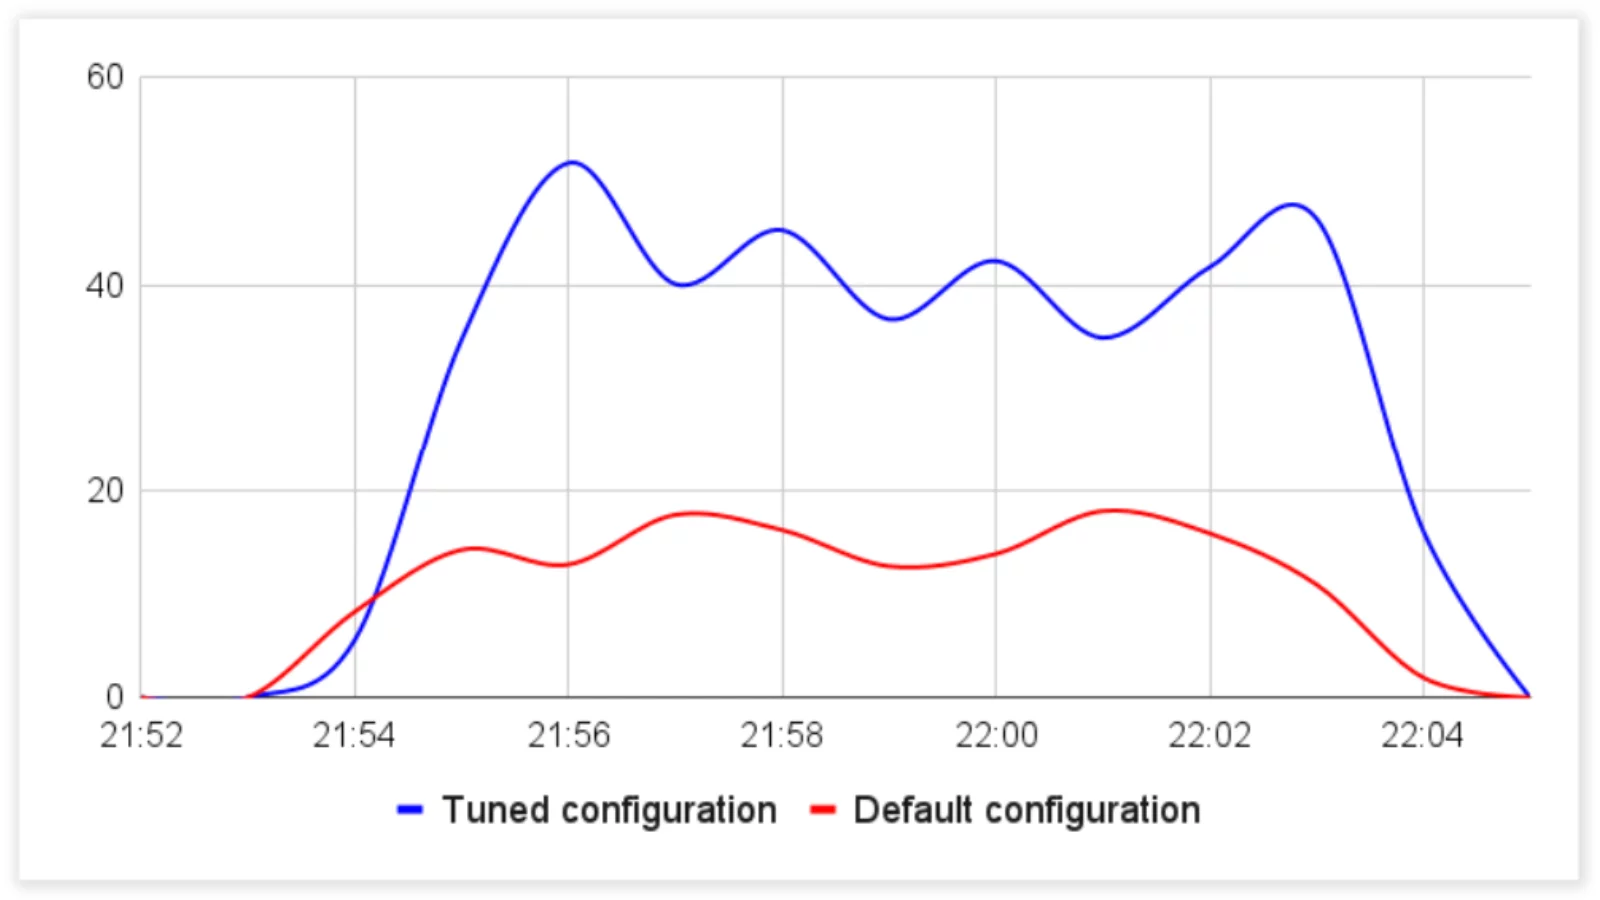 Queries Per Seconds, Aimeos Tuned MySQL Configuration vs Default
 When looking for ways to get free AWS credits to be used on AWS services such as LLM training for your