https://media.notthebee.com/articles/62b069c7ef4fd62b069c7ef4fe.jpg
This might be the most epic bike flip we have ever seen.
Not the Bee
Just another WordPress site
https://media.notthebee.com/articles/62b069c7ef4fd62b069c7ef4fe.jpg
This might be the most epic bike flip we have ever seen.
Not the Bee
https://media.notthebee.com/articles/62b222209632c62b222209632d.jpg
This isn’t the sort of skill you can get by bullying, bargaining, or Beggin Strippin’. This takes a whole lot of talent from the dog and a whole lot of work from the trainer.
Not the Bee
https://i.kinja-img.com/gawker-media/image/upload/c_fill,f_auto,fl_progressive,g_center,h_675,pg_1,q_80,w_1200/43bf24a8f271d61ea799d7b3e2372f01.jpg
IGN has revealed a series of photos from the new Lord of the Rings: The Rings of Power, this time showing off the “new and unimproved” Orcs of this age. And for once, worse is actually better here.
In an interview with Jamie Wilson, head of the prosthetics department on The Rings of Power, and Lindsey Weber, an executive producer for the series, we get more details on how the forces of evil will operate in this period of Tolkien’s vast fantasy saga. “We spent a lot of time talking about what it would mean to be an Orc in the Second Age. It felt appropriate that their look would be different, part of a wilder, more raw, Second Age, Middle-earth, closer to where the First Age ends.” Weber said, describing the more desiccated, haunted look of the orcs that we see in the preview images that IGN has been given. “As we meet them, they’re not yet organized into armies, they’re a little more scattered and they’ve been scavenging. So it’s just a different time in their total story.”
Wilson is what’s known as a “Sevener” on set. This means that he’s worked on all the filmed Lord of the Rings productions: the original Peter Jackson trilogy, the Hobbit trilogy, and now The Rings of Power. He’s been around these specific prosthetics and makeup for decades, and has spent a lot of time thinking about how orcs look on screen… and how to make them look that way.
“Time has changed a lot,” Wilson told IGN. “You go back 20 years and we used a basically foam latex, which is like a porous-y kind of rubbery, spongy material with a smooth or whatever textured surface. It was great at the time.”
He mentions that silicon was only in use during the original trilogy towards the end, when they were able to make some pieces for John Rhys-Davies as Gimli. Times, he said, have changed dramatically. “All the ears, noses, Orcs pieces are all made in encapsulated silicon, which is basically two layers of silicon with a moveable piece of silicon in the middle, so when it’s applied to the actor’s face, they can move and it works,” he explained. “It also gets the same temperature as their skin. And you can see the translucency and then you gently paint on the top of it, a bit like doing makeup on a human rather than having to seal and heavily paint like we did in the old days.”
Both Wilson and Weber also noted that while the prosthetics and practical makeup are incredibly advanced, there is still a lot of CGI in Rings of Power. The show, Weber explains, is simply not reliant on it to make the orcs look good—a lot of the digital enhancements will occur in larger ensemble shots. Close up, you’ll get to see the orcs in all their garish, practically-designed glory.
Lord of the Rings: The Rings of Power debuts September 2 on Prime Video.
Want more io9 news? Check out when to expect the latest Marvel and Star Wars releases, what’s next for the DC Universe on film and TV, and everything you need to know about House of the Dragon and Lord of the Rings: The Rings of Power.
Gizmodo
https://theawesomer.com/photos/2022/06/crashing_t.jpg

When you feel burnt out, it’s a good plan to take time for yourself. But taking a break sometimes causes everything to come crashing down. Maggie Mae Fish’s relatable short film about living with ADHD explores some of the feelings you might experience when you emerge from your everyday distractions. (Thanks, Rob!)
The Awesomer
https://theawesomer.com/photos/2022/06/inkas_toyota_land_cruiser_armor_test_t.jpg
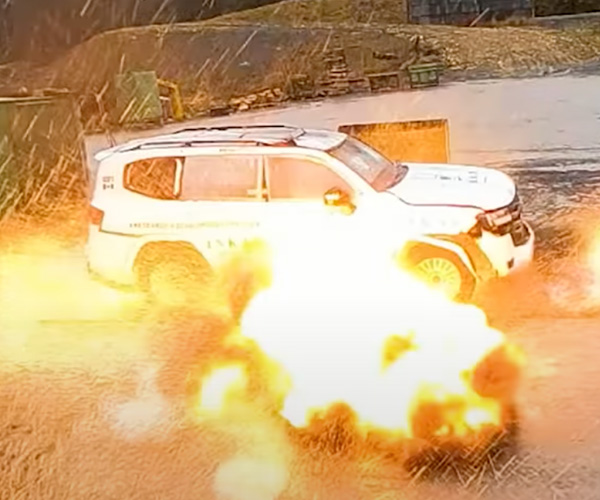
Toyota vehicles are known for their durability and reliability. But even a Land Cruiser can’t stand up to explosions without the help of some armor. Vehicle security company Inkas shows how their armor systems can help protect occupants of the SUV by hitting it with ammunition, grenades, land mines, and dynamite.
The Awesomer
The following is a short HOWTO about deployment and use of Benchmark-kit (BMK-kit). The main idea of this kit is to simplify your life in running various MySQL benchmark workloads with less blood and minimal potential errors.
Generally as simple as the following :
$ bash /BMK/sb_exec/sb11-Prepare_50M_8tab-InnoDB.sh 32   # prepare data

$ for users in 1 2 4 8 16 32 64 128 256 512 1024
do
  # run OLTP_RW for 5min each load level..
  bash /BMK/sb_exec/sb11-OLTP_RW_50M_8tab-uniform-ps-trx.sh $users 300
  sleep 15
done
Read more… (35 min remaining to read)
Planet MySQL
https://media.notthebee.com/articles/62b073b315a0162b073b315a02.jpg
This viral video out of Phoenix quickly got people talking about lawful self-defense over the weekend, and since the politicians are pushing super hard to disarm us all, I’m glad to see it.
Not the Bee
https://media.notthebee.com/articles/62b0b6382c0a662b0b6382c0a7.jpg
Have you ever wanted an A.I. to draw random images that will both amaze and frighten you beyond your wildest dreams?
Not the Bee
https://www.buckeyefirearms.org/sites/buckeyefirearms.org/files/styles/slideshow/public/field/image/ccwhandbook.jpg?itok=Dk6I3RZZ

As of Monday, June 13, 2022, it is legal for "qualifying adults" to carry a concealed handgun in Ohio without a license.
Attorney General Dave Yost has issued an updated manual summarizing Ohio’s concealed carry laws and explaining the two ways you may now carry in the state, with or without a license.
Click here to view or download the manual as a PDF.
Whether you plan to carry with a license or without one, I highly recommend you read this manual, which covers a number of important topics, including:
In addition to reading this manual, I urge you to take a concealed carry class from an experienced and competent instructor, even if you do not plan to apply for a license. It is vital that you are familiar with Ohio self-defense law to help you make better decisions and act legally.
You can search for classes on OhioGunClass.org, a website we host for instructors in Ohio.
Dean Rieck is Executive Director of Buckeye Firearms Association, a former competitive shooter, NRA Patron Member, #1 NRA Recruiter for 2013, business owner and partner with Second Call Defense.
Buckeye Firearms Association
https://theawesomer.com/photos/2022/06/see_through_jet_engine_t.jpg
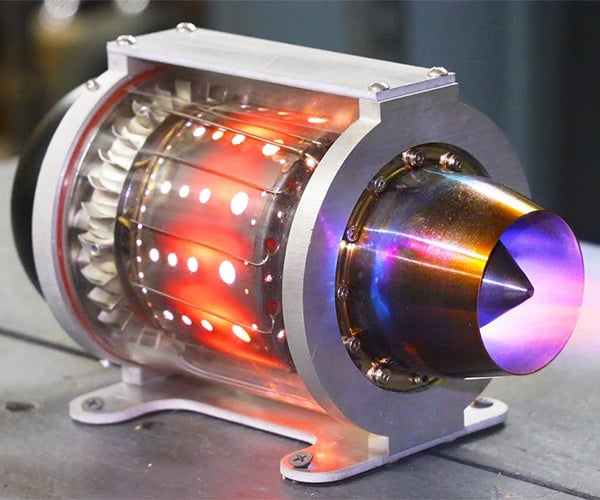
Warped Perception has made several project vehicles that incorporate small turbojet engines. For this video, he built a custom transparent housing for one of the jets so we can see exactly how it works to create thrust. Along the way, he offers a great layperson’s explanation of jet propulsion systems.
The Awesomer