When it comes to deploying web applications on the cloud, AWS Elastic Beanstalk is one of the most popular choices. It is a platform-as-a-service (PaaS) from Amazon that makes deploying web applications much easier. In this article, I’ll explain the entire step-by-step process of deploying a Laravel application on AWS Elastic Beanstalk using a practical example.
This article assumes that you have some familiarity with Amazon Web Services and know about the most common ones, such as Amazon EC2, Amazon RDS, and Amazon ElastiCache. Simply knowing what these services are used for will suffice. The article also assumes you’ve worked with common Laravel features, such as Queues, Cache, and Mail.
Table of Contents
Project Code
This article comes with a reference Laravel project. It is a simple question board application where users can post questions and ask for answers.
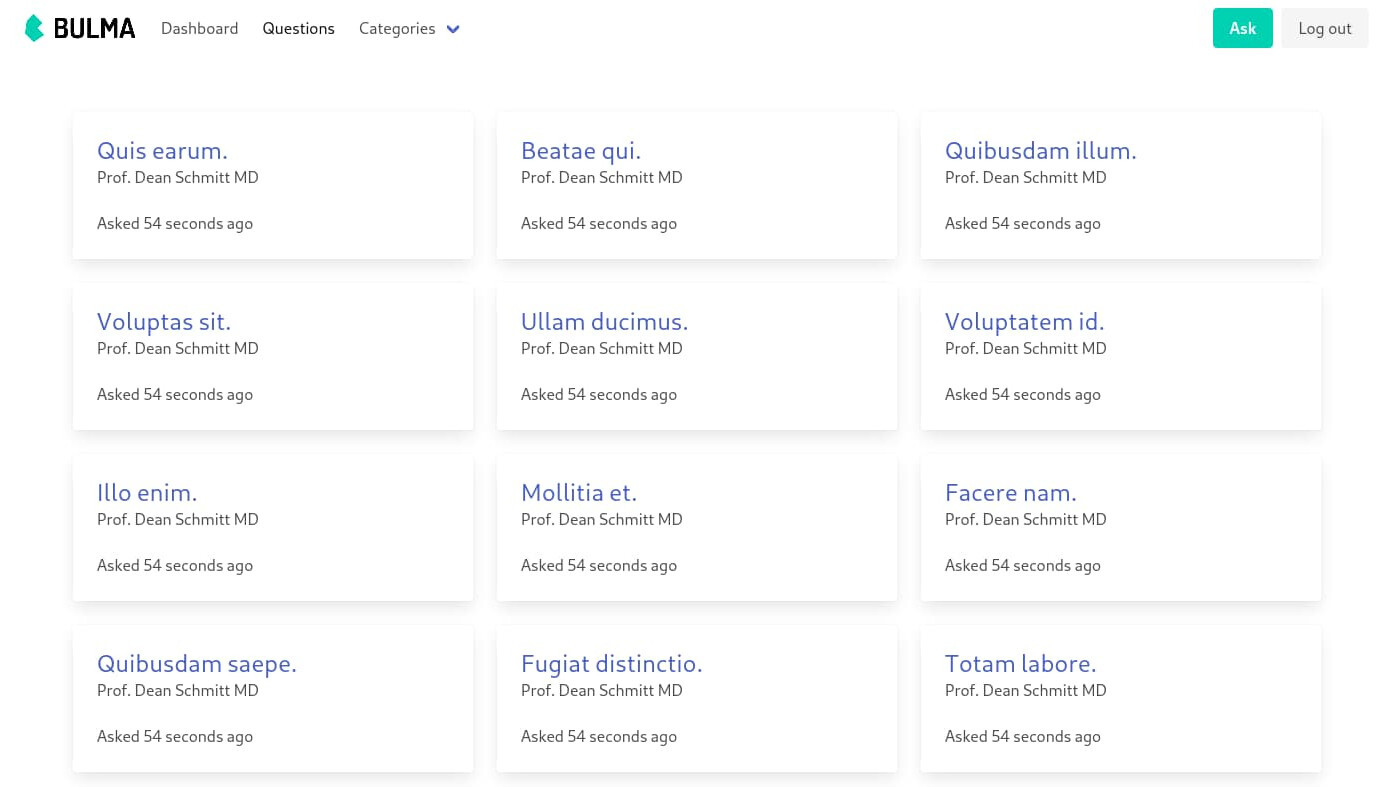
It’s like a dumbed-down version of StackOverflow but good enough for this article. The project can be found in the fhsinchy/guide-to-deploying-laravel-on-elastic-beanstalk repository. Make a fork of the repository and clone it to your local system. There are two branches: master and completed. You’ll work on the master branch throughout this article.
Instructions for running the project on your local system can be found in the repository’s README file.
Getting Started With AWS Elastic Beanstalk
According to the AWS Elastic Beanstalk overview page,
AWS Elastic Beanstalk is an easy-to-use service for deploying and scaling web applications and services developed with Java, .NET, PHP, Node.js, Python, Ruby, Go, and Docker on familiar servers such as Apache, Nginx, Passenger, and IIS.
It’s an orchestration service that controls how various resources running on Amazon’s servers work together to power your application. I’m assuming that you already have an AWS account set up, but if you don’t have a free account already, follow the instructions shown here to create one.
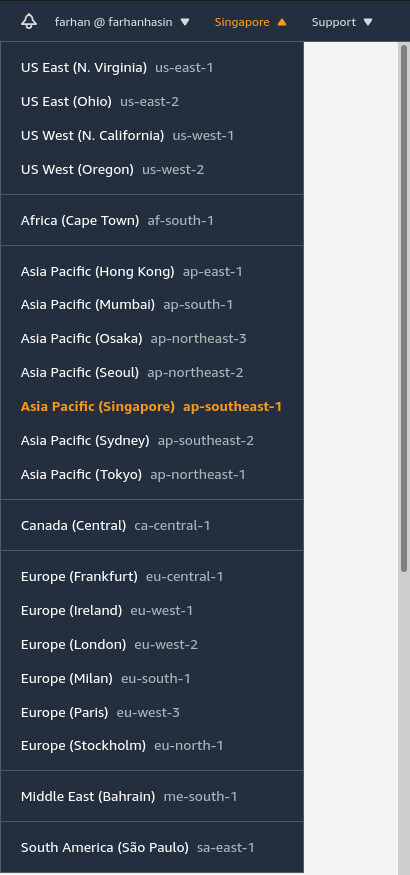
Log into your AWS account, and the first thing to do after logging in is ensure that you’re in the right region. You can find the list of regions on the top-right corner of the navigation bar. The correct region is the one closest to your application users. I live in Bangladesh and most of my users are from here, so I use Asia Pacific (Singapore) as my default region.
Once you’ve changed the region, you’re ready to create your first application on AWS Elastic Beanstalk.

Creating a New Application
Start by clicking the Services drop-down button on the top-left corner of the navigation bar and selecting Elastic Beanstalk from the menu. It should be listed under the Compute category.
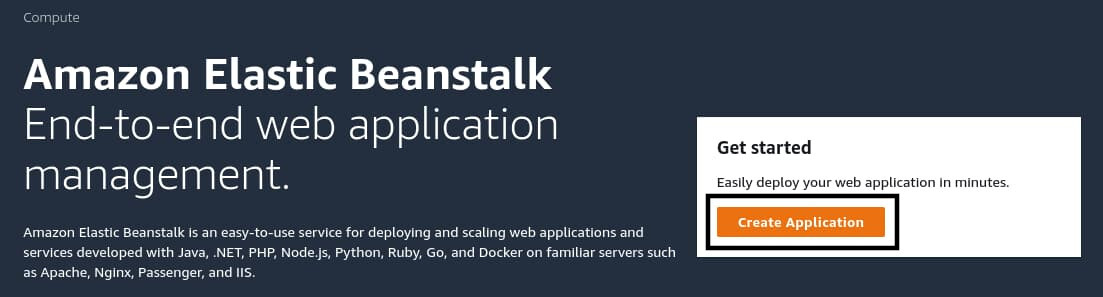
If you do not have any previously created applications on AWS Elastic Beanstalk, you should land directly on the welcome page. Click the Create Application button on the right side to open up the application creation wizard.
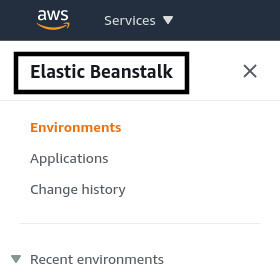
If you have previously created applications, however, you’ll land on the All environments page by default. To visit the welcome page, click on the bold Elastic Beanstalk link on the top of navigation pane on the left side of the page.
You can also land on the application creation wizard directly by following this link – https://console.aws.amazon.com/elasticbeanstalk/home#/gettingStarted
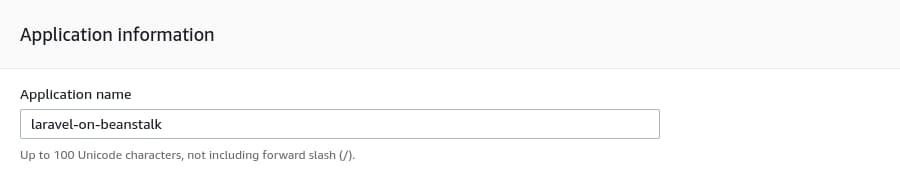
The Application name can be anything you want, but to be absolutely in line with this article, put laravel-on-beanstalk as the application name.
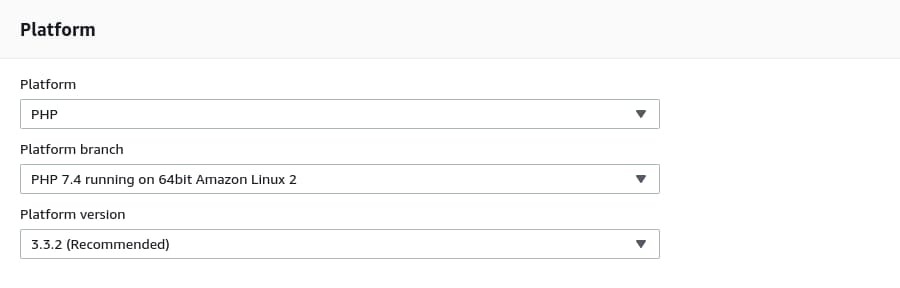
Leave the Application tags empty for now. On the Platform section, select PHP as the Platform and PHP 7.4 running on 64bit Amazon Linux 2 as the Platform Branch because the reference project doesn’t work with PHP8. Finally, for the Platform version, select whatever is the latest.
Select Sample code under the Application code section and click on the Create application button. The application creation process takes a while. Once it’s finished, you should land on a page that looks as follows:
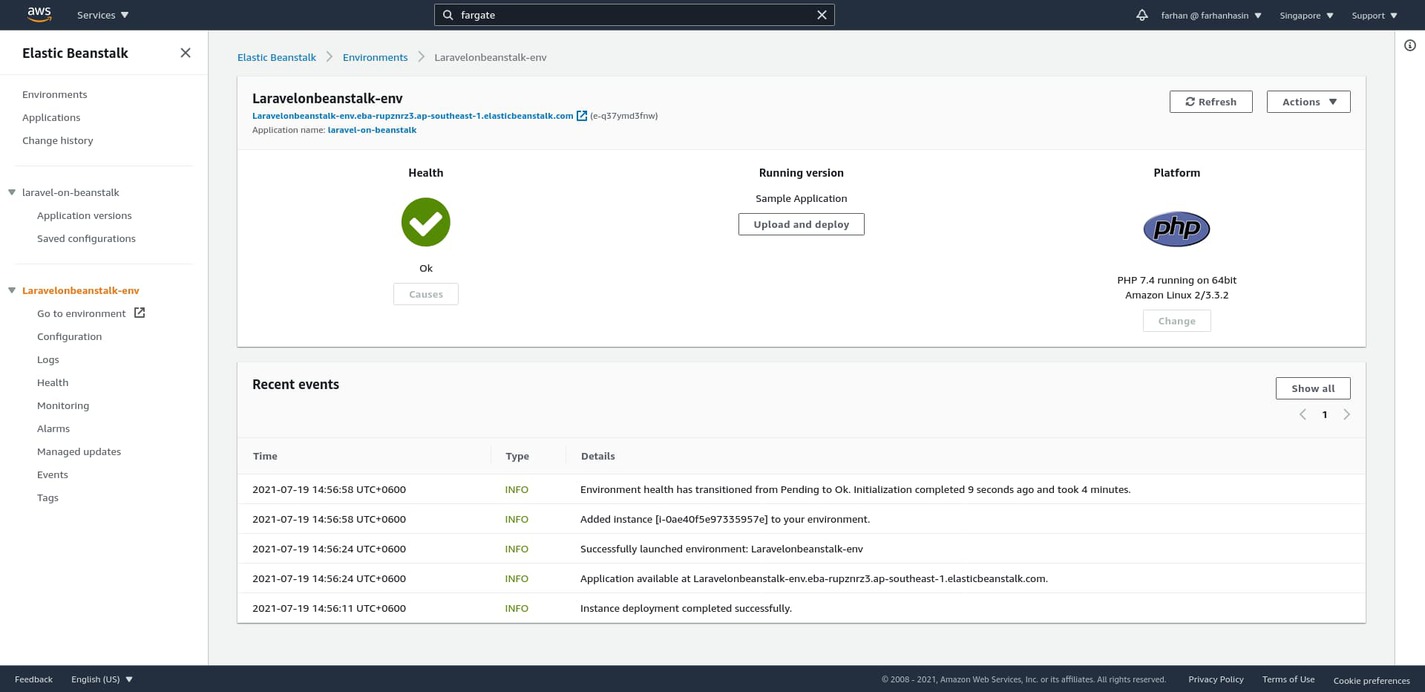
This is the environment dashboard. Whenever you create a new application on AWS Elastic Beanstalk, it automatically creates a new environment with a similar name. An application can have multiple environments, but an environment can only be attached to one application. In the context of AWS EB, an environment is a collection of AWS resources. By default, every environment comes with the following resources:
- Amazon EC2 Instance (for running your application)
- Amazon EC2 Security Group (controls traffic flow from and to the instance)
- Amazon S3 Bucket (holds your uploaded source code archives)
- Domain Name (makes your application easily accessible)
- Amazon CloudWatch Alarms (notifies you if resource usage exceeds a certain threshold)
- AWS CloudFormation Stack (binds all these resources into a single unit for easier management)
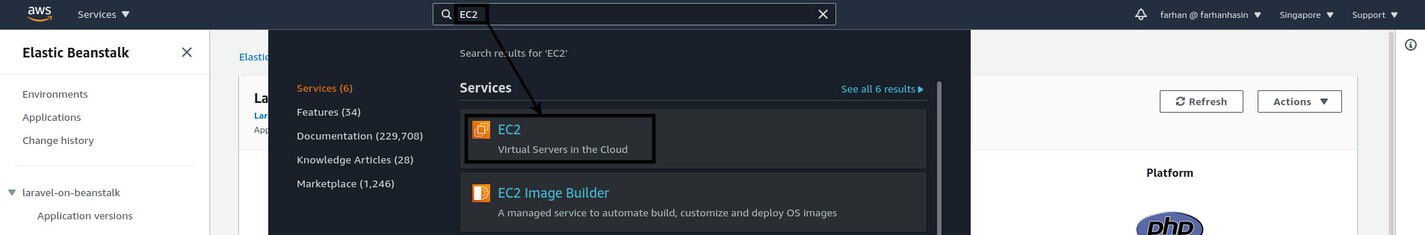
You can even see the Amazon EC2 instance associated with this environment. To do so, click on the Services dropdown once again and select EC2. It’ll be listed under the Compute category. You can also use the search function on the navigation bar to quickly look for services. Just click on the search bar at the top or press the key combination Alt + S to activate it. Search for EC2, and it should show up as the first one on the list.
On the EC2 management console, click on Instances from the Resources section or the navigation pane on the left side of the page.
As you can see, AWS Elastic Beanstalk (we’ll call it AWS EB from now on) has created a new EC2 instance with the same name as the environment. Your application will actually run inside this virtual machine. AWS EB will just manage this instance as necessary. When you deploy on AWS EB, you do not pay for AWS EB itself. You pay for all these resources orchestrated by AWS EB to power your application. It’s an orchestration service.
Apart from the concept of an environment, AWS EB also has the concept of an Application. In the context of AWS EB, an application is the combination of the environments attached to it, a copy of your application source code, and several parameters commonly known as the environment configuration.
Consider that you have two different environment for your application. One is the master or production environment, and the other is the staging environment. The master environment is the one your users connect to, and the staging one is for testing. AWS EB makes it very easy to create such arrangements with multiple environments.
Don’t worry if you do not clearly understand these concepts. Everything will become much clearer as you keep going and start to work with the reference project.
Creating a New Environment
The default environment that came with the new application is okay, but I don’t like how it’s named. I usually name my environments following the <application name>-<source code branch> syntax. So, for an application named laravel-on-beanstalk, the environment will be laravel-on-beanstalk-master or lob-master for short.
I also don’t like the fact that it comes with Elastic Load Balancing (ELB) enabled by default. ELB is very useful when you’re running multiple instances of your application. However, for most of the small to medium-scale Laravel projects, a single instance should be enough in the beginning. Once you start getting a lot of users, you can add load balancing to your application by creating a new environment.
To create a new environment, navigate to the list of environments by clicking on Environments from the left sidebar. Start the environment creation wizard by clicking on the Create a new environment button on the top-right corner. You’ll create a Web server environment, so choose that and click Select.
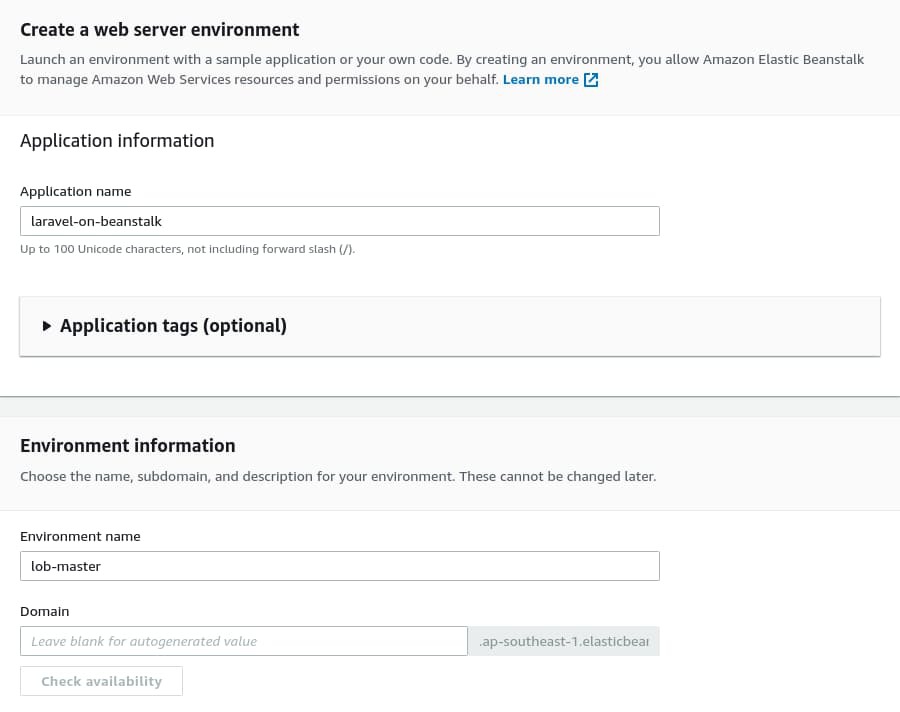
The next step should look familiar to you. In the Application name input box, make sure to type the application name exactly as you did in the application creation step, which was laravel-on-beanstalk. If you write a different name, then AWS EB will create a new application instead of attaching this environment to the previous one.
The Environment name under the Environment information section should be lob-master, which follows the naming convention I taught you a few paragraphs above. I’ll leave the domain name field blank here and let AWS EB decide for me.
Under the Platform section, select PHP 7.4 like you did previously. Then, select Sample application under the Application code section and click the Configure more options button.

For the next step, select Single instance (Free Tier eligible) under the Presets section and click on the Create environment button. Environment creation will take some time. Once it’s done, navigate to the application list by clicking on the Applications link from the navigation pane on the left side of the page.
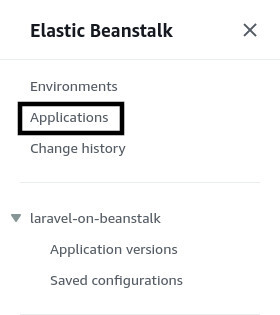
On the All applications page, you should see both the old and new environment listed beside the application name.

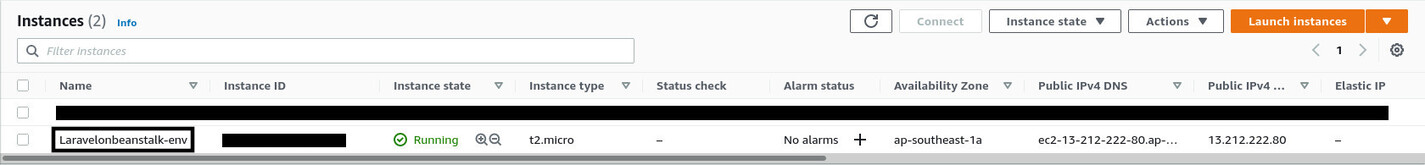
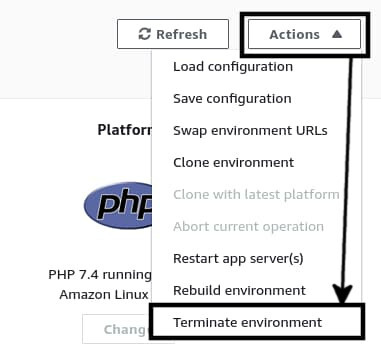
To get rid of the old environment, navigate to the environment dashboard by clicking on the Laravelonbeanstalk-env name. On the dashboard, click on the Actions drop-down button on the top-right corner and select Terminate environment.
A confirmation modal will show up. Write the environment name on the input box and click on the Terminate button. Terminating an environment will remove all the associated resources with it. So, if you go back to Amazon EC2 management console, you’ll see that the Laravelonbeanstalk-dev instance has been terminated and a new instance named lob-master has shown up. From now on, you’ll work with the newly created lob-master environment.
Deploying an Application Version
Make sure you’ve cloned the project that comes with this article and that you’re on the master branch. To upload your application source code to AWS EB, you’ll have to put it in a zip archive. To do so, make sure your terminal is opened inside the project directory and execute the git archive -v -o deploy.zip --format=zip HEAD command. This command will create a new deploy.zip archive on your project directory with all the committed files from your currently active branch.
To upload this file to AWS EB, go back to the lob-master environment dashboard and click on the Upload and Deploy button.
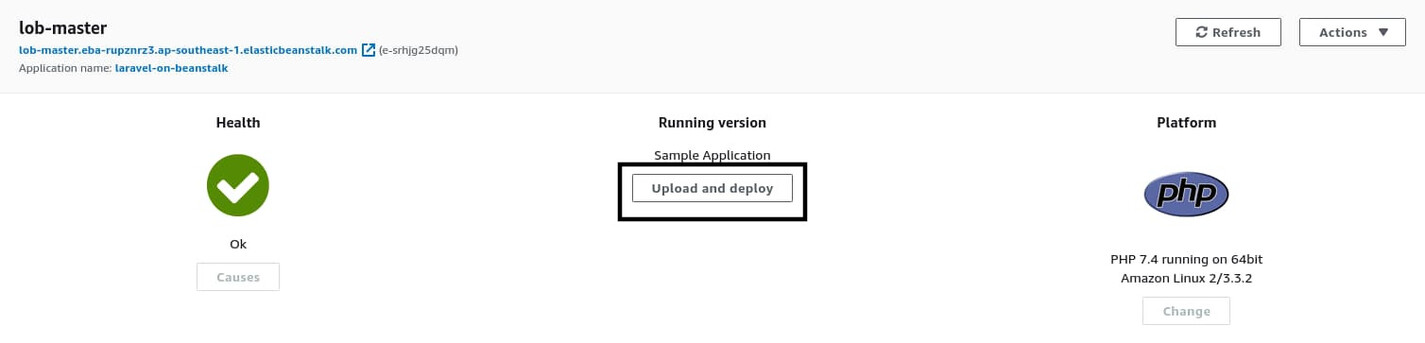
On the next step, click on the Choose button and use the file browser to select your deploy.zip archive. Put something like v0.1 in the Version label field and hit Deploy.

The deployment process will take a few minutes. During the process, the health status will transition from Ok to Info. If the deployment process succeeds, the health status will go back to Ok, and if the process fails, it’ll transition to Degraded. A definitive list of all the statuses can be found in the official docs.
Once the deployment process has finished, you will see the status transition back to Ok. You will also see the Application version change from Sample Application to v0.1. If it doesn’t, perform a page refresh.
Now if you try to visit the application using the environment domain name, you’ll be presented with a 403 Forbidden error message from NGINX. The status should transition to Severe at this point, indicating the application is failing to respond.
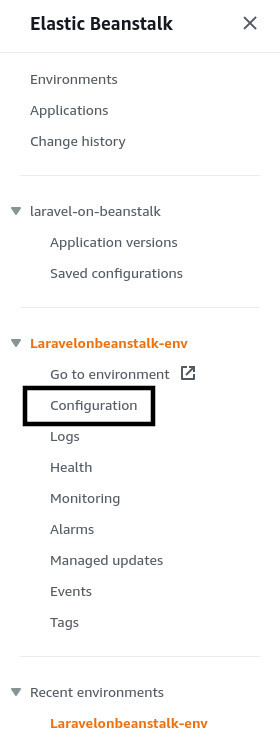
This happens because NGINX on AWS EB is configured to use the /var/app/current directory as its document_root by default, but in case of a Laravel application, it has to be the /var/app/current/public directory. To solve this issue, click on Configuration from the navigation pane on the left side of the page.
You’ll land on the environment configuration page. Edit the Software configuration, and under the Container Options section, put /public as the Document root.
Scroll down to the bottom until you see the Environment properties section. Here, you can define various environment variables that you usually define inside a Laravel project’s .env file.
Every Laravel application requires an application key to run. So, create a new property named APP_KEY and put a 32-character-long random string as the Value. You can use the CodeIgniter Encryption Keys from RandomKeygen website.
Apart from this application key, the question board application is configured to send a confirmation email to new users. If you try to register a new account without configuring a proper mail server, the application will crash. For the sake of simplicity, I’ll use MailTrap in this article. Navigate to https://mailtrap.io/ and create a free account. From the default inbox, note down the following configuration parameters:
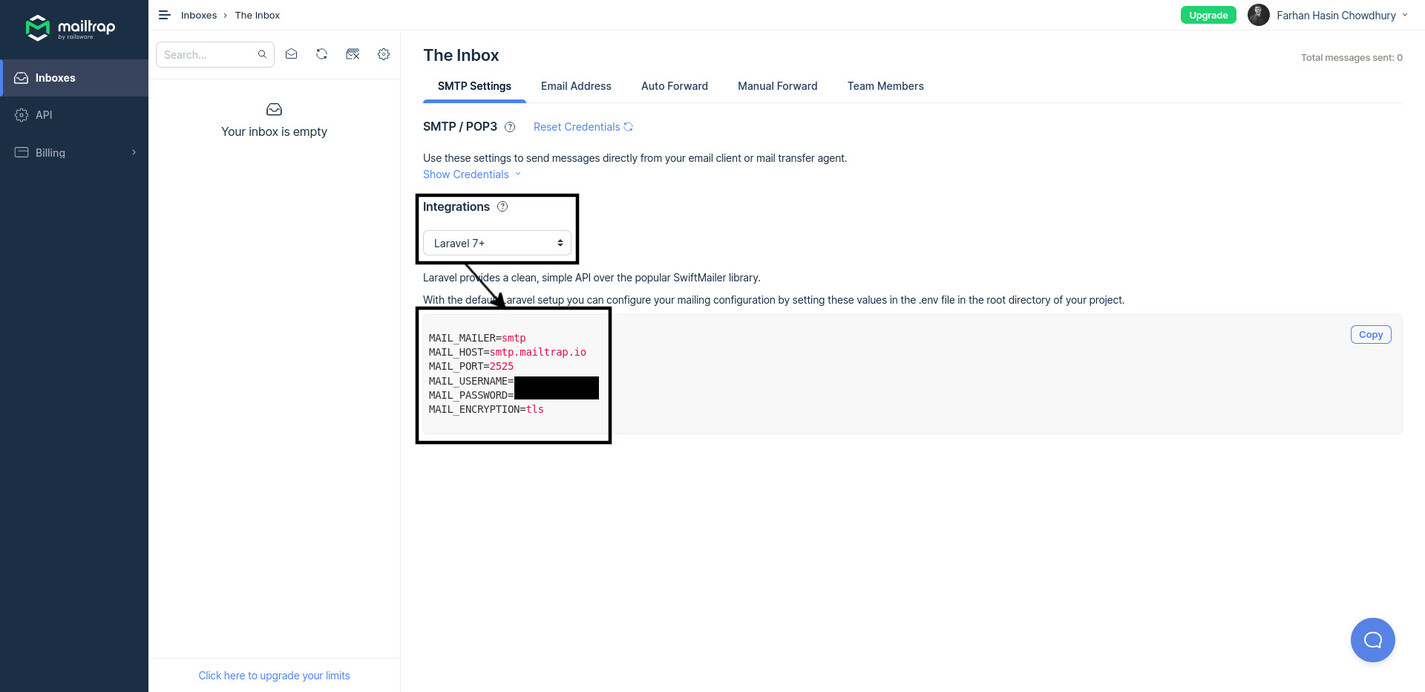
Now create individual environment parameters on AWS using the names and values noted from your MailTrap inbox.
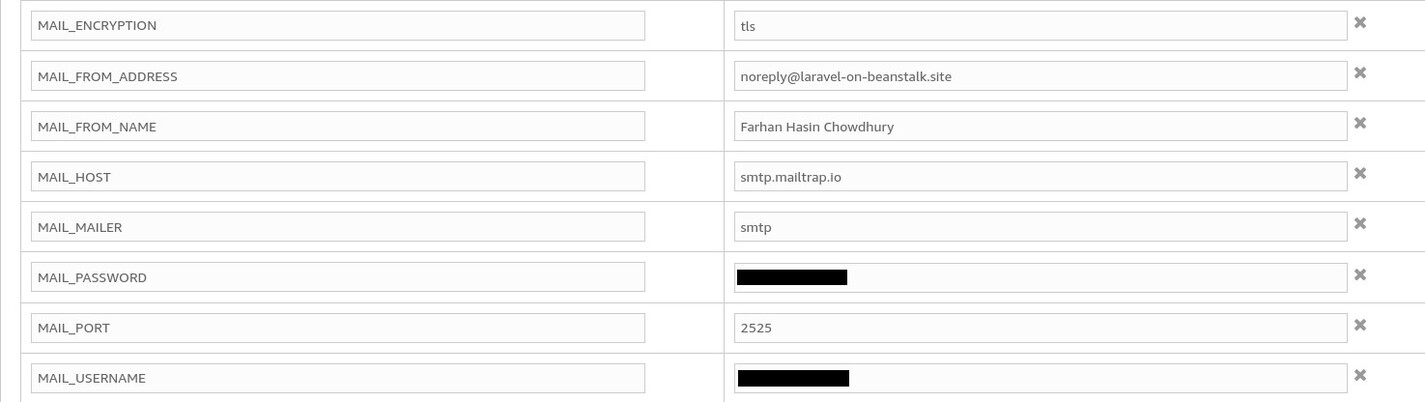
Now all the emails sent from your application will end up in the MailTrap inbox. Finally, click on the Apply button and wait until the environment update process is finished.
Once the environment has been updated, try visiting the application once again; this time, you should be welcomed by the question board application itself.
However, the trouble doesn’t end there. If you try to navigate to some other page, such as /login, you’ll see a big 404 Not Found error from NGINX. This problem also has to do with the NGINX configuration, but sadly, it can not be fixed from the AWS EB management console. To solve this problem, you’ll have to extend the AWS EB platform by adding some additional code as a part of your application source code.
One of the biggest advantages of AWS EB is that it strikes a nice balance between accessibility and flexibility. By default, AWS EB platforms are intelligent enough to install all the necessary dependencies for your project and try to run it with the default settings. However, for a Laravel project, there are additional post-deployment steps, such as running database migrations, seeding the database (if needed), and setting proper directory permissions. To do all these, you’ll have to extend the AWS EB platform.
AWS EB allows you to extend the default platform in four ways:
- Buildfile and Procfile (allows you to build your application before deployment)
- Platform hooks (custom scripts or executable files that AWS EB executes during various stages of deployment)
- Configuration files (allows you to configure various aspects of the environment such as the
document_root and lets you execute simple commands such as php artisan migrate)
- Reverse proxy configuration (allows you to include custom configuration for NGINX or Apache web server)
In this article you’ll learn about the last three. Let’s begin with reverse proxy configuration. Create a directory .platform/nginx/conf.d/elasticbeanstalk on the root of the project directory. In this new directory, create a new file called .platform/nginx/conf.d/elasticbeanstalk/laravel.conf or anything else that you like with following content:
add_header X-Frame-Options "SAMEORIGIN";
add_header X-Content-Type-Options "nosniff";

index index.php;

charset utf-8;

location / {
    try_files $uri $uri/ /index.php?$query_string;
}

location = /favicon.ico { access_log off; log_not_found off; }
location = /robots.txt  { access_log off; log_not_found off; }

error_page 404 /index.php;

location ~ /\.(?!well-known).* {
    deny all;
}
During deployment, AWS EB will copy all the content of the .platform/nginx directory to the /etc/nginx directory of the EC2 instance. This custom config file will end up in the /etc/nginx/conf.d/elasticbeanstalk directory, and NGINX will automatically include this in the server context.
Now that you have a custom reverse proxy configuration in place, let me introduce you to the configuration files. Create another directory called .ebextensions on the root of your project directory, and inside that directory, create a new file called deploy.config or whatever you like with the following content:
option_settings:
    -
        namespace: aws:elasticbeanstalk:application:environment
        option_name: COMPOSER_HOME
        value: /root

    -
        namespace: aws:elasticbeanstalk:container:php:phpini
        option_name: document_root
        value: /public
    -
        namespace: aws:elasticbeanstalk:container:php:phpini
        option_name: memory_limit
        value: 256M

container_commands:
    00_install_composer_dependencies:
        command: "sudo php -d memory_limit=-1 /usr/bin/composer.phar install --no-dev --no-interaction --prefer-dist --optimize-autoloader"
        cwd: "/var/app/staging"
Although the file ends with a .config extension, it is a YAML file. You can use the option_settings section to configure the software environment. The first entry in this section defines a new environment variable named COMPOSER_HOME with the value of /root. This sets /root as the composer’s home directory. The second entry configures the document_root to be /public by default, eliminating the necessity of setting it manually in the AWS EB console. The third entry sets the memory limit for the PHP process. It’s not strictly necessary, but I’ve added this for demonstration purposes.
Under the container_commands section, you can define shell commands that will execute during application deployment. The 00_install_composer_dependencies command removes all the dependencies installed by AWS EB by default, except the ones required for production. Commands defined in this section are executed in alphabetic order. Appending 00 in front of this command will cause it to execute first. The next command will begin with 01, followed by 02, etc.
When you deploy a new version of your application, AWS EB extracts the source code inside the /var/app/staging directory and then goes through several stages to make the application ready for production. This is why any command you run during deployment has to be run considering /var/app/staging as the current working directory.
Once all the deployment stages have completed, AWS EB puts the application inside the /var/app/current directory. Every time you perform a deployment, all the content of the /var/app/current directory will be lost. This is one of the reasons to never use the default storage disk when deploying on AWS EB. Make sure you always use a S3 bucket to upload files. Otherwise, you’ll lose all the data upon new deployments. The use of Amazon S3 as file storage is well documented in the official Laravel docs.
Apart from the custom NGINX configuration and the environment changes, Laravel also requires the storage and bootstrap/cache directories to be writable on the server. You can make these directories writable using AWS EB platform hooks. According to the official AWS EB docs,
These are custom scripts and other executable files that you deploy as part of your application’s source code, and Elastic Beanstalk runs during various instance provisioning stages.
There are three kinds of hooks:
prebuild – These files run after the AWS EB platform engine downloads and extracts the application source code, before it sets up and configures the application and web server.predeploy – These files run after the AWS EB platform engine sets up and configures the application and web server, before it deploys them to their final runtime location. The predeploy files run after running commands found in the container_commands section of any configuration file.postdeploy – These files run after the AWS EB platform engine deploys the application and proxy server. This is the last deployment workflow step.
In this article, you’ll work with prebuild and postdeploy hooks. Go back to the application source code. Create a new directory called .platform/hooks/postdeploy. This directory will contain the scripts to be executed after the application has been deployed. Create a new post deploy script .platform/hooks/postdeploy/make_directories_writable.sh and put following content in it:
#!/bin/sh

# Laravel requires some directories to be writable.

sudo chmod -R 777 storage/
sudo chmod -R 777 bootstrap/cache/
The first two lines make the aforementioned directories writable by setting their permissions to 777, which means giving read, write, and execute permission to the owner, group, and public. This is enough, but since you’re already at it, create one more file .platform/hooks/postdeploy/optimize_laravel.sh and put the following content in it:
#!/bin/bash

# Optimizing configuration loading, route loading and view loading
# https://laravel.com/docs/8.x/deployment#optimization

php artisan config:cache

php artisan route:cache

php artisan view:cache
These three artisan commands will cache Laravel configs, routes, and views, making your application a tad bit faster. Before you commit these files, make sure they all have executable permission. To do so, execute the chmod +x .platform/hooks/prebuild/*.sh && chmod +x .platform/hooks/postdeploy/*.sh command on the root of your project directory.
Now zip up the updated source code by executing the git archive -v -o deploy.zip --format=zip HEAD command. Before you zip up the updated source code, make sure you’ve committed all the changes. If you don’t, the git archive command will not pick up the updated code. Redeploy on AWS EB like you did before. Use a different version label, such as v0.2, this time. Wait until the new version has been deployed, and then you should be able to navigate to other pages.
Setting-Up a Database on Amazon RDS
Now that you’ve successfully configured NGINX to play well with your project, it’s time to set-up a database. In this section, you’ll learn about setting up resources manually in other AWS services, troubleshooting deployment issues, and creating custom security groups.
There are two ways to set up a database on AWS EB. You can either go into the environment configuration page and set up an integrated database or create a database from the RDS management console separately. The integrated database is a good way to get started, but it ties the database with your environment lifecycle. If you delete the environment at some point in the future, the database will go down with it.
In this article, I’ll show you the second way. If you want to learn more about using an integrated database, it’s already well documented in the official AWS EB docs with an example Laravel project.
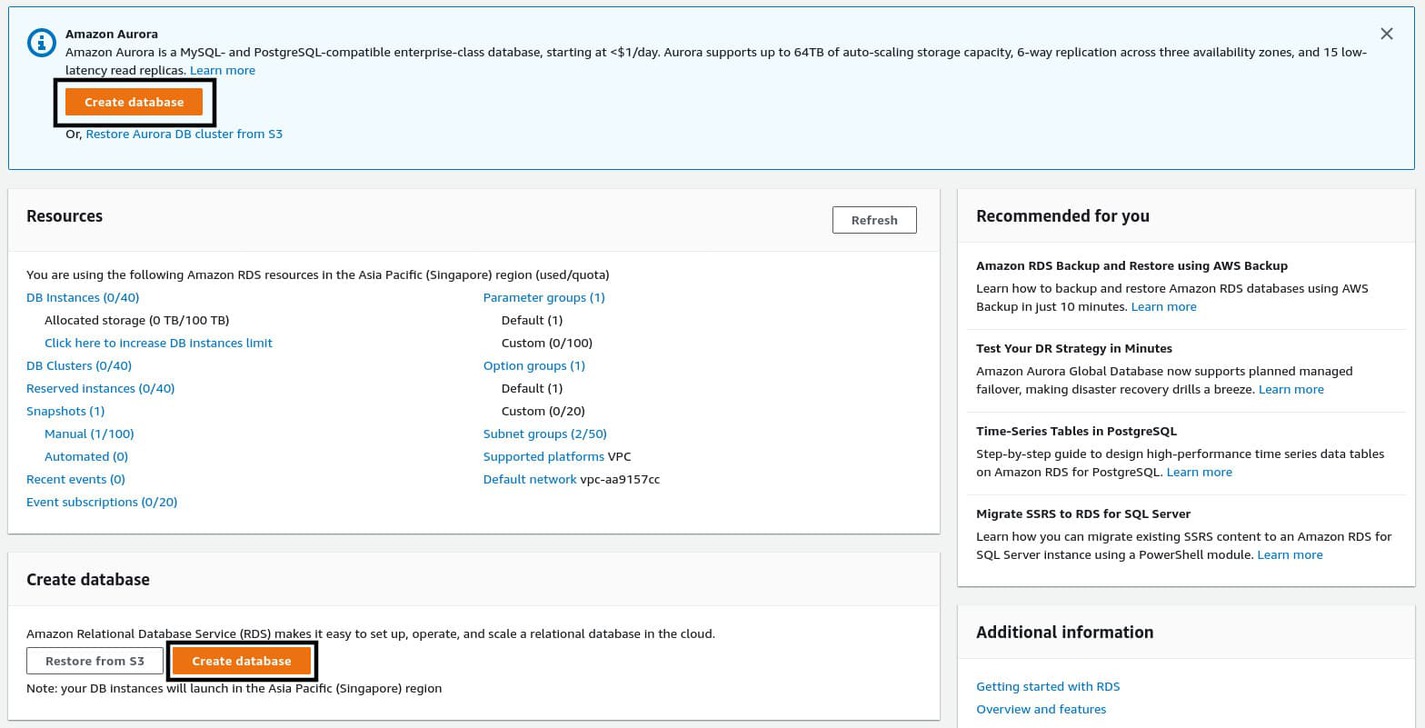
To create a new database, open the list of services once again and choose RDS. It should be listed under the Database section. Alternatively, you can use the search bar. RDS stands for Relational Database Service, and it lets you run relational database servers (e.g., MySQL and PostgreSQL) managed by AWS. Once you land on the RDS management console, click the Create database button to start the database creation wizard.
On the wizard, select Standard create as the creation method. Select the database engine you would like to use. In this case, it’s MySQL. Leave the version as it is, and under the Templates section, select Free tier for now. Try out the other templates once you’re a bit more experienced with AWS.
Under the Settings section, put lob-master as the DB instance identifier, clearly referring to my AWS EB environment name. This is the name of this RDS instance. You can leave the username as admin. Set a secure password as the Master password and make note of it; you’ll need this soon.
Under the DB instance class section, keep it as db.t2.micro to stay within the limitations of the free tier. Under the Storage section, uncheck the Eatable storage autoscaling option. Autoscaling is useful when you have lots of users coming to your application. Leave the Availability & durability section as it is. Under the Connectivity section, if you enable Public access, the database will be accessible from anywhere in the world. Leave this as disabled for now, but I’ll show you how to control access using security groups very soon.
Leave the Database authentication section, but make sure Password authentication is the selected method. Expand the Additional configuration section. Write a name inside the Initial database name input box. This is the name of the database that you’ll read from and write to. I usually put ebdb, which means Elastic Beanstalk DB.
Do not get confused by DB instance identifier and Initial database name. DB instance identifier is the name of this RDS instance, and Initial database name is the name of the database that AWS RDS will create inside this server.
Uncheck Enable automated backup for now. Automated backups are a must-have for real-world production applications. For this one, you won’t need it. Leave the remaining options unchanged and hit the Create database button. You’ll see a blue creating database notification at the top of the page.
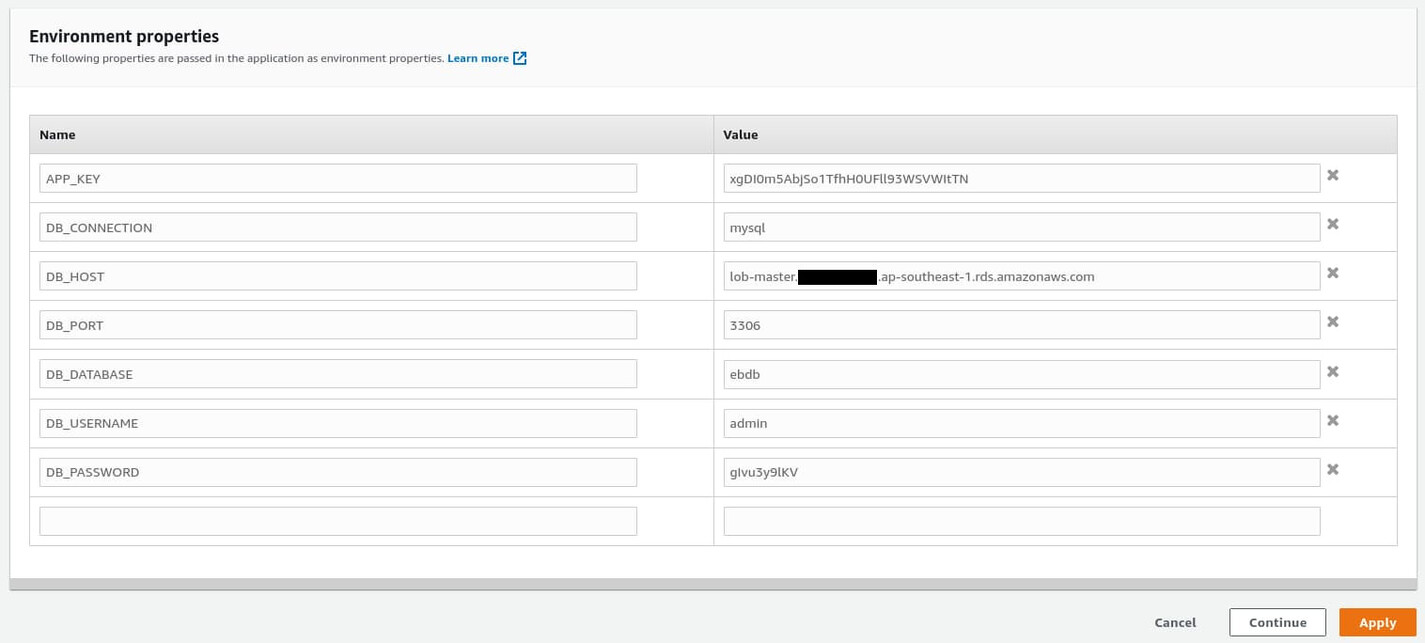
Creating a database can take up to 10 minutes. In the meantime, let’s go back to AWS EB and update the environment variables to enable database connection. From the lob-master environment dashboard, go to Configuration and edit the Software configuration. Scroll down to the Environment properties section and add the following environment variables:
- DB_CONNECTION – mysql
- DB_HOST – < endpoint from RDS >
- DB_PORT – 3306
- DB_DATABASE – ebdb
- DB_USERNAME – admin
- DB_PASSWORD – < master password from RDS >
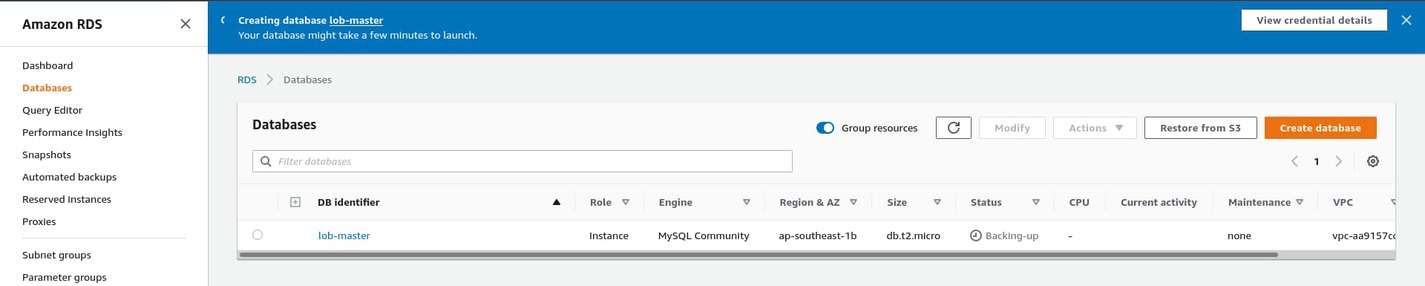
Use the master password you set during the database creation process as the value of the DB_PASSWORD property. You’ll have to fetch the value of the DB_HOST property from Amazon RDS. Go back to the Amazon RDS management console. If the database creation process is done, you’ll see the database instance status set as Available on the list of databases. Go to instance details by clicking on the lob-master name from the list.

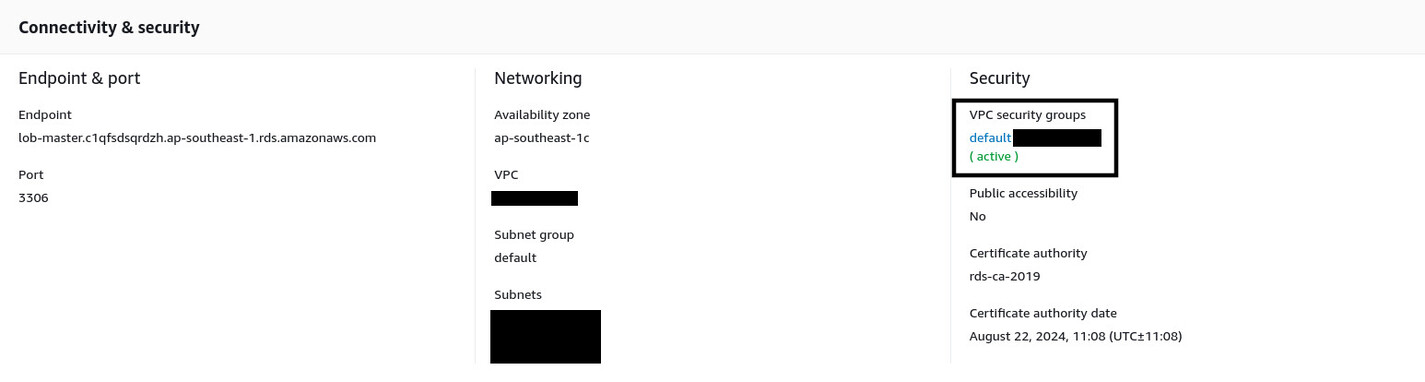
Under the Connectivity & port section, you’ll find the Endpoint. This is the value for the DB_HOST environment property. Copy the entire string and go back to AWS EB. Paste the copied string as the value of the DB_HOST environment property and hit the Apply button.
The environment will take a few minutes to update. Meanwhile, go back to the .ebextensions/deploy.config file on the root of your project directory and update its content as follows:
option_settings:
    -
        namespace: aws:elasticbeanstalk:application:environment
        option_name: COMPOSER_HOME
        value: /root

    -
        namespace: aws:elasticbeanstalk:container:php:phpini
        option_name: document_root
        value: /public

container_commands:
    00_install_composer_dependencies:
        command: "sudo php -d memory_limit=-1 /usr/bin/composer.phar install --no-dev --no-interaction --prefer-dist --optimize-autoloader"
        cwd: "/var/app/staging"

    02_run_migrations:
        command: "php artisan migrate --force"
        cwd: "/var/app/staging"
        leader_only: true

    03_run_admin_user_seeder:
        command: "php artisan db:seed --class=AdminUserSeeder --force"
        cwd: "/var/app/staging"
        leader_only: true

    04_run_categories_seeder:
        command: "php artisan db:seed --class=CategoriesSeeder --force"
        cwd: "/var/app/staging"
        leader_only: true
You’ve added three new container commands for running database migrations, as well as seeding the admin user and the default categories. Commit all the new changes and zip up the updated source code by executing git archive -v -o deploy.zip --format=zip HEAD command.
Redeploy the newly created code archive with a version label of v0.3 or something similar. After a few minutes, the deployment should fail, but it’s completely intentional. In the next subsection, you’ll learn about debugging deployment issues like this one.
Debugging Deployment Issues
Deployment failures are common, so learning how to troubleshoot is very important. Whenever one of your deployments fails, don’t panic. First, try to think of the changes you made to your code or environment that could cause this failure.
In this case, you’ve added three new container commands and some database-related environment properties. The environment properties shouldn’t cause any problem, at least they didn’t until you tried to deploy the updated code, so the issue is clearly in the code.
Also, have a look at the Recent events on the environment dashboard and try to find something that may indicate the cause of the problem.
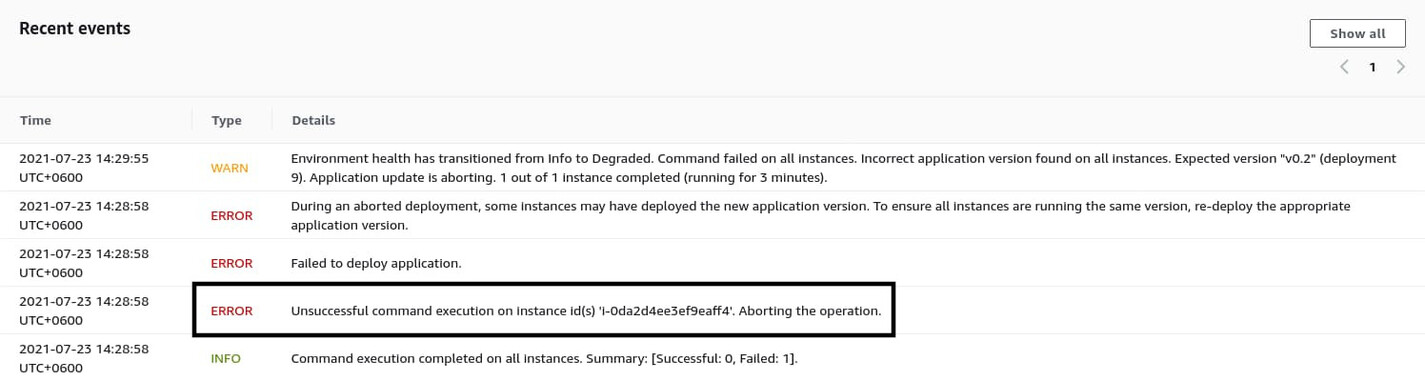
The fourth entry says Unsuccessful command execution …, which leads me to assume that one of the recently added container commands may have failed. However, you need to obtain more information. To do so, click on Logs from the navigation pane on the left side of the page. On the logs page, click the Request Logs dropdown button on the top right corner and select Full Logs.
After a few seconds, a new log file will be ready for download. Hit the Download link and wait until your web browser finishes downloading the small zip archive. Extract the archive, and inside, you’ll find a copy of the /var/log directory from the EC2 instance.
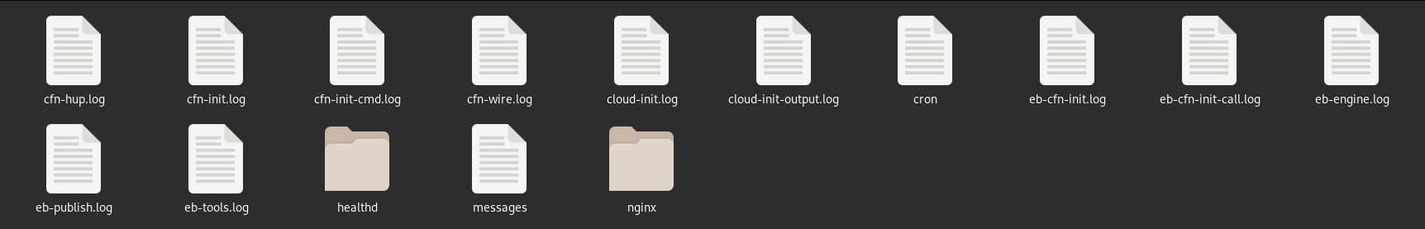
You will find all sorts of important log files in this archive. Open the cfn-init.log file in a text editor and scroll down to the bottom. You should see what went wrong.
2021-07-23 08:26:47,240 [INFO] -----------------------Build complete-----------------------
2021-07-23 08:26:53,317 [INFO] -----------------------Starting build-----------------------
2021-07-23 08:26:53,324 [INFO] Running configSets: Infra-EmbeddedPostBuild
2021-07-23 08:26:53,326 [INFO] Running configSet Infra-EmbeddedPostBuild
2021-07-23 08:26:53,329 [INFO] Running config postbuild_0_laravel_on_beanstalk
2021-07-23 08:26:55,207 [INFO] Command 00_install_composer_dependencies succeeded
2021-07-23 08:28:55,492 [ERROR] Command 02_run_migrations (php artisan migrate --force) failed
2021-07-23 08:28:55,492 [ERROR] Error encountered during build of postbuild_0_laravel_on_beanstalk: Command 02_run_migrations failed
Traceback (most recent call last):
  File "/usr/lib/python3.7/site-packages/cfnbootstrap/construction.py", line 573, in run_config
    CloudFormationCarpenter(config, self._auth_config).build(worklog)
  File "/usr/lib/python3.7/site-packages/cfnbootstrap/construction.py", line 273, in build
    self._config.commands)
  File "/usr/lib/python3.7/site-packages/cfnbootstrap/command_tool.py", line 127, in apply
    raise ToolError(u"Command %s failed" % name)
cfnbootstrap.construction_errors.ToolError: Command 02_run_migrations failed
2021-07-23 08:28:55,495 [ERROR] -----------------------BUILD FAILED!------------------------
2021-07-23 08:28:55,495 [ERROR] Unhandled exception during build: Command 02_run_migrations failed
Traceback (most recent call last):
  File "/opt/aws/bin/cfn-init", line 176, in <module>
    worklog.build(metadata, configSets)
  File "/usr/lib/python3.7/site-packages/cfnbootstrap/construction.py", line 135, in build
    Contractor(metadata).build(configSets, self)
  File "/usr/lib/python3.7/site-packages/cfnbootstrap/construction.py", line 561, in build
    self.run_config(config, worklog)
  File "/usr/lib/python3.7/site-packages/cfnbootstrap/construction.py", line 573, in run_config
    CloudFormationCarpenter(config, self._auth_config).build(worklog)
  File "/usr/lib/python3.7/site-packages/cfnbootstrap/construction.py", line 273, in build
    self._config.commands)
  File "/usr/lib/python3.7/site-packages/cfnbootstrap/command_tool.py", line 127, in apply
    raise ToolError(u"Command %s failed" % name)
cfnbootstrap.construction_errors.ToolError: Command 02_run_migrations failed
Now you’re sure that the 02_run_migrations container command has failed, but it’s still unclear what caused it to fail. Open the cfn-init-cmd.log file. Unlike the previous file that only contains the name of the command that has failed, this one contains the output from the commands. If you scroll to the bottom, you’ll see the output from the 02_run_migrations command.
2021-07-23 08:26:55,221 P26787 [INFO] ============================================================
2021-07-23 08:26:55,221 P26787 [INFO] Command 02_run_migrations
2021-07-23 08:28:55,491 P26787 [INFO] -----------------------Command Output-----------------------
2021-07-23 08:28:55,491 P26787 [INFO]
2021-07-23 08:28:55,491 P26787 [INFO]  In Connection.php line 692:
2021-07-23 08:28:55,491 P26787 [INFO]
2021-07-23 08:28:55,491 P26787 [INFO]    SQLSTATE[HY000] [2002] Connection timed out (SQL: select * from information
2021-07-23 08:28:55,491 P26787 [INFO]    _schema.tables where table_schema = ebdb and table_name = migrations and ta
2021-07-23 08:28:55,491 P26787 [INFO]    ble_type = 'BASE TABLE')
2021-07-23 08:28:55,491 P26787 [INFO]
2021-07-23 08:28:55,491 P26787 [INFO]
2021-07-23 08:28:55,491 P26787 [INFO]  In Connector.php line 70:
2021-07-23 08:28:55,491 P26787 [INFO]
2021-07-23 08:28:55,491 P26787 [INFO]    SQLSTATE[HY000] [2002] Connection timed out
2021-07-23 08:28:55,492 P26787 [INFO]
2021-07-23 08:28:55,492 P26787 [INFO]
2021-07-23 08:28:55,492 P26787 [INFO] ------------------------------------------------------------
2021-07-23 08:28:55,492 P26787 [ERROR] Exited with error code 1
So, the 02_run_migrations has failed because your EC2 instance couldn’t connect to the RDS instance for some reason. At this point, people often think that maybe there’s something wrong with the environment properties. However, even if all your environment properties are correct, the deployment will still fail. The reason is that the AWS RDS instance you created doesn’t allow incoming traffic on port 3306.
Understanding Security Groups
While working with AWS resources, whenever you encounter a Connection timed out error, chances are that you haven’t configured the security groups properly. Security groups are like firewalls. You can set up inbound and outbound rules to control traffic coming into an instance or traffic going out from an instance. Here, an instance can be anything from an Amazon EC2 instance, an Amazon RDS instance, or an Amazon ElastiCache instance.
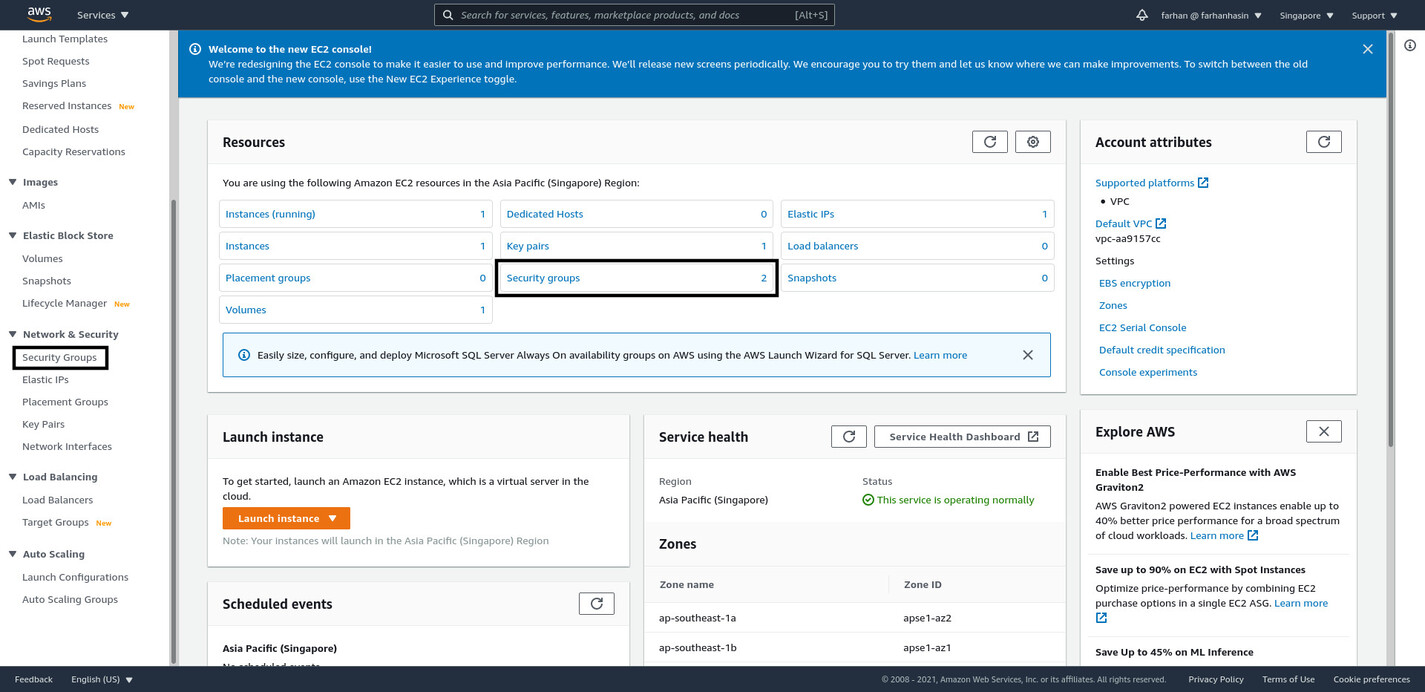
To create a new security group, you’ll have to navigate to the Amazon EC2 Management Console. You can do s by either using the search bar or the services menu. On the management console, click on Security Groups on the Resources section or on the navigation pane on the left side of the page.
On the security groups page, you’ll see all the currently available security groups.
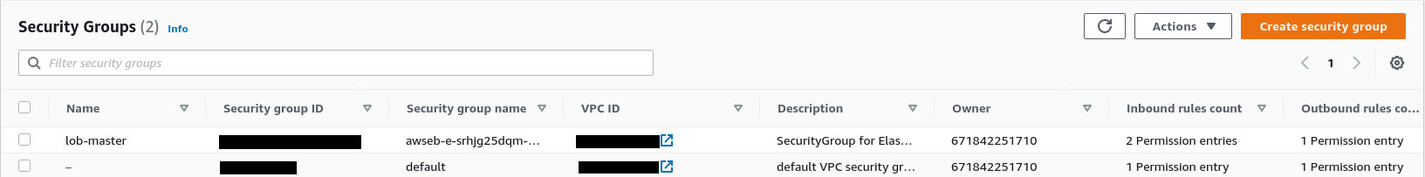
As you can see, AWS EB has created a security group for the lob-master environment. If you go into the details of this security group, you’ll see it allows HTTP traffic on port 80. This is why you can access your application running inside the EC2 instance. You’ll have to create a similar security group for the AWS RDS instance.
To do so, click the Create security group button on the top-right corner of the security groups page. As the security group name, input rds-lob-master, where rds stands for Relational Database Service, and lob-master is the instance name. This is not mandatory; it’s just a naming convention that I personally follow. Put a description like Allows the lob-master EC2 instance to access the lob-master RDS instance and leave the VPC unchanged. VPCs are an advanced topic and out of the scope of this article. I’m assuming that you haven’t created any custom VPCs and are working with the default one.
In the Inbound rules section, press the Add rule button to create a new inbound rule. Select MYSQL/Aurora from the Type dropdown menu. The Protocol and Port range will be filled in automatically. Select Custom from the Source dropdown menu. There will be a small input box with a magnifying glass icon. Search for lob-master and select the one that has awseb-LONG_RANDOM_STRING in the name.
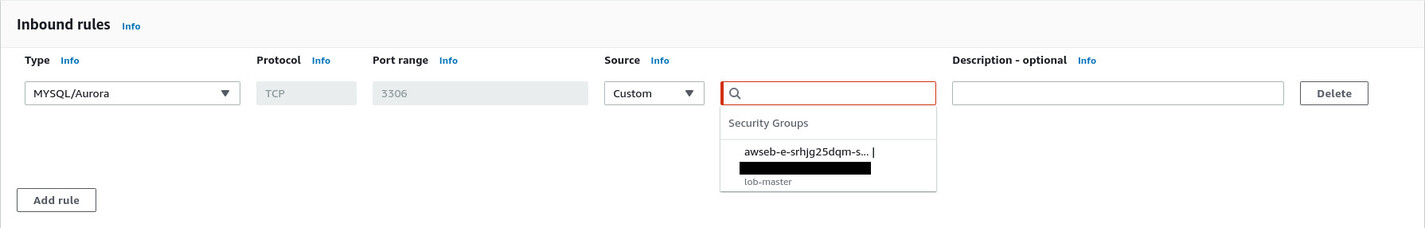
Scroll down to the bottom and hit the Create security group button. What you just did is create a new security group that allows TCP traffic on port 3306 from any instance that has the lob-master security group assigned, allowing traffic to flow from the EC2 instance to the RDS instance freely. So, once you assign the newly created rds-lob-master security group to the RDS instance, your application will be able to connect without any issue.
Navigate to the Amazon RDS management console, and from the list of instances, go into the details of the lob-master instance. By default, you’ll see it has the default security group assigned to it.
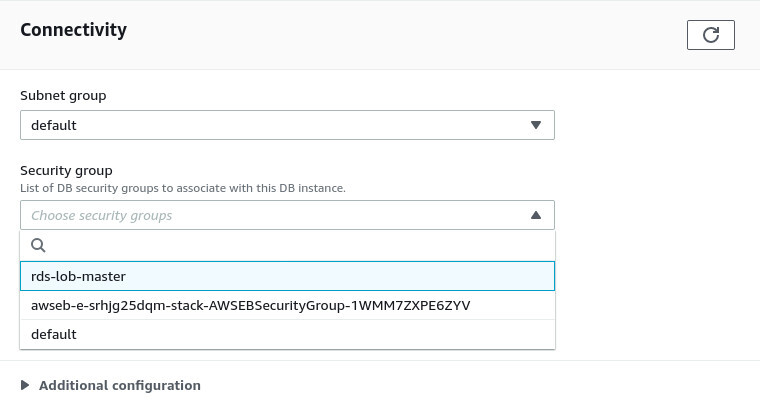
To assign the new security group, click the Modify button at the top-right corner. Scroll down to the Connectivity section. Now select rds-lob-master security group from the Security group dropdown menu and deselect the default one.
Leave everything else unchanged. Scroll down to the bottom and click on the Continue button. For the next step, under the Scheduling of modification section, select Apply Immediately and hit the Modify DB instance button. It’ll take a few moments to modify. Once it’s done, you’ll see that the default security groups are now gone, and the rds-lob-master security group is active. The database server is now ready to take connections.
Retrying Failed Deployments
Go back to AWS EB, and on the lob-master environment dashboard, click on Application versions from the navigation pane on the left side of the page. You’ll be presented with a list of all the available versions of the application.
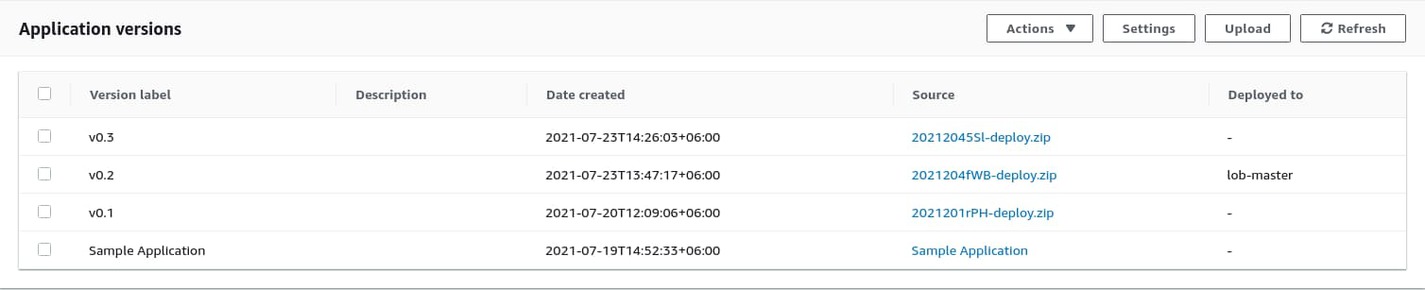
Select the latest one, and from the Actions dropdown menu at the top-right corner, select Deploy. On the Deploy Application Version modal, make sure lob-master is selected under Environment and hit the Deploy button. Go back to the lob-master environment dashboard and wait with your fingers crossed. If you’ve set the environment properties properly, the deployment should be successful this time.
Testing Out The Database Connection
If the deployment succeeds, it means that the application can access the database now, and you should be able to login as the admin user. To do so, visit your environment URL and go to the /login route. The admin user credentials are as follows:
- email – farhan@laravel-on-beanstalk.site
- password – password
Try logging in, and you should land on the dashboard.
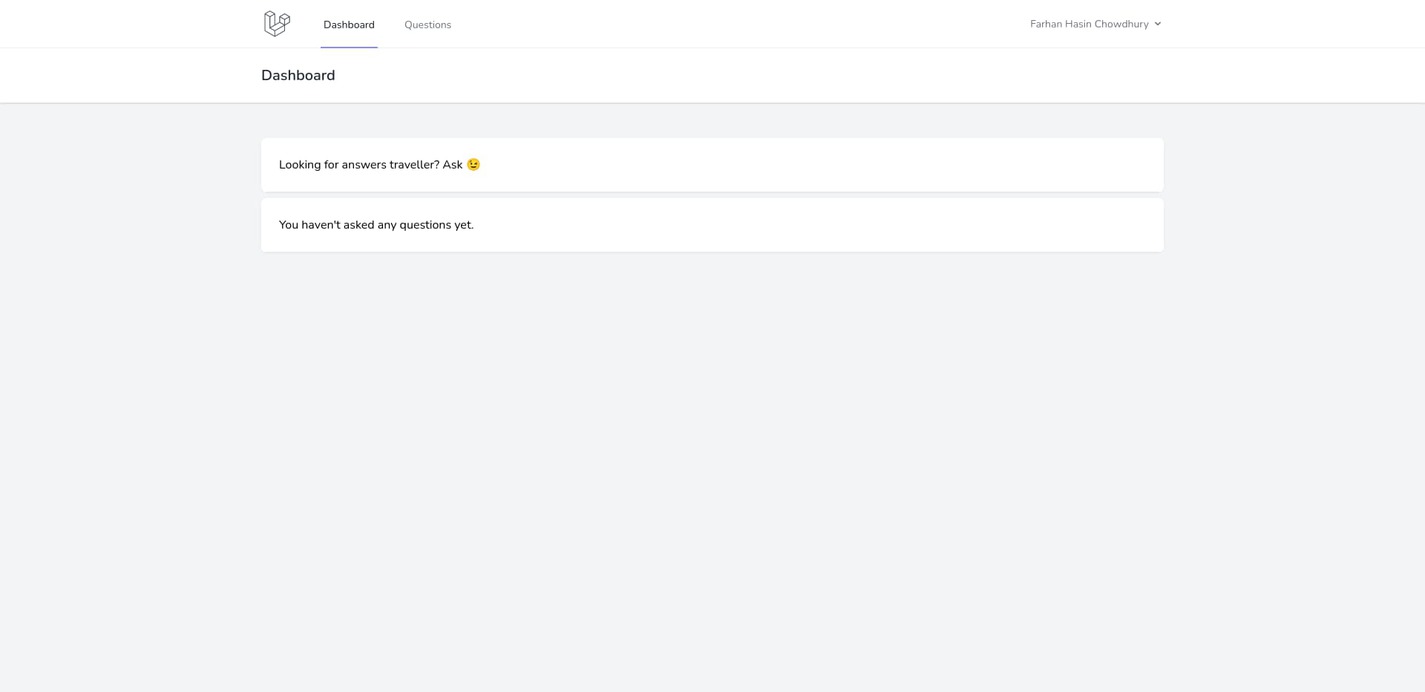
If you’ve come this far, congratulations on making your deployment finally functional. However, there is still a lot to do.
Using Amazon ElastiCache As the Cache and Queue Driver
Now that you have a working database set up for your application, its time to set up a functional cache instance using Amazon ElastiCache. Amazon ElastiCache is a service similar to Amazon RDS, but it lets you run in-memory database servers, such as memcached or Redis, managed by AWS. Before creating a new Amazon ElastiCache instance, you’ll have to create a new security group.
Creating a New Security Group
To create a new security group, navigate to the EC2 management console. Go to security groups and click on the Create security group button like you did before. Put elasticache-lob-master as the Security group name and Allows lob-master EC2 instance to connect to the lob-master ElastiCache instance as the description.
Under the Inbound rules section, choose Custom TCP from the Type dropdown menu. Put 6379 in the Port range input box because the Redis server responds on port 6379 by default. Choose Custom from the Source dropdown menu and search for lob-master in the search bar. Select the one that has awseb-LONG_RANDOM_STRING in the name.
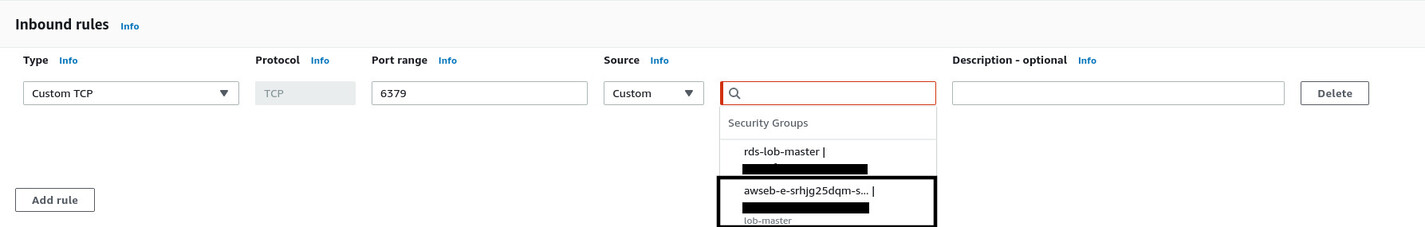
Make sure to avoid selecting the rds-lob-master security group as the source by accident. Once the inbound rule is in place, scroll down to the bottom and hit the Create security group button.
Creating a New Amazon ElastiCache Redis Instance
Now go to the Amazon Elasticache management console using the search bar or from the services list. Once you’re on the management console, click the Get Started Now button to start the cluster creation wizard.
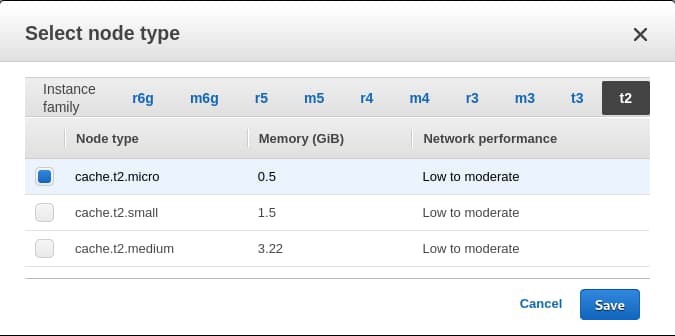
Select Redis as the Cluster engine and make sure Cluster Mode Enabled is unchecked. Leave the Location section unchanged, and under the Redis settings section, put lob-master as the Name. Leave the Description, Engine version compatibility, Port, and Parameter group unchanged. Change the Node type to cache.t2.micro to stay within the limits of the free tier.
Change the Number of replicas to 0, which will disable the Multi-AZ option automatically. Under Advanced Redis settings, select Create new from the Subnet group dropdown menu. Put default-vpc-subnet-group as the Name and Default VPC Subnet Group as the description. Select all three subnets from the Subnets list. Like VPCs, Subnets and Subnet Groups are advanced topics and out of the scope of this article. I’m assuming that you haven’t created any custom VPCs and are working with the default one.
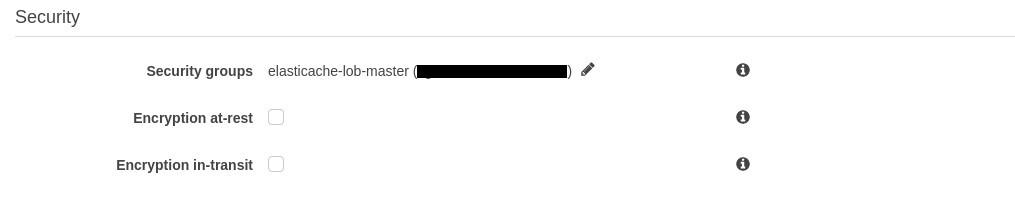
Under the Security section, change the Security groups by using the little pencil icon. Select the elasticache-lob-master security group and deselect the default one. Leave the encryption settings disabled. The security group will prevent traffic from getting into the instance. Using encryption can make things even more secure, but for the sake of simplicity, I’ll let it pass for now.
Leave the Logs and Import data to cluster sections unchanged. Under the Backup section, uncheck Enable automatic backups because, just like the RDS instance, you won’t need backups for this project. Finally, hit the Create button at the bottom-right corner.
Connecting to Amazon ElastiCache from AWS Elastic Beanstalk
The AWS ElastiCache instance creation process will take a few minutes. Meanwhile, navigate back to the AWS Elastic beanstalk lob-master environment dashboard and add following environment properties like you did before.
- REDIS_HOST – < endpoint from ElastiCache >
- REDIS_PORT – 6379
You’ll have to extract the value of REDIS_HOST from the Amazon ElastiCache once your instance is up and running. Go back to the Amazon ElastiCache management console, and from the list of clusters, click on the lob-master name. Copy the entire string under Endpoint and paste it as the value of REDIS_HOST on AWS EB.
This is enough information to connect to the Redis cluster from your application, but you still have to configure the application to utilize Redis as the cache and queue driver. To do so, add following environment properties to the AWS EB environment:
- CACHE_DRIVER – redis
- QUEUE_CONNECTION – redis
Now your application should use Redis as the cache and queue driver. Initially, I wanted to use Amazon SQS or Simple Queue Service to run queued jobs in Laravel. However, I quickly realized that Laravel Horizon is a lot better when it comes to monitoring and troubleshooting Laravel queues. In the official Laravel docs, they recommend supervisor for running Laravel Horizon. In the next subsection, I’ll show you how you can install and configure supervisor using AWS EB platform hooks.
Installing and Configuring Supervisor to Run Horizon
You’ve already worked with configuration files, reverse proxy configuration, and a postdeploy hook in a previous section. In this one, you’ll work with a prebuild hook for the first time and add some new scripts to the postdeploy hook.
Start by creating a new directory .platform/hooks/prebuild and a new file .platform/hooks/prebuild/install_supervisor.sh with the following content:
#!/bin/sh

# Installs supervisor from EPEL repository
# http://supervisord.org/installing.html#installing-a-distribution-package

sudo amazon-linux-extras enable epel

sudo yum install -y epel-release

sudo yum -y update

sudo yum -y install supervisor

sudo systemctl start supervisord

sudo systemctl enable supervisord

sudo cp .platform/files/supervisor.ini /etc/supervisord.d/laravel.ini

sudo supervisorctl reread

sudo supervisorctl update
This is a simple shell script that installs supervisor on the EC2 instance and sets up the supervisord service to run on start up. The script also copies a file from .platform/files/supervisor.ini to the /etc/supervisord.d directory. This file contains the necessary configuration for starting Laravel Horizon.
Create a new directory .platform/files and a new file .platform/files/supervisor.ini with the following content:
[program:horizon]
process_name=%(program_name)s
command=php /var/app/current/artisan horizon
autostart=true
autorestart=true
user=root
redirect_stderr=true
stdout_logfile=/var/log/horizon.log
stopwaitsecs=3600
This configuration file is almost identical to the one from the official Laravel docs. Finally, create a script called .platform/hooks/postdeploy/restart_supervisorctl.sh with the following content:
#!/bin/bash

# Restarts all supervisor workers

sudo supervisorctl restart all
The script causes the supervisor to restart all the processes after deployment. This is pretty much all that you need to make Laravel Horizon work. Before you commit these files, make sure they all have executable permission. To do so, execute the chmod +x .platform/hooks/prebuild/*.sh && chmod +x .platform/hooks/postdeploy/*.sh command on the root of your project directory.
Now commit all the changes and zip up the updated source code by executing the git archive -v -o deploy.zip --format=zip HEAD command. Deploy the updated source code on AWS EB with a newer version label, such as v0.4, and wait until the deployment finishes.
Testing Out Laravel Horizon
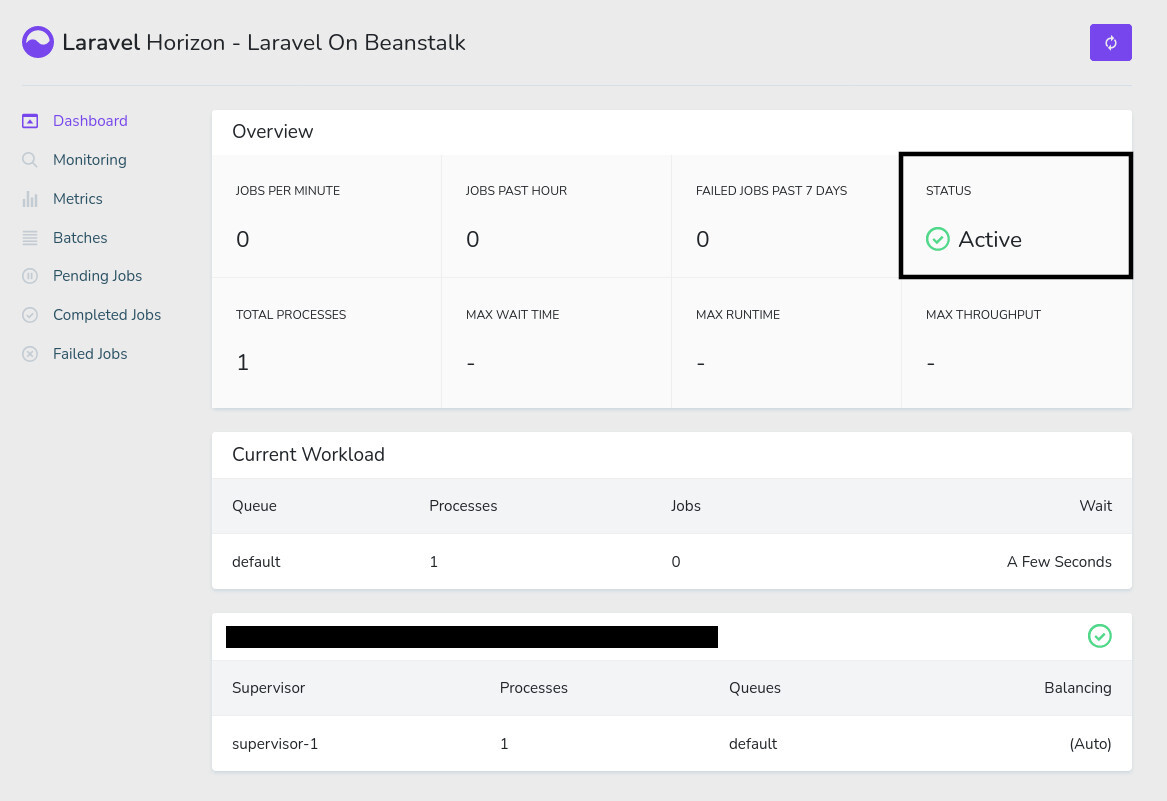
To test whether Laravel Horizon is working correctly, log into the application as the admin user and navigate to the /horizon route. If everything works fine, you’ll see Laravel Horizon in Active status.
Laravel Horizon is configured to only allow the admin user to see this dashboard. So, if you log in with some other account, you’ll see a 403 Forbidden error. To fire a new job, open a private/incognito window and visit the /register route on the application. Register a new account, and you’ll see a new VerifyEmailQueued job show up on Laravel Horizon.
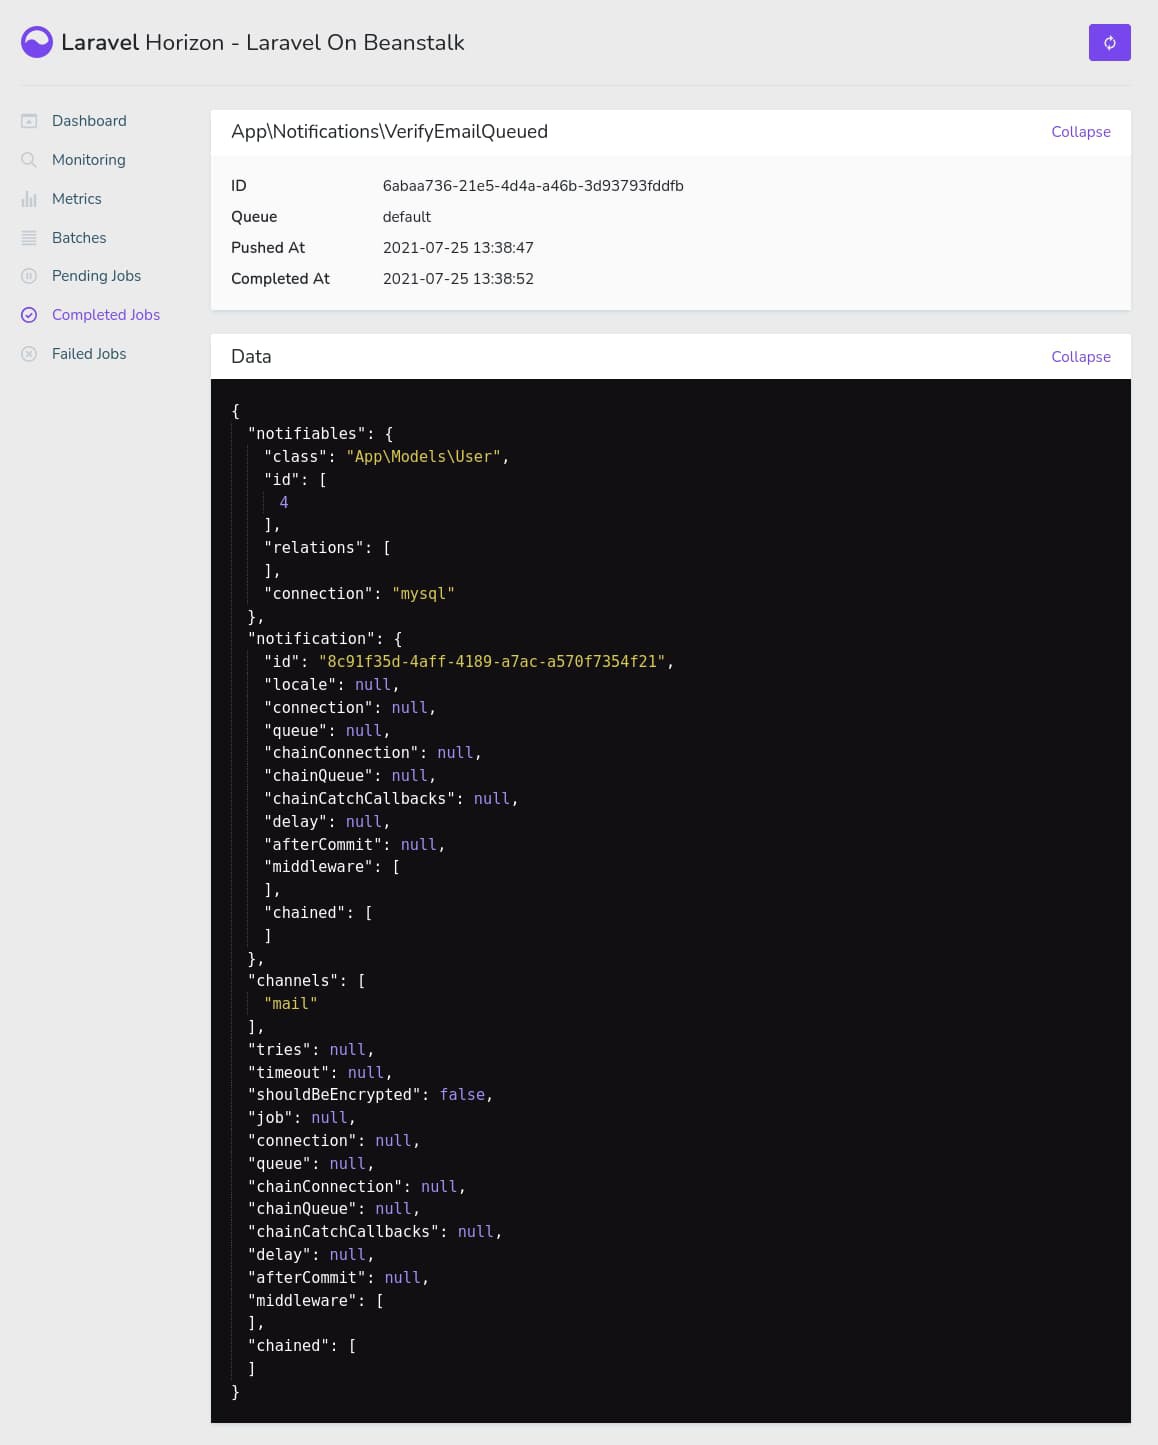
This is the confirmation mail for new users. If you’ve set up MailTrap properly in one of the previous sections, the mail should be received in your MailTrap inbox.
Assigning a Domain Name to Your Elastic Beanstalk Application
Assigning a domain name to your Elastic Beanstalk application is one of the tasks that confuse a lot of beginners. All the official AWS docs usually talk about using Amazon Route 53 for domains, but in this article, I’ll show you how to use a third-party domain provider, such as NameCheap, with your AWS EB application.
I’ve already bought the laravel-on-beanstalk.site domain on NameCheap for this article. If you use some other provider, such as GoDaddy or CloudFlare, the process should be almost the same.
Log into your domain provider account and go into DNS configuration. In NameCheap, it’s called Advanced DNS. In there, remove any previous DNS records and add the following ones:
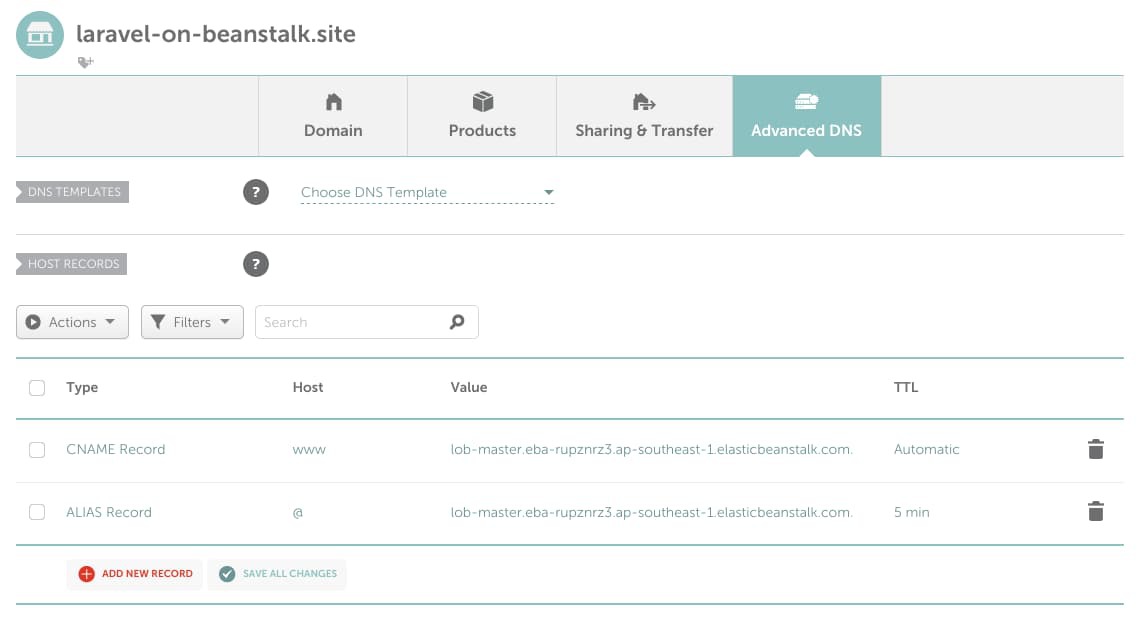
As you can see, I’ve added one ALIAS record for the naked laravel-on-beanstalk.site domain and one CNAME record for the www sub domain, both pointing to my AWS EB application domain address. Some providers, such as CloudFlare, don’t have ALIAS records; instead, they have CNAME flattening support. In these cases, both records will have to be CNAME records.
This is one of the ways that you can configure your domain. You can also define only one CNAME record for the www subdomain and redirect the naked domain to it. As long as you know what you’re doing, follow whatever configuration you like.
Usually, providers say that it may take a few hours for the DNS settings to activate, but I’ve found that they work almost instantly. So, you should now be able to access your AWS EB application using your custom domain, but only on HTTP protocol.
Provisioning a Free SSL Certificate From Let’s Encrypt Using Certbot
Assuming you’ve successfully set up your domain, go back to your application source code and create a new file .platform/hooks/install_certbot.sh with the following content:
#!/bin/sh

# Installs certbot from EPEL repository
# https://certbot.eff.org/instructions

sudo amazon-linux-extras enable epel

sudo yum install -y epel-release

sudo yum -y update

sudo yum install -y certbot python2-certbot-nginx
This script only installs the certbot program from the Electronic Frontier Foundation, which makes obtaining free SSL certificates very easy. Now create another file .platform/hooks/postdeploy/get_ssl_certificate.sh with the following content:
#!/bin/sh

sudo certbot \
    -n \
    --nginx \
    --agree-tos \
    -d $(/opt/elasticbeanstalk/bin/get-config environment -k CERTBOT_DOMAINS) \
    --email $(/opt/elasticbeanstalk/bin/get-config environment -k CERTBOT_EMAIL)
This is a single shell command for the certbot program that automatically provisions a SSL certificate for the domain names passed after the -d option. I don’t like hard coding the domain names and email address in this script. Amazon provides a very nifty program called get-config that lets you extract environment properties from platform hooks. This means that you’ll have to define the domain names and the email address where you’ll receive notification emails regarding the SSL certificate in the AWS EB environment properties.
To do so, navigate to the lob-master environment dashboard on AWS EB and edit the Software configuration. Add the following environment variables under the Environment properties section and hit apply.

The CERTBOT_DOMAINS has to be a comma separated string with no spaces in between. If you have only one domain name, then just write that. The CERTBOT_EMAIL can be any email address to which you have regular access.
This is enough to obtain a new SSL certificate, but certificates issued by Let’s Encrypt are only valid for 90 days. You’ll have to set up a cron job for renewing the certificate. Create one last file .platform/hooks/postdeploy/auto_renew_ssl_certificate.sh with the following content:
#!/bin/sh

echo "0 0 1 * * certbot renew --no-self-upgrade" \
    | sudo tee /etc/cron.d/renew_ssl_cert_cron
This creates a new cron job under /etc/cron.d/renew_ssl_cert_cron that executes the certbot renew --no-self-upgrade command on the 1st day of every month. The certificates are valid for much longer than one month, but renewing them earlier causes no harm. If you do not know how to configure cron jobs, you can use the crontab guru website.
There is one more thing to do before you deploy. I hope that you remember that the security group assigned to the lob-master EC2 instance allows traffic on port 80, which is the default port for HTTP. HTTPS traffic, however, uses port 443. To allow HTTPS traffic into your EC2 instance, go to the Amazon EC2 management console and then go to Security Groups like you did before.
From the list of security groups, select the lob-master security group and select Edit inbound rules from the Actions dropdown menu at the top-right corner. Press the Add rule button to add a new rule. Select HTTPS from the Type dropdown menu and Anywhere-IPv4 from the Source dropdown menu. Finally, hit the Save rules button.
Make sure they all have executable permission. To do so, execute the chmod +x .platform/hooks/prebuild/*.sh && chmod +x .platform/hooks/postdeploy/*.sh command on the root of your project directory.
Now commit all the changes and zip up the updated source code by executing the git archive -v -o deploy.zip --format=zip HEAD command. Deploy the updated source code on AWS EB with a newer version label, such as v0.5, and wait until the deployment finishes. Try visiting your custom domain, and you should now have a valid SSL certificate and HTTPS.
Automating Deployments Using GitHub Actions
Manually deploying the application every time you’ve made some changes can be boring. One way to automate this process is by using GitHub Actions. In this section, you’ll learn about setting up a very simple workflow to deploy the application automatically whenever you push new code to the master branch.
The first step to setting up this workflow is letting GitHub actions access your AWS account on your behalf. To do so, you’ll need to create a new user on AWS with programmatic access to AWS EB and use it to perform the deployments.
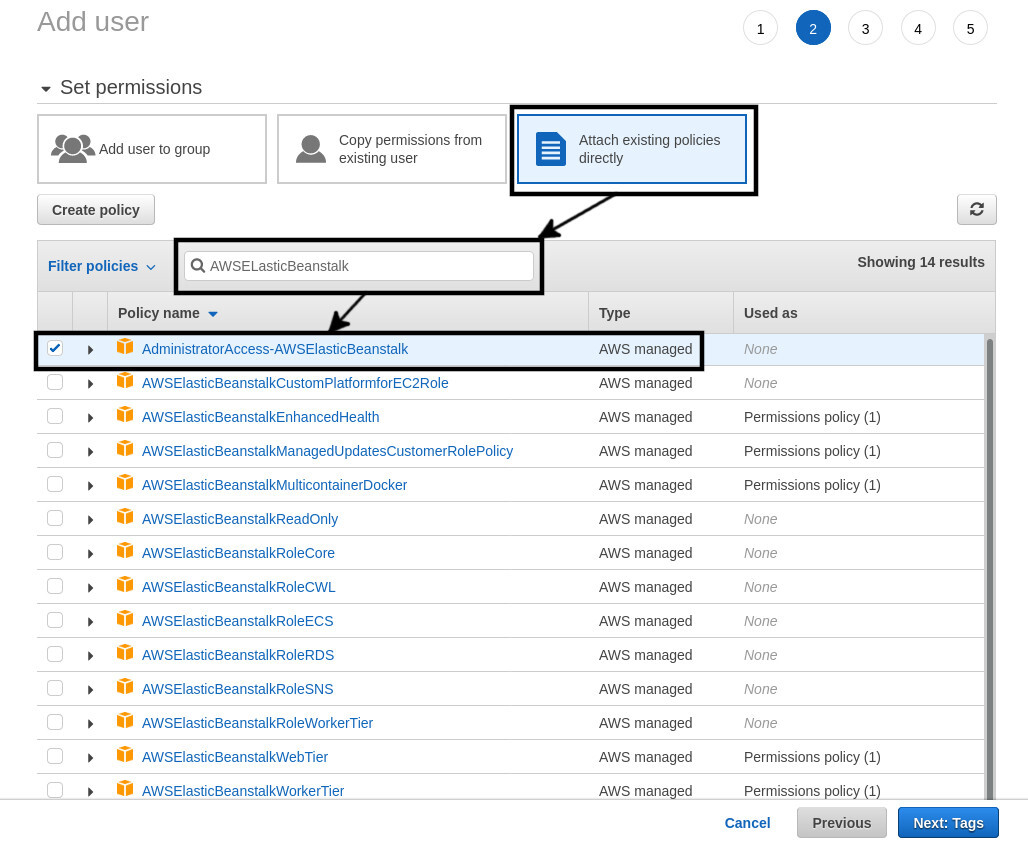
Navigate to the AWS Identity and Access Management (IAM) service using the search bar or from the services menu. Click on Users on the navigation pane on the left side of the page. On the Users page, click the Add users button at the top-right corner. Put lob-github-actions as the User name in the Set user details section and select Programmatic access on the Select AWS access type section. Press the Next: Permissions button.
For the second step, select the Attach existing policies directly option. From the list of policies, search for AWSELasticBeanstalk and select AdministratorAccess-AWSElasticBeanstalk from the list.
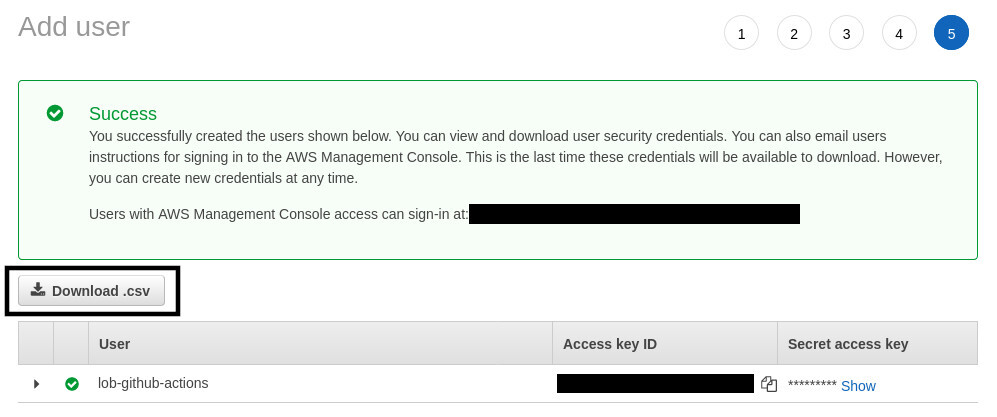
You don’t have to do anything for steps 3 and 4. For step 5, you’ll receive an Access key ID and Secret access key from Amazon. Make note of them or press the Download .csv button.
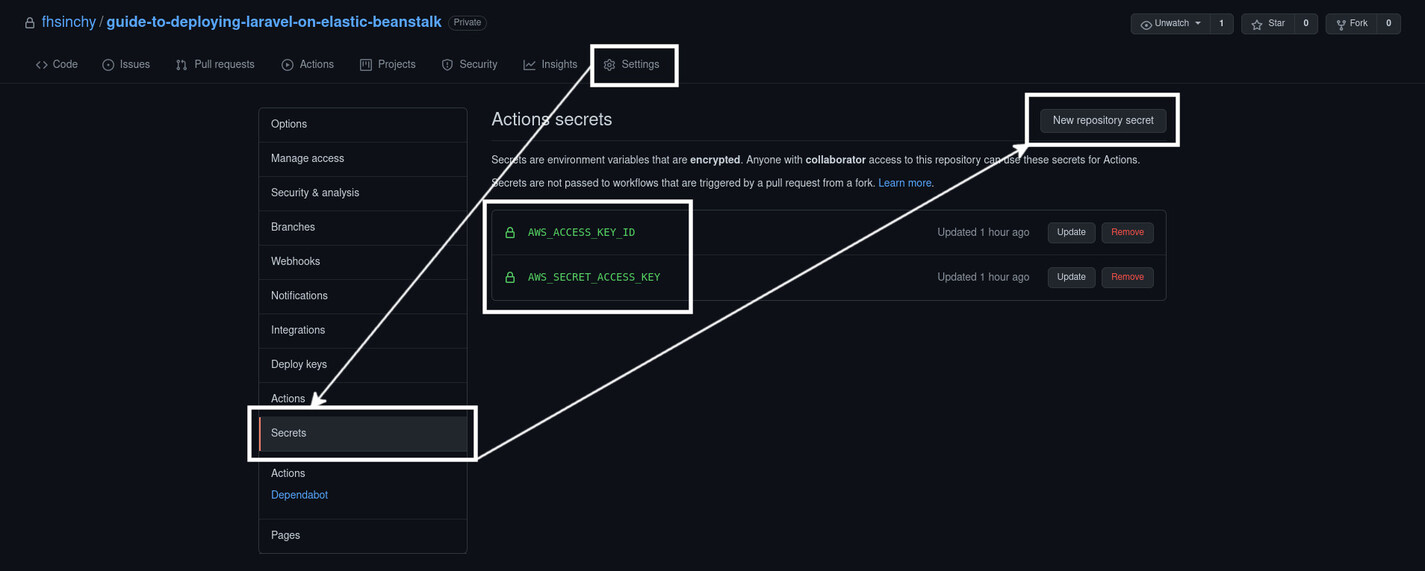
I hope that you’ve forked the reference project repository on your GitHub profile by now. Navigate to this fork and go to the Settings tab. Go to Secrets from the navigation pane on the left side of the page and use the New repository secret button to create two secrets: one for the access key ID and another for the secret access key. Name them AWS_ACCESS_KEY_ID and AWS_SECRET_ACCESS_KEY, respectively, with the values that you got from AWS IAM.
GitHub actions have workflows consisting of multiple jobs. These jobs usually have multiple steps. To create a new workflow for your repository, go back to your application source code and create a new file .github/deploy.yml with the following content:
name: Laravel Deploy

on:
  push:
    branches: [ master ]

jobs:
  deploy:
    runs-on: ubuntu-latest

    steps:

      - name: Checkout source code
        uses: actions/checkout@v2

      - name: Generate deployment package
        run: zip -r deploy.zip . -x '*.git*'

      - name: Deploy to AWS Elastic Beanstalk
        uses: einaregilsson/beanstalk-deploy@v17
        with:
          aws_access_key: $
          aws_secret_key: $
          application_name: laravel-on-beanstalk
          environment_name: lob-master
          version_label: $
          region: ap-southeast-1
          deployment_package: deploy.zip
This is a very simple workflow named Laravel Deploy. The workflow will be triggered whenever you push some code on the master branch. There is only one job called deploy, and it has three steps.
The first step checks out your source code, making a copy of it available to the workflow. The second step creates a new archive deploy.zip by compressing the application source code. Finally, the third step deploys the generated archive to AWS EB. You can access repository secrets using the secrets.<secret name> syntax. The github.sha environment variable refers to the ID of the commit that has triggered this workflow. Make sure to replace the region value with the one you’re using. Commit this file and push it to the master branch.
On the GitHub repository page, switch to the actions tab to see the running workflow. It may take around five minutes to finish. Once done, go to the lob-master environment dashboard on AWS EB and you’ll see a new version has been deployed with a version label identical to the last commit ID.
Conclusion
That’s a wrap on this article. I’ve covered almost all the aspects of deploying a Laravel project on AWS Elastic Beanstalk, except for log aggregation. I’ve already said that every time you deploy a new version of your application, all the files inside the storage directory will be lost, including the log files and user uploads. Although it’s possible to stream Laravel logs to Amazon CloudWatch, people often use a third-party tool, such as Papertrail or the ELK Stack. If you want to learn more about log streaming to Amazon CloudWatch, check out the completed branch of the reference project. It contains the necessary configuration inside the .ebextensions/stream_logs_to_cloudwatch.config file. The branch also contains additional platform hooks for installing Node.js and compiling the static assets.
Thank you for being patient throughout the entire article. I hope that you’ve gained a solid understanding of deploying web applications on AWS Elastic Beanstalk. The techniques shown in this article can also be applied to other frameworks or languages. If you have any confusion regarding anything shown in this article, feel free to connect with me on Twitter, LinkedIn or GitHub. Till the next one, stay safe and keep on learning.