https://miro.medium.com/v2/resize:fit:1200/1*X4NgzhgmPtOpdDdPPBiDlw.pngThis article will hopefully help you to understand how to build a system that can work with multiple OpenAi API function calls!Laravel News Links
Multiple OpenAi Functions PHP / Laravel
https://miro.medium.com/v2/resize:fit:1200/1*X4NgzhgmPtOpdDdPPBiDlw.pngThis article will hopefully help you to understand how to build a system that can work with multiple OpenAi API function calls!Laravel News Links
Build Your Own DIY NAS Server Using Raspberry Pi 4
https://static1.makeuseofimages.com/wordpress/wp-content/uploads/2023/08/how-to-build-a-diy-nas-using-raspberry-pi-4-and-owncloud.jpg
Whether you are a professional photographer with thousands of high-resolution images, a small business owner with critical data, or a movie enthusiast with an extensive collection, having a reliable and secure storage solution is essential. The same goes for any individual who wants to safely store and access their data with complete privacy. This is where network-attached storage (NAS) comes into play.
While commercial versions are available, you can also build your own NAS using a Raspberry Pi 4 and ownCloud—which is more cost-effective and customizable.
Why Build Your Own NAS Using Raspberry Pi and ownCloud?
Building your own NAS provides several advantages over buying a pre-built solution:
- You can customize the storage capacity as per your specific needs.
- You have complete control over your data, it is stored locally and securely.
- You can use the NAS server to back up data from all devices and safeguard against accidental data loss.
- Cost-effective and energy-efficient since we are using a Raspberry Pi 4 that consumes 15W at max.
- You can also use the server for other services, such as Plex
ownCloud is a popular open-source software solution that allows you to create your own cloud storage. It provides a secure and easy-to-use interface for managing and accessing your files from anywhere, using any device—including Android, iOS, macOS, Linux, and Windows platforms.
You can also sync your files across multiple devices and share them with others. It also supports a wide range of plugins and extensions, enabling you to extend its functionality and enable two-factor authentication for additional security.
In addition, you can build a personal DIY cloud storage with remote access, or a web server and host a website on your Raspberry Pi 4.
Things You Will Need
To build your own NAS with Raspberry Pi 4 and ownCloud, you will need the following:
- Raspberry Pi 4 with 4GB or 8GB RAM for optimum performance
- NVME or SATA SSD with a USB enclosure/connector
- Class 10 16GB or 32GB microSD card
- Power supply for the Raspberry Pi 4
- Reliable Gigabit network (router) to connect your NAS to your local network for high-speed data transfer
Step 1: Set Up Raspberry Pi 4 for NAS
Firstly, you need to download the official Raspberry Pi Imager tool and then follow these steps to install the operating system.
- Launch the Raspberry Pi Imager tool.
- Click Choose OS and select Raspberry Pi OS (Other) > Raspberry Pi OS Lite (64-bit).
- Click Choose Storage and select your SD card.
- Click on the gear icon (bottom right) and enable SSH. Enter a username and password for SSH and click Save.
- Click Write. Select Yes to confirm.
After flashing the microSD card, insert it into the Raspberry Pi 4 and connect the power supply. The Raspberry Pi 4 will boot into the Raspberry Pi OS Lite.
You can now check the router’s DHCP setting to find the IP address of the Raspberry Pi, or use the Fing app on your smartphone (iOS and Android). Alternatively, connect a keyboard, mouse, and display to the Pi and then run the following command to find its IP address:
hostname -I
Step 2: Install and Configure ownCloud on Raspberry Pi 4
To set up ownCloud on Raspberry Pi 4, you will need to install the following:
- A web server (NGINX or Apache)
- PHP
- MariaDB database
To install these services, install and run the PuTTY app on Windows, or use the Terminal app on macOS, and connect to the Raspberry Pi via SSH.
Then run the following commands:
 sudo apt-get update
sudo apt-get upgrade
Wait for the upgrade to finish. Press Y and hit Enter when prompted. After the update, run the following commands to install the required packages.
 sudo apt-get install apache2
sudo apt install apache2 libapache2-mod-php7.4 openssl php-imagick php7.4-common php7.4-curl php7.4-gd php7.4-imap php7.4-intl php7.4-json php7.4-ldap php7.4-mbstring php7.4-mysql php7.4-pgsql php-smbclient php-ssh2 php7.4-sqlite3 php7.4-xml php7.4-zip
After installing the required packages, restart the Apache server.
sudo service apache2 restart
Then run the following command to add the user to the www-data group.
sudo usermod -a -G www-data www-data
Next, we can download and install the ownCloud on the Raspberry Pi 4 using the following commands:
 cd /var/www/html
sudo wget https:
sudo unzip owncloud-complete-latest.zip
Create a directory to mount an external SSD and change the ownership of the ownCloud directory:
 sudo mkdir /media/ExternalSSD
sudo chown www-data:www-data /media/ExternalSSD
sudo chmod 750 /media/ExternalSSD
Fix permissions to avoid issues:
 sudo chown -R www-data: /var/www/html/owncloud
sudo chmod 777 /var/www/html/owncloud
sudo mkdir /var/lib/php/session
sudo chmod 777 /var/lib/php/session
Next, you need to configure the Apache web server. Open the config file:
sudo nano /etc/apache2/conf-available/owncloud.conf
Then add the following lines to it:
 Alias /owncloud "/var/www/owncloud/"

<Directory /var/www/owncloud/>
  Options +FollowSymlinks
  AllowOverride All

 <IfModule mod_dav.c>
  Dav off
 </IfModule>

 SetEnv HOME /var/www/html/owncloud
 SetEnv HTTP_HOME /var/www/html/owncloud

</Directory>
Save and exit nano with Ctrl + O then Ctrl + X. Then enable the Apache modules:
 sudo a2enconf owncloud
sudo a2enmod rewrite
sudo a2enmod headers
sudo a2enmod env
sudo a2enmod dir
sudo a2enmod mime
Install the MariaDB database:
sudo apt install mariadb-server
Create a database for users:
 sudo mysql

CREATE DATABASE owncloud;
CREATE USER 'ownclouduser'@'localhost' IDENTIFIED BY 'YourPassword';
GRANT ALL PRIVILEGES ON owncloud.* TO 'ownclouduser'@'localhost';
FLUSH PRIVILEGES;
Exit;
Reboot the Raspberry Pi:
sudo reboot
Step 3: Add External Storage
You can add multiple USB storage devices to Raspberry Pi 4 via the USB 3.0 ports. Connect one of your SSDs or hard drives to the USB port and follow the steps below to mount the external storage device to a directory in the file system and add storage to your DIY NAS.
We have already created the /media/ExternalSSD directory for mounting the external storage. Make sure the SSD or HDD is NTFS formatted. Then follow these steps to mount it:
sudo apt-get install ntfs-3g
Then get the GID, UID, and UUID:
 id -u www-data
id -g www-data
ls -l /dev/disk/by-uuid
Note down the UUID, GID, and UID. In our example, the sda1 is the external NTFS formatted SSD disk. Next, we will add the drive to the fstab file.
sudo nano /etc/fstab
Add the following line:
UUID= 01D9B8034CE29270 /media/ExternalSSD auto nofail,uid=33,gid=33,umask=0027,dmask=0027,noatime 0 0
To mount the external storage device, you need to find its device identifier. Use the following command to list all connected storage devices:
lsusb
At this stage, you can restart the Raspberry Pi to auto-mount the external storage, or mount it manually:
sudo mount /dev/sda1 /media/ExternalSSD
All your files on the NTFS drive should be visible in the /media/ExternalSSD directory.
The drive currently contains only System Volume Information and RECYCLE.BIN hidden folders. Reboot the system.
sudo reboot
4. Configure ownCloud
After the reboot, visit the IP address of the Raspberry Pi in a web browser to access your ownCloud.
Enter a username and password of your choice. Click on Storage & database and enter the MariaDB database details as shown below.
If you are using an external drive to store data, make sure to change the Data folder path to /media/ExternalSSD from default /var/www/html/owncloud/data. In future, if you want to add new drive or more storage, follow this ownCloud guide to update the directory path.
Click Finish Setup. After a while, you can log in to ownCloud.
You can download the ownCloud app on your smartphone or computer to sync your files. But before you start the sync or file upload, add external HDD or SSD storage.
If you have followed each step carefully, you should be good to go and ready to upload the files to your ownCloud NAS.
Using Your New Raspberry Pi 4 NAS
A NAS allows you to centralize and access your data from multiple devices on your local network. It’s a convenient and efficient way to store, share, and back up your files at home or the office. Create more users and assign them their ownCloud account to let them upload and secure their data.
Building your own NAS with Raspberry Pi 4 and ownCloud offers a cost-effective and customizable solution to meet your storage needs and take control of your data!
MakeUseOf
DIY Concrete Lunar Surface
https://theawesomer.com/photos/2023/09/diy_lunar_surface_t.jpg

The Life Art channel shows how to put the moon on your wall by sculpting a cement relief of the lunar surface. The artist starts by filling a circular area with a sand-cement mixture, building up an outer ring for depth, and then using a trowel to create a rough texture and add craters with its handle. The addition of LED lights makes the shadows pop.
The Awesomer
Boost your Eloquent Models with Laravel Lift
https://laravelnews.s3.amazonaws.com/images/lift-featured.jpg
Lift is a package that boosts your Eloquent Models in Laravel.
It lets you create public properties in Eloquent Models that match your table schema. This makes your models easier to read and work with in any IDE.
It provides a simple way to set up your models, focusing on simplicity and ease of use by using PHP 8’s attributes.
The package depends on Eloquent Events to work. This means the package fits easily into your project without needing any major changes (unless you’ve turned off event triggering).
In this post, let’s take a deep dive into Lift and learn about all the features that it provides.
Installing Laravel Lift
You can install the package via composer:
composer require wendelladriel/laravel-lift
To start using Lift, you need to add the Lift trait to your Eloquent Models, and you’re ready to go.
use Illuminate\Database\Eloquent\Model;
use WendellAdriel\Lift\Lift;
final class Product extends Model
{
use Lift;
}
Features
Out-of-the-box, when you add the Lift trait to your Eloquent Models, you can create public properties on them, making them easier to understand and to work within any IDE.
use Illuminate\Database\Eloquent\Model;
use WendellAdriel\Lift\Lift;
final class Product extends Model
{
use Lift;
public $id;
public $name;
public $price;
}
The magic happens when you start using the Attributes that the package provides.
Class Attributes
DB Attribute
Lift provides a DB attribute that you can use to define the connection, table, and timestamps of your model.
Without Lift
use Illuminate\Database\Eloquent\Model;
final class Product extends Model
{
public $timestamps = false;
protected $connection = 'mysql';
protected $table = 'custom_products_table';
// ...
}
With Lift
use Illuminate\Database\Eloquent\Model;
use WendellAdriel\Lift\Attributes\DB;
use WendellAdriel\Lift\Lift;
#[DB(connection: 'mysql', table: 'custom_products_table', timestamps: false)]
final class Product extends Model
{
use Lift;
// ...
}
Relationships Attributes
Lift provides attributes to define relationships between models, so instead of defining them using methods, you can define them as attributes instead. All the relationships attributes accept the same parameters that the methods accept.
Without Lift
// Post.php
use Illuminate\Database\Eloquent\Model;
use Illuminate\Database\Eloquent\Relations\HasMany;
final class Post extends Model
{
public function comments(): HasMany
{
return $this->hasMany(Comment::class);
}
// ...
}
// Comment.php
use Illuminate\Database\Eloquent\Model;
use Illuminate\Database\Eloquent\Relations\BelongsTo;
final class Comment extends Model
{
public function post(): BelongsTo
{
return $this->belongsTo(Post::class);
}
// ...
}
With Lift
// Post.php
use Illuminate\Database\Eloquent\Model;
use WendellAdriel\Lift\Attributes\Relations\HasMany;
use WendellAdriel\Lift\Lift;
#[HasMany(Comment::class)]
final class Post extends Model
{
use Lift;
// ...
}
// Comment.php
use Illuminate\Database\Eloquent\Model;
use WendellAdriel\Lift\Attributes\Relations\BelongsTo;
use WendellAdriel\Lift\Lift;
#[BelongsTo(Post::class)]
final class Comment extends Model
{
use Lift;
// ...
}
You can check all the available relationships attributes in the docs.
The relationships will work the same way as if you had defined them using methods.
Property Attributes
Cast Attribute
Lift provides a Cast attribute that you can use to define the cast of your model properties. Besides casting the values, it also allows you to type your properties.
Without Lift
use Illuminate\Database\Eloquent\Model;
final class Product extends Model
{
protected $casts = [
'id' => 'int',
'name' => 'string',
'price' => 'float',
'active' => 'boolean',
'expires_at' => 'immutable_datetime',
];
}
With Lift
use Carbon\CarbonImmutable;
use Illuminate\Database\Eloquent\Model;
use WendellAdriel\Lift\Attributes\Cast;
use WendellAdriel\Lift\Lift;
final class Product extends Model
{
use Lift;
#[Cast('int')]
public int $id;
#[Cast('string')]
public string $name;
#[Cast('float')]
public float $price;
#[Cast('boolean')]
public bool $active;
#[Cast('immutable_datetime')]
public CarbonImmutable $expires_at;
}
Column Attribute
Lift provides a Column attribute that you can use to customize the column name of your model properties and to define default values to them.
use Illuminate\Database\Eloquent\Model;
use WendellAdriel\Lift\Attributes\Cast;
use WendellAdriel\Lift\Attributes\Column;
use WendellAdriel\Lift\Lift;
final class Product extends Model
{
use Lift;
#[Cast('int')]
public int $id;
#[Cast('string')]
#[Column('product_name')]
public string $name;
#[Cast('float')]
#[Column(name: 'product_price', default: 0.0]
public float $price;
}
In the example above, the name property will be mapped to the product_name column, and the price property will be mapped to the product_price column, with a default value of 0.0.
You can even pass a function name to the default value, which will be called when the property is saved to the database.
use Illuminate\Database\Eloquent\Model;
use WendellAdriel\Lift\Attributes\Cast;
use WendellAdriel\Lift\Attributes\Column;
use WendellAdriel\Lift\Lift;
final class Product extends Model
{
use Lift;
#[Cast('int')]
public int $id;
#[Cast('string')]
#[Column('product_name')]
public string $name;
#[Cast('float')]
#[Column(name: 'product_price', default: 0.0]
public float $price;
#[Cast('float')]
#[Column(default: 'generatePromotionalPrice')]
public float $promotional_price;
public function generatePromotionalPrice(): float
{
return $this->price * 0.8;
}
}
Fillable Attribute
When using the Lift trait, all the attributes of your model are set to guarded. You can use the Fillable attribute to define which properties can be mass-assigned.
Without Lift
use Illuminate\Database\Eloquent\Model;
final class Product extends Model
{
protected $fillable = [
'name',
'price',
];
protected $casts = [
'id' => 'int',
'name' => 'string',
'price' => 'float',
];
}
With Lift
use Illuminate\Database\Eloquent\Model;
use WendellAdriel\Lift\Attributes\Cast;
use WendellAdriel\Lift\Attributes\Fillable;
use WendellAdriel\Lift\Lift;
final class Product extends Model
{
use Lift;
#[Cast('int')]
public int $id;
#[Fillable]
#[Cast('string')]
public string $name;
#[Fillable]
#[Cast('float')]
public float $price;
}
Hidden Attribute
Lift provides a Hidden attribute that you can use to hide properties from the model when it’s converted to an array or JSON.
Without Lift
use Illuminate\Database\Eloquent\Model;
final class Product extends Model
{
protected $fillable = [
'name',
'price',
'active',
];
protected $casts = [
'id' => 'int',
'name' => 'string',
'price' => 'float',
'active' => 'boolean',
];
protected $hidden = [
'active',
];
}
With Lift
use Illuminate\Database\Eloquent\Model;
use WendellAdriel\Lift\Attributes\Cast;
use WendellAdriel\Lift\Attributes\Fillable;
use WendellAdriel\Lift\Attributes\Hidden;
use WendellAdriel\Lift\Lift;
final class Product extends Model
{
use Lift;
#[Cast('int')]
public int $id;
#[Fillable]
#[Cast('string')]
public string $name;
#[Fillable]
#[Cast('float')]
public float $price;
#[Hidden]
#[Fillable]
#[Cast('boolean')]
public bool $active;
}
Immutable Attribute
Lift provides an Immutable attribute that you can use to make properties immutable. This means that once the model is created, the property can’t be changed. If you try to change it, an WendellAdriel\Lift\Exceptions\ImmutablePropertyException will be thrown.
use Illuminate\Database\Eloquent\Model;
use WendellAdriel\Lift\Attributes\Cast;
use WendellAdriel\Lift\Attributes\Fillable;
use WendellAdriel\Lift\Attributes\Immutable;
use WendellAdriel\Lift\Lift;
final class Product extends Model
{
use Lift;
#[Cast('int')]
public int $id;
#[Immutable]
#[Fillable]
#[Cast('string')]
public string $name;
}
$product = Product::query()->create([
'name' => 'Product 1',
]);
$product->name = 'Product 2';
$product->save(); // Throws an WendellAdriel\Lift\Exceptions\ImmutablePropertyException
PrimaryKey Attribute
Lift provides a PrimaryKey attribute that you can use to customize the primary key of your model.
Without Lift
use Illuminate\Database\Eloquent\Model;
final class Product extends Model
{
public $incrementing = false;
protected $primaryKey = 'uuid';
protected $keyType = 'string';
// ...
}
With Lift
use Illuminate\Database\Eloquent\Model;
use WendellAdriel\Lift\Attributes\Cast;
use WendellAdriel\Lift\Attributes\PrimaryKey;
use WendellAdriel\Lift\Lift;
final class Product extends Model
{
use Lift;
#[PrimaryKey(type: 'string', incrementing: false)]
#[Cast('string')]
public string $uuid;
// ...
}
Rules Attribute
Lift provides a Rules attribute that you can use to define validation rules for your model properties.
The validations can be set the same way you would do in a Laravel Form Request, and you can even set custom messages for each rule.
⚠️ The rules will be validated only when you save your model (create or update)
use Illuminate\Database\Eloquent\Model;
use WendellAdriel\Lift\Attributes\Cast;
use WendellAdriel\Lift\Attributes\Fillable;
use WendellAdriel\Lift\Attributes\Rules;
use WendellAdriel\Lift\Lift;
final class Product extends Model
{
use Lift;
#[Cast('int')]
public int $id;
#[Fillable]
#[Cast('string')]
#[Rules(['required', 'string', 'max:255'])]
public string $name;
#[Fillable]
#[Cast('float')]
#[Rules(['required', 'numeric', 'min:0.0'])]
public float $price;
#[Fillable]
#[Cast('boolean')]
#[Rules(rules: ['required', 'boolean'], messages: ['required' => 'You must set the active status for the product'])]
public bool $active;
}
Watch Attribute
By default, Eloquent already fires events when a model is created, updated, deleted, etc. But that’s a generic event, and sometimes, you need to fire a specific event when a property is changed. That’s where the Watch attribute comes in.
You can define a custom event that will be fired when a property changes. The event will receive as a parameter the updated model instance.
// Product.php
use Illuminate\Database\Eloquent\Model;
use WendellAdriel\Lift\Attributes\Cast;
use WendellAdriel\Lift\Attributes\Fillable;
use WendellAdriel\Lift\Attributes\Watch;
use WendellAdriel\Lift\Lift;
final class Product extends Model
{
use Lift;
#[Cast('int')]
public int $id;
#[Fillable]
#[Cast('string')]
public string $name;
#[Fillable]
#[Cast('float')]
#[Watch(PriceChangedEvent::class)]
public float $price;
#[Fillable]
#[Cast('boolean')]
public bool $active;
}
// PriceChangedEvent.php
final class PriceChangedEvent
{
use Dispatchable, InteractsWithSockets, SerializesModels;
public function __construct(
public Product $product,
) {
}
}
Methods
Besides all the Attributes the package provides, it also provides some methods you can use to get more information about your models.
customColumns()
It will return an array with all the custom columns you defined in your model.
use Illuminate\Database\Eloquent\Model;
use WendellAdriel\Lift\Attributes\Cast;
use WendellAdriel\Lift\Attributes\Column;
use WendellAdriel\Lift\Lift;
final class Product extends Model
{
use Lift;
#[Cast('int')]
public int $id;
#[Cast('string')]
#[Column('product_name')]
public string $name;
#[Cast('float')]
#[Column(name: 'product_price', default: 0.0]
public float $price;
}
Product::customColumns();
// WILL RETURN
[
'name' => 'product_name',
'price' => 'product_price',
]
defaultValues()
It will return an array with all the properties that have a default value defined. If the default value is a function, the function name will be returned instead of the function result since this is a static call.
use Illuminate\Database\Eloquent\Model;
use WendellAdriel\Lift\Attributes\Cast;
use WendellAdriel\Lift\Attributes\Column;
use WendellAdriel\Lift\Lift;
final class Product extends Model
{
use Lift;
#[Cast('int')]
public int $id;
#[Cast('string')]
#[Column('product_name')]
public string $name;
#[Cast('float')]
#[Column(name: 'product_price', default: 0.0]
public float $price;
#[Cast('float')]
#[Column(default: 'generatePromotionalPrice')]
public float $promotional_price;
public function generatePromotionalPrice(): float
{
return $this->price * 0.8;
}
}
Product::defaultValues();
// WILL RETURN
[
'price' => 0.0,
'promotional_price' => 'generatePromotionalPrice',
]
immutableProperties()
It will return an array with all the properties that are immutable.
use Illuminate\Database\Eloquent\Model;
use WendellAdriel\Lift\Attributes\Cast;
use WendellAdriel\Lift\Attributes\Fillable;
use WendellAdriel\Lift\Attributes\Immutable;
use WendellAdriel\Lift\Lift;
final class Product extends Model
{
use Lift;
#[Cast('int')]
public int $id;
#[Immutable]
#[Fillable]
#[Cast('string')]
public string $name;
}
Product::immutableProperties();
// WILL RETURN
[
'name',
]
validationMessages()
It will return an array with all the validation messages you defined in your model.
use Illuminate\Database\Eloquent\Model;
use WendellAdriel\Lift\Attributes\Cast;
use WendellAdriel\Lift\Attributes\Fillable;
use WendellAdriel\Lift\Attributes\Rules;
use WendellAdriel\Lift\Lift;
final class Product extends Model
{
use Lift;
#[Cast('int')]
public int $id;
#[Fillable]
#[Cast('string')]
#[Rules(['required', 'string', 'max:255'])]
public string $name;
#[Fillable]
#[Cast('float')]
#[Rules(['required', 'numeric', 'min:0.0'])]
public float $price;
#[Fillable]
#[Cast('boolean')]
#[Rules(rules: ['required', 'boolean'], messages: ['required' => 'You must set the active status for the product'])]
public bool $active;
}
Product::validationMessages();
// WILL RETURN
[
'name' => [],
'price' => [],
'active' => [
'required' => 'You must set the active status for the product',
],
]
validationRules()
It will return an array with all the validation rules you defined in your model.
use Illuminate\Database\Eloquent\Model;
use WendellAdriel\Lift\Attributes\Cast;
use WendellAdriel\Lift\Attributes\Fillable;
use WendellAdriel\Lift\Attributes\Rules;
use WendellAdriel\Lift\Lift;
final class Product extends Model
{
use Lift;
#[Cast('int')]
public int $id;
#[Fillable]
#[Cast('string')]
#[Rules(['required', 'string', 'max:255'])]
public string $name;
#[Fillable]
#[Cast('float')]
#[Rules(['required', 'numeric', 'min:0.0'])]
public float $price;
#[Fillable]
#[Cast('boolean')]
#[Rules(rules: ['required', 'boolean'], messages: ['required' => 'You must set the active status for the product'])]
public bool $active;
}
Product::validationRules();
// WILL RETURN
[
'name' => ['required', 'string', 'max:255'],
'price' => ['required', 'numeric', 'min:0.0'],
'active' => ['required', 'boolean'],
]
watchedProperties()
It will return an array with all the properties with a custom event defined.
use Illuminate\Database\Eloquent\Model;
use WendellAdriel\Lift\Attributes\Cast;
use WendellAdriel\Lift\Attributes\Fillable;
use WendellAdriel\Lift\Attributes\Watch;
use WendellAdriel\Lift\Lift;
final class Product extends Model
{
use Lift;
#[Cast('int')]
public int $id;
#[Fillable]
#[Cast('string')]
public string $name;
#[Fillable]
#[Cast('float')]
#[Watch(PriceChangedEvent::class)]
public float $price;
#[Fillable]
#[Cast('boolean')]
public bool $active;
}
Product::watchedProperties();
// WILL RETURN
[
'price' => PriceChangedEvent::class,
]
Conclusion
Lift is a package that brings some features of tools like Doctrine, Spring and Entity Framework to Eloquent.
It makes your models easier to read and understand and with a cleaner look by taking advantage of PHP 8’s attributes.
Laravel News
Backup and Recovery for Databases: What You Should Know
https://www.percona.com/blog/wp-content/uploads/2023/08/Backup-and-Recovery-for-Databases-150×150.png
People used to say, “Coal is king,” and for decades, it was. Coal powered just about everything, but mismanagement and a lack of stewardship left some messes.
These days, “Data is king,” and a lot more. Data powers everything, and unlike coal and coal combustion, data and databases aren’t going away. So staying with our analogy, and learning from historical lessons, organizations must be responsible stewards of data — for the sake of customers, stakeholders, and the business itself.
Any organization that uses personal and other sensitive data must have a firm, proven plan for business continuity in the event of a disaster or cyberattack. Losing access to or control of data for an extended period of time will disrupt operations, lead to financial losses, and damage an organization’s reputation. Recovering from a tarnished reputation can be costly and time-consuming.
Data stewardship also means protecting people’s privacy, safeguarding against breaches, and adhering to regulations and standards such as the European Union’s General Data Protection Regulation (GDPR), the United States’ Sarbanes-Oxley Act (SOX), and the Payment Card Industry Data Security Standard (PCI DSS).
In this blog, we’ll focus on the elements of database backup and disaster recovery, and we’ll introduce proven solutions for maintaining business continuity, even amid otherwise dire circumstances.
Why backup and recovery preparedness is so important
Such a royal introduction demands background, so let’s get after it: Any data loss or unexpected downtime hurts an organization. Some losses can be crippling, even a business death knell. So it’s important to know (and not overlook) the trouble spots. Some are hidden, but some are in plain sight. In general terms, here are potential trouble spots:
- Hardware failure: Manufacturing defects, wear and tear, physical damage, and other factors can cause hardware to fail. Power surges, outages, and harsh conditions (i.e., heat) can damage hardware components and prompt data loss.
- Software failure: Software applications can become vulnerable, or they can crash altogether. Without data backup mechanisms, there can be data loss or system downtime. Even worse, entire operating systems can crash, also resulting in data loss.
- Human mistakes: Incorrect configuration is an all-too-common cause of hardware and software failure. Similarly, accidental deletion is a culprit.
In all three instances, failure to regularly back up data can result in significant data loss in the event of a disaster. Solid backup procedures must be in place.
Backup types and strategies
It all begins with choosing a strategy, and that depends on factors such as the use and importance of data to your business, your recovery time objectives (RTO), and your budget. Depending on what is needed, here are some common database backup types, strategies, and considerations:
Full backup vs. incremental backup: Best suited for smaller databases or those that don’t incur a lot of changes, a full backup includes a complete restore point. Though it can put safety concerns at ease, a full backup can be time-consuming and expensive. An incremental backup, which is faster and requires less storage than a full backup, captures changes made since the previous backup. It’s suitable for databases with moderate change rates. (For a more detailed description, read Full vs. Incremental vs. Differential Backups: Comparing Backup Types.)
Hot backups vs. cold backups: A hot backup — used to minimize downtime and ensure data availability for critical applications — allows you to create a copy of a database while the system is still actively serving user requests and processing transactions. In a cold backup, the database is taken offline. This is advisable only in certain scenarios, such as maintenance during low-use hours.
Choosing the right backup frequency: The appropriate frequency, of course, will vary from one organization to another. If you can’t afford to lose much data, you’ll need more frequent backups, possibly even continuous data protection solutions. The rate at which data changes within your database is a significant factor as well. To incorporate the latest changes, databases with high write activity might require more frequent backups.
Offsite backup: This involves physically storing backups in a secure location somewhere other than the primary data center. It’s more expensive, but offsite backup protects against site-wide disasters.
With the right backup strategy, you’ll be better able to achieve the aforementioned business continuity. Still, disasters might happen, so let’s also examine recovery.
Disaster recovery strategies and testing
One might think disaster begets loss, but with the right planning, that loss can be so minimal it’s more “blip” than “bad.” With that planning in place, you can look at it this way instead: Backup begets disaster recovery.
Disaster recovery (DR) strategies are essential to ensuring the integrity, availability, and reliability of data, particularly in the event of unexpected failures or errors. Such strategies help restore a database to a consistent and usable state. A disaster recovery plan can be as simple as the use of a backup and recovery procedure, or it can be complex, depending on the RTO and the recovery point objective (RPO). Key elements of comprehensive database recovery plans include point-in-time recovery, high availability and failover, replication, and others (we’ll break them down in a bit).
Whatever plan you arrive at, you must test it. There should be no shortcuts in the testing, which should include:
- Backup testing: Test to ensure that data can indeed be recovered from backups. This includes both data and log backups.
- Failover testing: If you have a high availability setup or a secondary data center, test to ensure the failover process switches over to the backup database server.
- Application testing: Test to make sure applications function correctly after recovery.
- Data consistency: Verify that data consistency between the primary and secondary systems will exist after recovery.
- Application testing: Test to make sure applications function correctly after recovery.
Backup and recovery tools
Now that we’ve covered some strategies, it’s a good time to look at some tools for putting plans in motion. There’s too much out there to provide a comprehensive list, so we’ll mention just a few high-profile options. These obviously are not detailed descriptions; they’re just introductions:
MySQL Enterprise Backup: This software supports hot backups and incremental backups.
Oracle Recovery Manager (RMAN): This enables users of Oracle databases to perform full, incremental, and differential backups. This tool also provides point-in-time recovery.
SQL Server Management Studio: This software includes backup and recovery tools for use with Microsoft SQL Server.
MongoDB Atlas backup: This hosted cloud service offers continuous backups or snapshots for point-in-time recovery, as well as incremental backups.
MongoDB Cloud Manager: This hosted service, which uses a graphical user interface, supports backup and restoration of replica sets and sharded clusters.
MongoDB Ops Manager: Available with Enterprise Advanced subscriptions, this is an on-premise tool that provides backup software and features much like those of Cloud Manager.
IBM Data Studio: This provides graphics-based and command-line tools for backup and recovery within IBM Db2 databases.
Commvault: This data management and protection software includes features for backup and recovery. It’s used to help ensure the functionality of hardware, software, and applications.
All of the options above have enterprise-grade attributes, but not one of them is truly open source. So let’s discuss some options that are open source.
Open source Percona solutions for backup and disaster recovery
When you read reviews of what’s out there for backup and disaster recovery solutions, you tend to see glowing words about software with big-name recognition. But you don’t see a warning that the software is proprietary (most often, it is); you just see hints, like a “starting price.” And you certainly don’t see a warning that vendor lock-in might be lurking.
Amid the options, you see Percona at or near the top of lists and reviews. But with Percona, there are differences. There’s no hint of proprietary lock-in because it doesn’t exist. The software is truly open source. Percona solutions, fully supported and enterprise-grade, include:
Percona Backup for MongoDB: Percona Backup for MongoDB is a distributed and low-impact solution for consistent backups of MongoDB clusters, including sharding support. It enables you to make logical, physical, incremental, and selective backups and restores. Plus, point-in-time recovery functionality allows you to recover your database to a specific timestamp.
Percona XtraBackup: This is a free, complete online backup solution for all versions of Percona Server for MySQL, MySQL, and MariaDB. Percona XtraBackup performs online non-blocking, tightly compressed, highly secure backups on transactional systems. Percona XtraBackup is the world’s only open source, free MySQL hot backup software that performs non-blocking backups for InnoDB and XtraDB databases.
Percona Distribution for PostgreSQL: This production-ready PostgreSQL distribution includes pgBackRest, an open source backup and restore solution that enables full backup, incremental backup, and differential backup in PostgreSQL databases. The toolset also supports high availability and disaster recovery via Patroni, pg_bouncer, and HA proxy.
Essential elements of database backup and recovery
Now, let’s introduce a couple elements of an ideal backup and recovery solution. (There are more coming in the next section, but these two are big, huge in fact.)
Database replication
Data redundancy is a cornerstone of disaster recovery strategy, and to achieve it, you must have replication mechanisms in place. Depending on the use case, that can mean synchronous replication or asynchronous replication.
In synchronous replication, data is written to the primary database. The data then is copied to one or more replica databases. The primary database waits for acknowledgment from the replica(s) before advancing the transaction to the application. This means that the data in the primary and replica databases is always in sync. (View a Percona whitepaper that shows synchronous replication in action.)
In asynchronous replication, data is written to the primary database, but the acknowledgment to the application occurs before the data is replicated to secondary databases. This results in a delay between the time data is written to the primary and when it appears in the replica(s). Real-time data consistency is not guaranteed.
Point-in-time recovery
With point-in-time recovery, a database is restored to a specific moment in time rather than the time of the most recent backup. PITR is especially essential in situations when data integrity and consistency cannot be compromised. Financial systems and critical business applications are especially dependent on PITR. In addition to protecting data accuracy and limiting data loss, PITR can help with auditing and compliance requirements by providing a record of changes to the database.
Common components of DR and HA architectures
By definition, there are differences between high availability (HA) and disaster recovery (DR). High availability is focused on preventing downtime and ensuring that the database remains available; disaster recovery is focused on recovering from a catastrophic event and minimizing negative effects on the business. High availability typically involves redundant hardware, software, applications, and network components that can quickly take over if the primary component fails; disaster recovery typically involves regular backups, replication to a secondary site, and a clear recovery plan with steps to be taken in the event of a disaster.
Although the emphasis and configurations may vary depending on whether the focus is on high availability or disaster recovery, there are shared components. Some of them include:
- Redundant hardware: Both HA and DR use redundant hardware components, including servers and storage devices. Redundancy ensures that if one component fails, there is another to take its place. This helps minimize downtime.
- Clustering: In HA, clustering helps ensure that there are redundant database servers; if one fails, another can take over. This minimizes downtime during disasters or hardware failures. For disaster recovery, clustering can be used to maintain a synchronized copy of the database in a different location. Database replication, log shipping, or synchronous data mirroring can be used for DR purposes.
- Load balancing: Load balancers distribute traffic evenly across multiple servers or data centers. In HA, load balancers help ensure that no single server is overwhelmed. In DR, load balancers route traffic to the secondary data center when a failover occurs.
- Backup systems: Both HA and DR architectures have backup systems in place. HA setups tend to use backup servers within the same data center. DR setups have backup data centers in different locations.
- Monitoring and alerting: Continuous monitoring of system health and performance is essential for both HA and DR. Automated alerts are set up to notify administrators of any issues that require attention.
What’s at stake and what to do about it
Now that we’ve taken a deeper dive into the components of a backup and disaster recovery solution, as well as a look at high availability, let’s expand on what backup and disaster recovery solutions are used for. We’ll also talk about what can happen if you don’t have a solid plan in place, if you take shortcuts, or if you turn it all over to the wrong vendor.
Data archiving and retention matter
We’ve discussed the essential nature of backup and recovery in business continuity. Relatedly, by separating historical data from operational data, archiving helps you manage data growth, maintain compliance, and optimize backup processes. Likewise, establishing clear retention policies for both backups and archives is crucial to balancing data recovery needs with data management efficiency and compliance requirements.
And the essential nature of compliance can’t be emphasized enough. Failure to adhere to legal requirements can result in monetary and even criminal penalties, reputational damage, and loss of data integrity. Here are some of those regulations:
General Data Protection Regulation (GDPR): In addition to stipulating that organizations must have a lawful basis for processing personal data, this regulation includes guidelines for data retention and erasure policies.
Sarbanes-Oxley Act: SOX, a U.S. federal law, requires companies to have database disaster recovery and business continuity plans in place. The purpose is to ensure the availability and integrity of financial data amid unexpected events.
Payment Card Industry Data Security Standard: The PCI DSS mandates that organizations must regularly back up data, including critical payment card data, so that data availability and integrity are maintained. The PCI DSS also prescribes steps for responding to data breaches and other security incidents, including how to restore services and data after a disaster.
California Consumer Privacy Act: Similar to GDPR, CCPA also includes mandates concerning data retention and erasure policies.
Regional regulations: Depending on your location and who your customers are, your organization might have to adhere to privacy, archiving, and retention mandates as spelled out in HIPAA (healthcare), FERPA (education), PIPEDA (Canada), and other regulations.
Examining cloud-based backup solutions
Benefits related to accessibility, automation, scalability, and security might inspire you to go with a cloud service for database backup and disaster recovery. If this is the direction you choose, carefully consider the long-term costs, data security concerns, and potential vendor lock-in. Find a partner that will answer any questions about such concerns — and be as certain as possible that vendor lock-in is not on the horizon.
While cloud services can be cost-effective initially, long-term costs can escalate if your needs for data storage grow significantly. Relatedly, transferring large amounts of data into or out of the cloud can be expensive, especially for companies with limited bandwidth. Further, there are data compliance and security concerns that could matter a lot more to you than to the vendor. Whereas the vendor might make promises, the responsibility and potential repercussions are all on you.
Safe and reliable cloud services exist, but read the fine print and ask those questions.
Never scrimp on security measures
Here are some of the best practices for helping ensure that data remains secure during backup and recovery:
- Encryption (which also could have appeared in the Essential Elements section) is a must-have component of database backup and recovery strategies. Using algorithms and keys to make data unreadable, encryption helps safeguard information during backup and recovery. Even if backup files fall into the wrong hands, you’re safe. Encryption also helps you adhere to strict data-protection regulations (GDPR, Sarbanes-Oxley Act, PCI DSS, CCPA, HIPAA, etc.).
- Access control is the process of managing who can access a database and what actions they can perform. In backup and recovery, access control helps prevent unauthorized access to sensitive backup files and database recovery mechanisms.
- Backup authorization and recovery authorization are the processes of determining whether a user or process has the permissions to perform a specific action. Authorization helps ensure that only authorized entities can initiate backup and recovery operations.
Be proactive — set up monitoring and alerting
The coal miners of yesteryear carried caged canaries deep into mine tunnels. If carbon monoxide or other dangerous gasses were present, the gasses would kill the canary, signaling the miners to leave the tunnels immediately.
Thankfully, with database backup and disaster recovery, watching for warning signs can be a lot more scientific — and foolproof. Instead of relying on a wing and prayer, an effective monitoring and alerting solution can rely on:
Thresholds: Thresholds for various metrics, such as backup completion time, replication lag, and resource availability, are defined. When those thresholds are reached, alerts are triggered.
Notification channels for real-time alerts: With the proper configuration, the appropriate personnel are contacted promptly via automated email, text, chat, and other channels when the previously mentioned thresholds are hit. Such notification should include an escalation process in which a different support avenue or person is contacted if the alert is not acknowledged or resolved within a predetermined amount of time.
Automated storage increase: There should be automation — tied into the alerts — in which storage space is increased when it reaches a predefined threshold. This will help prevent backup failures.
Detailed logs: It’s important to maintain logs of all monitoring activities and alerts. Then, you have the information to generate reports for identifying trends and areas of improvement.
With the right monitoring system in place, you can avoid losses. You also can spot critical performance issues faster, understand the root cause of incidents better, and troubleshoot them more efficiently moving forward.
Recovering from different scenarios
In database backup and disaster recovery planning, clear steps for dealing with hardware failure must be in place. Those steps should include:
- Identification: The first step in recovering from a hardware failure is identifying the affected hardware component. This could be a hard drive, a server, or even an entire data center. Monitoring tools and systems can help detect such failures and trigger automated alerts described in the previous section.
- Isolation and remediation: Once the failure is identified, IT staff or automated systems should work to isolate the affected hardware and restore it to a functional state as soon as possible. This may involve taking a server offline, rerouting network traffic, or replacing a failed disk drive.
- Restoration: With the hardware issue resolved, the next step is to restore the database services. This involves restarting database servers, restoring network connections, and ensuring that the database management system is operational. The previously mentioned automated failover mechanisms and load balancers can help minimize downtime during this phase.
- Recovery of data from backups: This might be a full backup or a combination of full and incremental backups. Use backup software to restore the database to its clean state at the time of the last good backup. This might involve copying data from backup storage to the production database server.
Perhaps we should call this the All Things Ominous Section because now we’ll look at restoring data after a cyberattack. (Of course, the dead canary was pretty dark.)
But really, this section is about bouncing back. With the right preparedness, a cyberattack doesn’t have to be that death knell to your database system and business. In fact, you can beat down an incursion and come back stronger. So let’s look at planning, preparedness, and a systematic approach to minimizing downtime and data loss while ensuring the security and integrity of your systems and information. Here are key steps in overcoming a cyberattack:
Preparation: Conduct regular backups that ensure you have recent, clean copies of your data to restore. Keep backup copies in offsite or isolated locations, perhaps in the cloud. This safeguards data from physical damage or compromise in the event of an attack.
Documentation: Maintain thorough documentation of your database configurations, schemas, and data structures. This documentation will be invaluable during the restoration process.
Response plan: Develop a clear incident response plan that outlines roles, responsibilities, and steps to take in the event of a cyberattack.
Detection and isolation: As soon as you detect an attack, quickly identify the scope and nature. Determine which databases or systems are affected. Then, quarantine or disconnect affected systems from the network to prevent the spread of malware and further data corruption.
Damage assessment: Evaluate the extent of data loss or corruption. This assessment will help determine the appropriate restoration strategy.
Culprit identification: So that you can patch vulnerabilities and prevent future attacks, determine how the attack happened.
Data restoration: Use your latest clean backup to restore the affected database. Ensure the backup is from a time before the attack occurred. In some cases in which the attack had compromised data, you might have to perform incremental restoration. This involves applying incremental backups to bring the data up to standards.
Security updates and auditing: Immediately patch and update the database system and associated software to address vulnerabilities that were exploited.To prevent future attacks, implement intrusion detection systems (IDS) and access controls.
Data consistency and integrity
You must maintain data accuracy before, during, and after a disaster or attack. By doing so, your organization can recover quickly and reliably. In addition to replication, monitoring and alerts, encryption, auditing, and other activities already mentioned, here are some other best practices for maintaining data accuracy and addressing data corruption:
- Perform regular backup testing, full and incremental, to verify data integrity.
- Perform automated backup verification to check the integrity of backup files and ensure they are not corrupted.
- Implement version control for database backups, which will give you a history of changes and let you choose a specific point-in-time if necessary.
- Always apply the latest security patches and updates to your database management system and backup software to prevent vulnerabilities.
- Use IDS and security information and event management (SIEM) tools to monitor network activity and detect suspicious activity.
- Develop and regularly update a comprehensive disaster recovery plan that outlines roles, responsibilities, and procedures for data recovery in various scenarios.
- Consider having outside experts assess your data protection and recovery plans and provide recommendations for improvement.
Scaling backup and recovery processes
Massive amounts of data can reside in large and enterprise databases. Though it might seem obvious, it’s important that you aren’t caught off-guard, and that means having significant storage capacity and efficient data transfer mechanisms.
Enterprises also typically require frequent backups, ranging from daily to hourly, depending on their RPOs. Automated backup processes are essential in ensuring data consistency and minimizing downtime. Techniques like online backups and snapshot-based backups can help ensure databases remain accessible during the backup process.
Relatedly, transferring large database backups over the network can strain available bandwidth. So, enterprises might need dedicated high-speed connections or WAN optimization solutions to mitigate network congestion during backup operations. To reduce storage and bandwidth requirements, compression and deduplication techniques are often applied to the backup data. This involves identifying redundant data and storing only the unique blocks.
Planning for business continuity
In real estate, they say “location, location, location.” In database management, we say: Proactivity. Proactivity. Proactivity. (OK, not so catchy and maybe we don’t say it in those words, but we think it.) And here, we’ll say it a fourth time in relation to protecting data and avoiding downtime: Proactivity.
Any business or organization that relies on data (meaning just about all of them) must be proactive if they’re to maintain business continuity amid a disaster, power outage, cyberattack, or other event that could threaten data processes.
We covered a lot about components, tools, and best technical practices, so here we’ll key in on the actual planning parts that should be included in a business continuity plan. Since replication and redundancy are such big elements of database management, let’s stick with the redundancy theme and call these proactive activities:
Risk assessment: Identify potential risks and threats that could negatively affect your database systems. They might include natural disasters (hurricanes, tornadoes, earthquakes, flooding, blizzards, etc.), cyberattacks (data breaches, malicious bugs, ransomware, etc.), human error, and hardware failure.
Impact assessment: Evaluate how each identified risk or threat could negatively affect your database systems.
Recovery objectives: To determine how quickly your organization must recover its database systems after a disruption (maximum allowable downtime), you should establish an RTO. To determine the maximum amount of data loss that your organization can tolerate, you should set an RPO. This will determine how frequently you should back up your data.
Disaster recovery plan (DRP): All the components in this section are part of the DRP, which outlines the steps to be taken in the event of a disaster or cyberattack. The DRP should include roles and responsibilities, communication procedures, and recovery procedures. You should test the DRP regularly through simulations to ensure it works effectively.
Communication plan: Develop a communication plan for keeping employees, customers, and stakeholders informed during a disaster or cyberattack.
Financial plan: Allocate budget resources for disaster recovery and business continuity initiatives to ensure they are adequately funded.
Additional tools and outside expertise: A business continuity plan isn’t something you just throw together. You might not have the tools and expertise on-staff to get it done. Consider ready-to-go backup software and whether or not you can design, implement, and maintain the business continuity plan on your own. If not, consider outside help, but beware of proprietary licensing and the pitfalls of vendor lock-in.
Keep learning
Now that you’ve got the basics down, level up your knowledge with our on-demand presentation: The Many Ways To Copy Your Database. In it, Nicolai Plum of Booking.com discusses the best ways to copy your database – from logical data dump and file copying through native cloning and backup tools to advanced scale-out techniques.
Watch The Many Ways To Copy Your Database
Percona Database Performance Blog
Coldest Limitless Water Bottle
https://theawesomer.com/photos/2023/08/coldest_limitless_water_bottles_t.jpg

| Buy
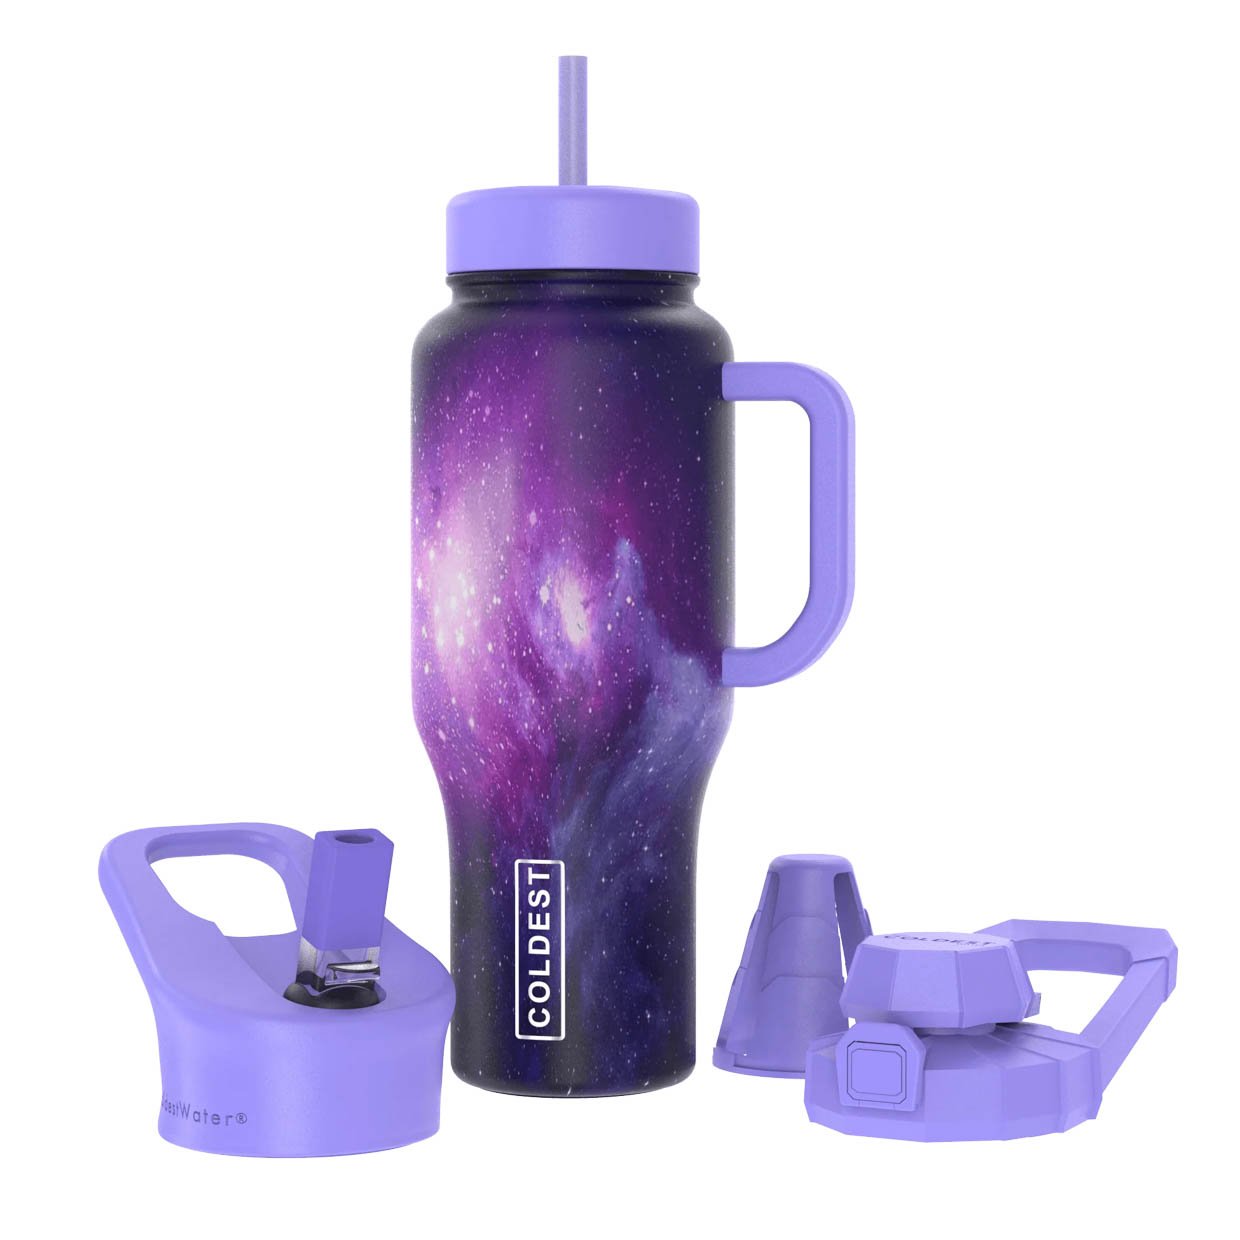
Coldest’s triple-insulated water bottle keeps beverages cold for up to 36 hours or hot for up to 13 hours. It holds up to 36 oz., has a built-in handle, and comes with three interchangeable tops: a sip straw lid, a flip-top drinking lid, and a blend-and-chug lid for supplements. It comes in a variety of color schemes – our fave is the Astro Purple design.
The Awesomer
Storing Form Data in a Laravel Database: Step-by-Step Guide
https://laracoding.com/wp-content/uploads/2023/08/storing-form-data-in-a-laravel-database-step-by-step-guide_536.png
When developing web applications with Laravel, a common task is to store form data in a database. In this tutorial, we will guide you through the process of capturing user input from a Laravel form and storing it in a database using Laravel’s powerful ORM, Eloquent.
Step 1: Setting Up the Database
Before diving into form submission, ensure that you have a database connection configured correctly in your Laravel application. Open the .env file and verify the database credentials (e.g., DB_CONNECTION, DB_HOST, DB_PORT, DB_DATABASE, DB_USERNAME, DB_PASSWORD). If needed, make any necessary adjustments to match your database configuration. The.env file should look similar to the one below.
APP_NAME=Laravel
APP_ENV=local
APP_KEY=base64:PZNdti8R6gIx0XGfXZpUA9gX4uiHyboi+DrozytCEwY=
APP_DEBUG=true
APP_URL=http://your-domain.test

LOG_CHANNEL=stack
LOG_DEPRECATIONS_CHANNEL=null
LOG_LEVEL=debug

DB_CONNECTION=mysql
DB_HOST=127.0.0.1
DB_PORT=3306
DB_DATABASE=your-database
DB_USERNAME=root
DB_PASSWORD=mrsid
Step 2: Creating a Migration
We will now create a migration that will contain the definition of the structure of our database table. Run the following command to instruct Laravel to generate it:
php artisan make:migration create_user_comments_table
Laravel has now added a basic migration file to the folder database\migrations, which we can edit to suit our requirements.
Step 3: Editing the Migration
Now open the newly generated migration file and define the table schema within the up method. Here you can specify the columns you need to store your form data. In our example, we’ll make a form with fields like name, email, and message, so our migration file might look like this:
<?php

use Illuminate\Database\Migrations\Migration;
use Illuminate\Database\Schema\Blueprint;
use Illuminate\Support\Facades\Schema;

return new class extends Migration
{
    /**
     * Run the migrations.
     */
    public function up(): void
    {
        Schema::create('user_comments', function (Blueprint $table) {
            $table->id();
            $table->string('name');
            $table->string('email');
            $table->text('message');
            $table->timestamps();
        });
    }

    /**
     * Reverse the migrations.
     */
    public function down(): void
    {
        Schema::dropIfExists('user_comments');
    }
};
Step 4: Running the Migration
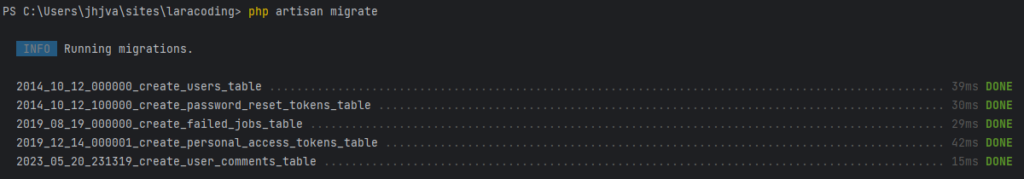
To create the table in the database, run the migration using the following command:
This command will execute all pending migrations in order of creation date. In the example shown you can see Laravel first runs its 4 default migrations and then runs our newly added migration which creates the table user_comments:
Step 5: Creating a Model
Next, run the following command to create a model UserComment that represents the table you just created:
php artisan make:model UserComment
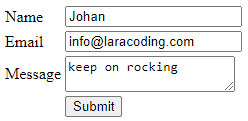
Step 6: Creating Form in Blade
Now create a blade file in your /resources/views folder and copy and paste the code below to add the HTML code of the form.
<form action="" method="post">
    @csrf
    <table>
        <tr>
            <td>Name</td>
            <td><input type="text" name="name" value=""></td>
        </tr>
        <tr>
            <td>Email</td>
            <td><input type="text" name="email" value=""></td>
        </tr>
        <tr>
            <td>Message</td>
            <td><textarea name="message"></textarea></td>
        </tr>
        <tr>
            <td></td>
            <td>
                <input type="submit" />
            </td>
        </tr>
    </table>
</form>
Note that we used a named route: “comment.store”, we’ll define this later in our routes/web.php
Step 7: Creating a Controller
Next, run the following artisan command to make a controller named CommentController:
php artisan make:controller CommentController
Step 8: Creating the Routes
Now we will add 2 routes. We will name the first route “comment.index”, this will display our page containing the form. The other route will be named “comment.store”, this will receive the form and store it in the database.
Open your web.php file and add the following code:
Route::get('/comment', [App\Http\Controllers\CommentController::class, 'index'])->name('comment.index');
Route::post('/comment', [App\Http\Controllers\CommentController::class, 'store'])->name('comment.store');
This will indicate that Laravel should:
- expect a GET to URL “
/comment"and needs to call the function “index” in CommentController - expect a POST to URL “
/comment"and needs to call the function “store” in CommentController
Step 9: Showing the Form
Now edit the CommentController and add a function called index by pasting the code below:
<?php
namespace App\Http\Controllers;
use Illuminate\Http\Request;
class CommentController extends Controller
{
public function index()
{
return view('comment');
}
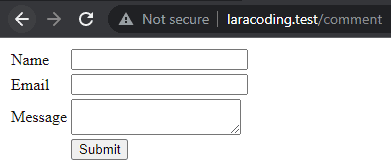
}You should now be able to see the comment form when you open your browser:
Step 10: Processing Form Data
We will now make changes to our CommentController by adding a store() function to handle the (post) form submission defined in our web.php route file. Within this function, we will create a new instance of the UserComment model and assign the input values from the form to the respective model attributes: name, email, and message.
Note that we have also added some validation rules which Laravel will check. This way we can ensure that the entered form fields contain the expected data.
<?php
namespace App\Http\Controllers;
use App\Models\UserComment;
use Illuminate\Http\Request;
class CommentController extends Controller
{
public function index()
{
return view('comment');
}
public function store(Request $request)
{
$request->validate([
'name' => 'required|max:32',
'email' => 'required|email',
'message' => 'required|string|required|max:255'
]);
$userComment = new UserComment();
$userComment->name = $request->input('name');
$userComment->email = $request->input('email');
$userComment->message = $request->input('message');
$userComment->save();
// Additional logic or redirection after successful data storage
return redirect()->back()->with('success', 'Comment stored successfully!');
}
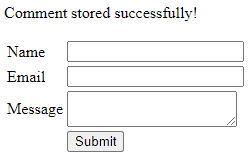
}Step 11: Displaying Feedback to the User
To ensure proper user feedback in cases of incomplete or invalid input, as well as after successfully storing the data, it’s important to provide informative messages.
When redirecting back to the form page, we can use the ->with() function to set a success message. Additionally, if there are any validation errors, Laravel will populate an $errors variable with the corresponding error messages.
To ensure that both the success message and validation errors are displayed when applicable, we need to include the following code snippet just above the comment form in your view file:
@if(session()->has('success'))
<p>
</p>
@endif
@if ($errors->any())
<ul>
@foreach ($errors->all() as $error)
<li></li>
@endforeach
</ul>
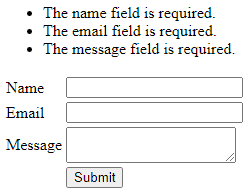
@endifNow, when attempting to save the form with missing or invalid inputs, we will encounter validation errors:
However, if we fill in valid values and resubmit the form, the input will be successfully saved:
After saving the form, the browser will automatically redirect back to the form page and display a success message:
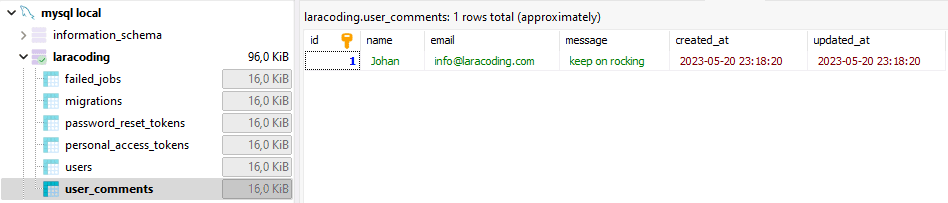
Now, if you view the database you can see the data has been stored correctly. You might use a tool like phpMyAdmin, or my personal favorite the free MySQL tool: HeidiSQL which will show:
Further reading
We can further improve and shorten our Controller code by using the following steps:
- Moving the validation rules into a Form Request Class
- Enable Mass Assign of values on the properties in the Model UserComment (name, email, message)
- Call Eloquent create method and mass assign the values of all validated fields.
public function store(UserCommentStoreRequest $request)
{
    UserComment::create($request->validated());
    return redirect()->back()->with('success', 'Comment stored successfully!');
}
To learn exactly how to apply Mass Assignment and a Form Request to achieve this read our detailed guide: Why Use Laravel Form Request and How? (BIG Code improvement)
Conclusion
In this tutorial, we explored the step-by-step process of storing form data in a Laravel database using Laravel’s ORM, Eloquent. We covered essential steps such as setting up the database connection, creating a migration to define the table structure, running the migration to create the table, creating a model to represent the table, creating a form in Blade, creating a controller to handle form submission, defining routes for the form, processing the form data, and providing user feedback in the form of success messages or validation error messages.
By following these steps, you now have a solid understanding of how to capture user input from a Laravel form and store it in a database efficiently and securely.
Laravel News Links
Tucker Carlson’s speech on the urban vs. rural divide in American politics is a must watch
https://www.louderwithcrowder.com/media-library/image.png?id=35360983&width=980
VOTE IN THE LWC 2024 GOP STRAW POLL! CLICK HERE!
Tucker Carlson is spending a portion of his summer vacation in Hungary, where he gave a speech. The corporate media is focusing on him "apologizing on behalf of the United States" over Ambassador David Pressman criticizing the country’s anti-LGBTQ illustration. But what we got instead is a near-perfect explainer of the urban vs. rural divide in American politics.
Grab a cup of coffee. This speech is well worth the next five minutes.
"The ruling party is the party of the childless, the unmarried, the people working for low wages for large corporations and living in tiny apartments in overcrowded cities that are rife with crime."
"Who votes for the people who run the United States right now? People who are working for big banks, living in crowded conditions, very often alone, in big soulless cities, having their food delivered by immigrants, and spending their time glued to a screen. What does that sound like to you? It sounds like prison, actually."
"Who are the people who oppose this? Where do they live and how do they live? Well, they are poorer generally on paper. But are their lives worse if you live in a place where you can see the sky? Where you can make your own food? If you can go outside and identify three species of trees or hear birds, or experience silence, the rarest commodity in the modern world. Those are the people who are not with the program. People who have a daily experience of nature. And those people are much more likely to acknowledge a power beyond themselves and their government."
"And there’s a reason for that because they can see it. When you’re living crowded as you would on an industrial farm as a cow, you are not liberated. You are enslaved. Your reference points are gone. You can’t see the stars. You cannot see God’s creation. All around you you see drywall and screens. And your ability to think clearly goes away."
><><><><><><
Brodigan is Grand Poobah of this here website and when he isn’t writing words about things enjoys day drinking, pro-wrestling, and country music. You can find him on the Twitter too.
Facebook doesn’t want you reading this post or any others lately. Their algorithm hides our stories and shenanigans as best it can. The best way to stick it to Zuckerface? Sign up for our DAILY EMAIL BLASTS! They can’t stop us from delivering our content straight to your inbox. Yet.
Louder With Crowder
The Top 20 Websites to Access Free Data for Practice
https://static1.makeuseofimages.com/wordpress/wp-content/uploads/2023/07/untitled-design-2-4.jpg
Whether you’re conducting market research, building your portfolio as an analyst, or seeking insights to expand your market reach, valuable and reliable data is essential for informed decision-making.
However, searching the internet for free, reliable, and accessible data has some challenges. This article will make your data-hunting quest less challenging by introducing you to some of the top websites to access free data.
Google Trends is a free service developed by Google that provides users with unfiltered data samples of search requests made to Google. While this service displays time series data from 2004 to the present at both global and city-level scales, it doesn’t show the personal details of the search engine users.
You can also restrict the data to focus on categories, languages, entities, or trending searches on Google with Google Trends. Examples of available data include daily search trends and real-time search trends, which show data for the past seven days.
FiveThirtyEight is a data journalism website that has data about poll analysis, sports, pop culture, politics, science, and economic happenings.
The great thing about the website is that you can download the data from their website or their official GitHub repository and use your data visualization tools to create captivating data journalism visuals for your audience. A few examples of interesting data available include the world cup predictions and 2022-23 NHL predictions data.
BuzzFeed News is an American breaking news and original reporting platform that reports everything from journalism, tech, entertainment, celebrity news, culture, and DIY hacks to health and politics.
On its GitHub, BuzzFeed News makes its dataset, tools, and analysis from BuzzFeed’s newsroom open-source, accessible, and available. An example includes the FBI NICS firearm background check data.
Data.gov is the United States government’s open data website that hosts over 250,000 publicly available, well-documented datasets from international and multiple federal government agencies. The idea behind this initiative was to provide an open and transparent government.
You can access data from the website based on topic and agency or organization. Some examples of data you can find on Data.gov is the national student loan data system and electric vehicle population data.
Kaggle is a public data playground acquired by Google that offers a wide range of datasets on various topics. This community platform allows you to share your codes, learn, collaborate with fellow data professionals, and skill up. Kaggle also hosts data science competitions where you can win various prizes.
This guide provides a beginner’s guide on how to get started with Kaggle for data science. An example is the Global YouTube Statistics 2023.
EarthData is a data initiative by NASA serving as a repository of earth data from 1994 to now. You can get data related from the remote satellite information to data about the Earth’s atmosphere, ocean, and Terrestrial Hydrosphere.
You can browse various topics and access data like extreme heat data. However, you will have to explore NASA’s planetary data system for non-earth data.
IMDb provides data about movies, TV series, home videos, podcasts, video games, streaming information, and celebrity content. An example is IMDb non-commercial datasets.
AWS Public Dataset is a website that hosts over 3000 data sets of datasets made publicly available through AWS services. Most of the datasets here are project-based. A few include the cancer genome atlas and Foldingathome COVID-19 Datasets.
Inside Airbnb is a watchdog website launched by Murray Cox. This website sources data publicly available from Airbnb, a platform that offers users budget-friendly rooms worldwide. You can use information from this site to carry out analytics like the rental analytics of Montreal.
Google Dataset Search is a dataset search engine created by Google that hosts over 20 million datasets. Like their search engine, you can get data from almost anything. A good example is the Canadian national long-term water quality monitoring data.
UC Irvine Machine Learning Repository is the home of 624 datasets for the machine learning community in the world. This website has a strong reputation in the community because the datasets are categorized based on the machine learning tasks they are suited for. An example is the Iris dataset, a famous classification and clustering model dataset.
Datahub as a platform has many datasets that cover a wide range of topics like the 10-year US Government Bond Yields (long-term interest rate). Besides the data, they also display data tools and toolkits that can come in for data professionals.
This is the first website on our list for exclusive health data. The Global Health Observatory serves as a data repository displaying health-related statistics for over 1000 indicators for the WHO’s 194 member states. The data are recorded to monitor these member states’ progress toward SDG goals. You can get data by filtering the theme, category, metadata, and indicator of the data.
This platform is really niche based. It shows research data and market intelligence information like the weekend box office figures and related data on the UK film industry.
GitHub is more than just the home of millions of collaborative and open-source projects. The platform also hosts many repositories that aim to hold free, public, and open-source datasets. Even BuzzFeedNews has an open-source GitHub repository.
Other examples are the Awesome Public Datasets repository and do you even lift the dataset. You can also contribute to these open-source projects on GitHub.
Data.world is a data community and collaborative platform that hosts data projects and datasets. While a few datasets are paid, majorly of the data on the platform, like Makeover Monday’s 2021/W16: monthly air passengers in America, are free and can be easily downloaded locally or accessed via their API.
World Bank Open Data is a catalog of global economic and development data. You can browse and filter the data, like the global statistics on the cost and affordability of healthy diets by indicator and country.
Nasdaq Data Link is for everything financial, economic, and alternative data. You can access data like the US federal reserve data releases via a spreadsheet like Excel or an API.
NYC Taxi and Limousine Commission data platform records and hosts information such as yellow and green taxi trip records across New York City. The great thing about this website is that it shows information about everything, from the pick-up/drop-off to the taxicab zone and trip fares.
Academic Torrents is a data catalog of over 127.15 TB of research data. It was built, as they say, for researchers and by researchers.
Explore and Learn
Hopefully, with this list, you can get data that can shape your business landscape, drive your market research, gain a competitive edge, and help you build that unique data portfolio free of charge. So embrace the opportunities, explore, and have a less challenging data-hunting quest.
MakeUseOf