Laravel News Links
Laravel Query & Database Optimization Tips Eager Loading, Indexing, and Avoiding N+1 Queries
Laravel News Links
Laravel .env.example – The Definitive Guide
Laravel News Links
Best MacBook Pro Cyber Monday deals start at just $1,299, save up to $500
https://photos5.appleinsider.com/gallery/65925-138164-macbook-pro-cyber-monday-deals-xl.jpgSteeper price cuts have hit Apple’s MacBook Pro range, with 16-inch models starting at $2,099 and 14-inch configs as low as $1,299.

Better-than-Black Friday pricing hits MacBook Pros for Cyber Monday.
Amazon and B&H Photo have each slashed prices on Apple’s line of MacBook Pro laptops, with B&H stocking both retail and configure-to-order (CTO) models.
The 16-inch range, in particular, has better-than-Black Friday pricing on several configurations, and the new M5 14-inch MacBook Pro is on sale for $1,349 for the holidays. You can also get an M4 Pro 14-inch for $1,599 ($300 off).
Continue Reading on AppleInsider | Discuss on our ForumsAppleInsider News
I never expected an open-source app to beat IFTTT and Zapier — but this one did
https://static0.makeuseofimages.com/wordpress/wp-content/uploads/wm/2025/11/a-macbook-on-a-table-showing-the-huginn-automation-app.jpg
I’ve used more automation platforms than the average person — IFTTT (If This Then That), Zapier, Make, n8n — plus a few obscure ones that never went past beta. What every one of them did was box me into templates. This throttled my workflow and failed to show the real strength of premium tiers. I settled for living within their limits, even when it meant holding back my ideas.
A friend recommended Huginn, and I was intrigued by how fundamentally different it is. No glossy shortcuts, no paid add-ons, just raw access, full ownership, and the satisfaction of finally building my own automations rather than renting someone else’s. It’s surprising how it subtly outperforms some of the big names. It’s become one of my favorite free automation tools.
Why Huginn’s architecture outclasses Zapier and IFTTT’s paywalled features
If you used IFTTT or Zapier, you’re familiar with the trigger-and-action structure. Huginn’s implementation is different: it builds workflows using a continuous agent-to-event-to-agent chain. This approach delivers an immediate advantage with multi-step logic, conditional paths, and data shaping as core, fundamental, and free parts of Huginn. Typically, these are paid features in several tools, including Zapier and IFTTT.
The agents are small workers that produce structured JSON events. These events produce scenario chains that act like small automation ecosystems that can branch, merge, and loop through other agents, rather than acting as isolated tasks.
Huginn allows unlimited chaining, dynamic routing, and even native scripting, replacing expensive features in Zapier like Webhooks by Zapier, Code by Zapier, and Multi-Step Zaps, without limiting how often or how deeply you automate.
- OS
-
Linux, macOS, Windows
- Price model
-
Free
Huginn is an open-source, self-hosted system which allows you to build automated tasks online using "agents". Agents can monitor websites, gather data, or trigger actions.
You fully own your data, your workflows, and the entire stack
The freedom of self-hosting—and the responsibility that comes with it
Huginn runs on your machine, making it fundamentally different. Triggers don’t pass through third-party companies, events aren’t logged on other platforms, and API keys don’t leave your computer. You don’t get this level of sovereignty from other platforms, which is ideal if you’re handling sensitive data.
However, owning the entire stack means you take responsibility for upkeep, which could be updates, security patches, Docker images, and backups. While this isn’t difficult, it’s a tradeoff worth mentioning. Commercial tools handle the upkeep but take away your control.
Huginn’s freedom extends beyond privacy. You can modify an agent if it lacks a feature or build an integration the platform needs if you have the skill. The only cost incurred is the server it runs on, and this alone can wipe out entire Zapier billing categories for heavy automation users.
Native scraping, parsing, filtering, and unlimited Webhooks
Huginn thrives in certain aspects where cloud-based automation tools quietly impose limits. For instance, its WebsiteAgent can scrape sites, crawl APIs, extract structured content, and run full JSONPath queries—things IFTTT doesn’t support, and Zapier will only accommodate in high-tier plans. It also offers Liquid templating so you can transform, reformat, or compute values before passing them on.
I can use unlimited Webhooks on Huginn for free, even though I had to pay for a similar feature on Zapier. This makes it possible for me to stitch workflows together or connect external apps without restrictions.
Advanced filters are heavily monetized features in Zapier, but with Huginn’s TriggerAgent, I can evaluate conditions, filter events with regex, or run small JavaScript snippets to decide which agent receives the next step.
Huginn unlocks a new category of personal automation
Workflows that literally cannot exist on Zapier or IFTTT
After building your first multi-agent chain, you will discover the true potential of Huginn. You can create a multi-branch pipeline that scrapes sources, filters by keywords, cross-references a spreadsheet, and sends a curated digest. It goes beyond merely replacing a Zap or an applet and constructs workflows that your favorite cloud platforms can’t execute, even if you’re on the premium plans.
A real example could be: RssAgent -> TriggerAgent -> DataMiningAgent -> GSheetsAgent -> EmailAgent. Assuming the sentiment analysis step is even possible with Zapier, it will require several Zaps and connected accounts, and also numerous billable tasks. IFTTT wouldn’t get past the first filter, but Huginn handles this kind of complexity easily. So, aside from saving money, Huginn unlocks degrees of automation that commercial platforms aren’t built to handle.
Setup feels intimidating — but using Huginn is surprisingly straightforward
The honest reality of installation, maintenance, and documentation
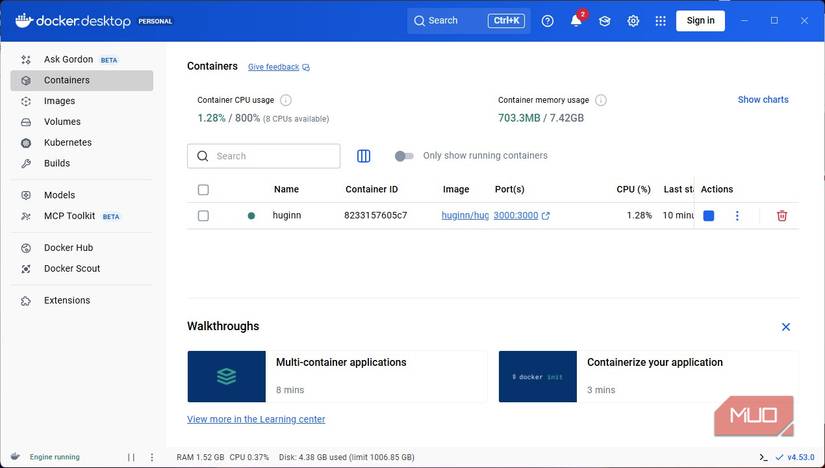
Huginn’s interface is pleasantly straightforward, but getting it all ready to use requires a mental shift. You’re spinning up your own automation server rather than signing in to a cloud dashboard. It was a similar process when I set up Nextcloud after ditching Google Drive. Docker makes it easier, even though you still have to deal with logs, restart containers, and manage database backups.
Just like several open-source projects, documentation for Huginn isn’t as elaborate as mainstream options like Zapier or IFTTT. You’ll be relying a lot on GitHub issues, community discussions, and reading agent READMEs directly in the repo—all part of the open-source experience.
Once you get it up and running, it’s straightforward to manage and stable. You can easily inspect events or catch errors, and debugging feels natural. You can version-control your complex setups with Blueprints, and you can automate Huginn itself with the CLI/API.
Huginn changes how you think about automation
Huginn completely changed how I think about automation. Rather than stitching together pre-approved actions, I imagine what’s possible when nothing is off-limits and when no features are locked behind paywalls.
Huginn gives you control and total ownership of a very powerful system. After experiencing this level of control, services like Zapier or IFTTT feel less robust, and Huginn has become an integral part of my productivity tools.
MakeUseOf
Navigating NFA Trusts: Suppressors and SBRs in 2026
The National Firearms Act trust remains the most practical vehicle for owning suppressors and short-barreled rifles, despite regulatory changes that reduced some of its original advantages. I’ve navigated this process multiple times, and the trust structure still offers meaningful benefits that individual ownership simply can’t match. The landscape has shifted since 2016, but understanding how … Read more
The post Navigating NFA Trusts: Suppressors and SBRs in 2026 appeared first on The Truth About Guns.
The Truth About Guns
Build Production-ready APIs in Laravel with Tyro
https://picperf.io/https://laravelnews.s3.amazonaws.com/featured-images/tyro-featured.png
Tyro is an API package for building production-ready APIs in Laravel. It is a zero-config package with authentication, authorization, privilege management, 40+ Artisan commands, and battle-tested security.
The post Build Production-ready APIs in Laravel with Tyro appeared first on Laravel News.
Join the Laravel Newsletter to get all the latest
Laravel articles like this directly in your inbox.
Laravel News
Python GUIs: Getting Started With NiceGUI for Web UI Development in Python — Your First Steps With the NiceGUI Library for Web UI Development
https://www.pythonguis.com/static/tutorials/nicegui/getting-started-nicegui/first-nicegui-app.png
NiceGUI is a Python library that allows developers to create interactive web applications with minimal effort. It’s intuitive and easy to use. It provides a high-level interface to build modern web-based graphical user interfaces (GUIs) without requiring deep knowledge of web technologies like HTML, CSS, or JavaScript.
In this article, you’ll learn how to use NiceGUI to develop web apps with Python. You’ll begin with an introduction to NiceGUI and its capabilities. Then, you’ll learn how to create a simple NiceGUI app in Python and explore the basics of the framework’s components. Finally, you’ll use NiceGUI to handle events and customize your app’s appearance.
To get the most out of this tutorial, you should have a basic knowledge of Python. Familiarity with general GUI programming concepts, such as event handling, widgets, and layouts, will also be beneficial.
Installing NiceGUI
Before using any third-party library like NiceGUI, you must install it in your working environment. Installing NiceGUI is as quick as running the python -m pip install nicegui command in your terminal or command line. This command will install the library from the Python Package Index (PyPI).
It’s a good practice to use a Python virtual environment to manage dependencies for your project. To create and activate a virtual environment, open a command line or terminal window and run the following commands in your working directory:
- Windows
- macOS
- Linux
PS> python -m venv .\venv
PS> .\venv\Scripts\activate
$ python -m venv venv/
$ source venv/bin/activate
$ python3 -m venv venv/
$ source venv/bin/activate
The first command will create a folder called venv/ containing a Python virtual environment. The Python version in this environment will match the version you have installed on your system.
Once your virtual environment is active, install NiceGUI by running:
(venv) $ python -m pip install nicegui
With this command, you’ve installed NiceGUI in your active Python virtual environment and are ready to start building applications.
Writing Your First NiceGUI App in Python
Let’s create our first app with NiceGUI and Python. We’ll display the traditional "Hello, World!" message in a web browser. To create a minimal NiceGUI app, follow these steps:
- Import the
niceguimodule. - Create a GUI element.
- Run the application using the
run()method.
Create a Python file named app.py and add the following code:
from nicegui import ui

ui.label('Hello, World!').classes('text-h1')

ui.run()
This code defines a web application whose UI consists of a label showing the Hello, World! message. To create the label, we use the ui.label element. The call to ui.run() starts the app.
Run the application by executing the following command in your terminal:
(venv) $ python app.py
This will open your default browser, showing a page like the one below:
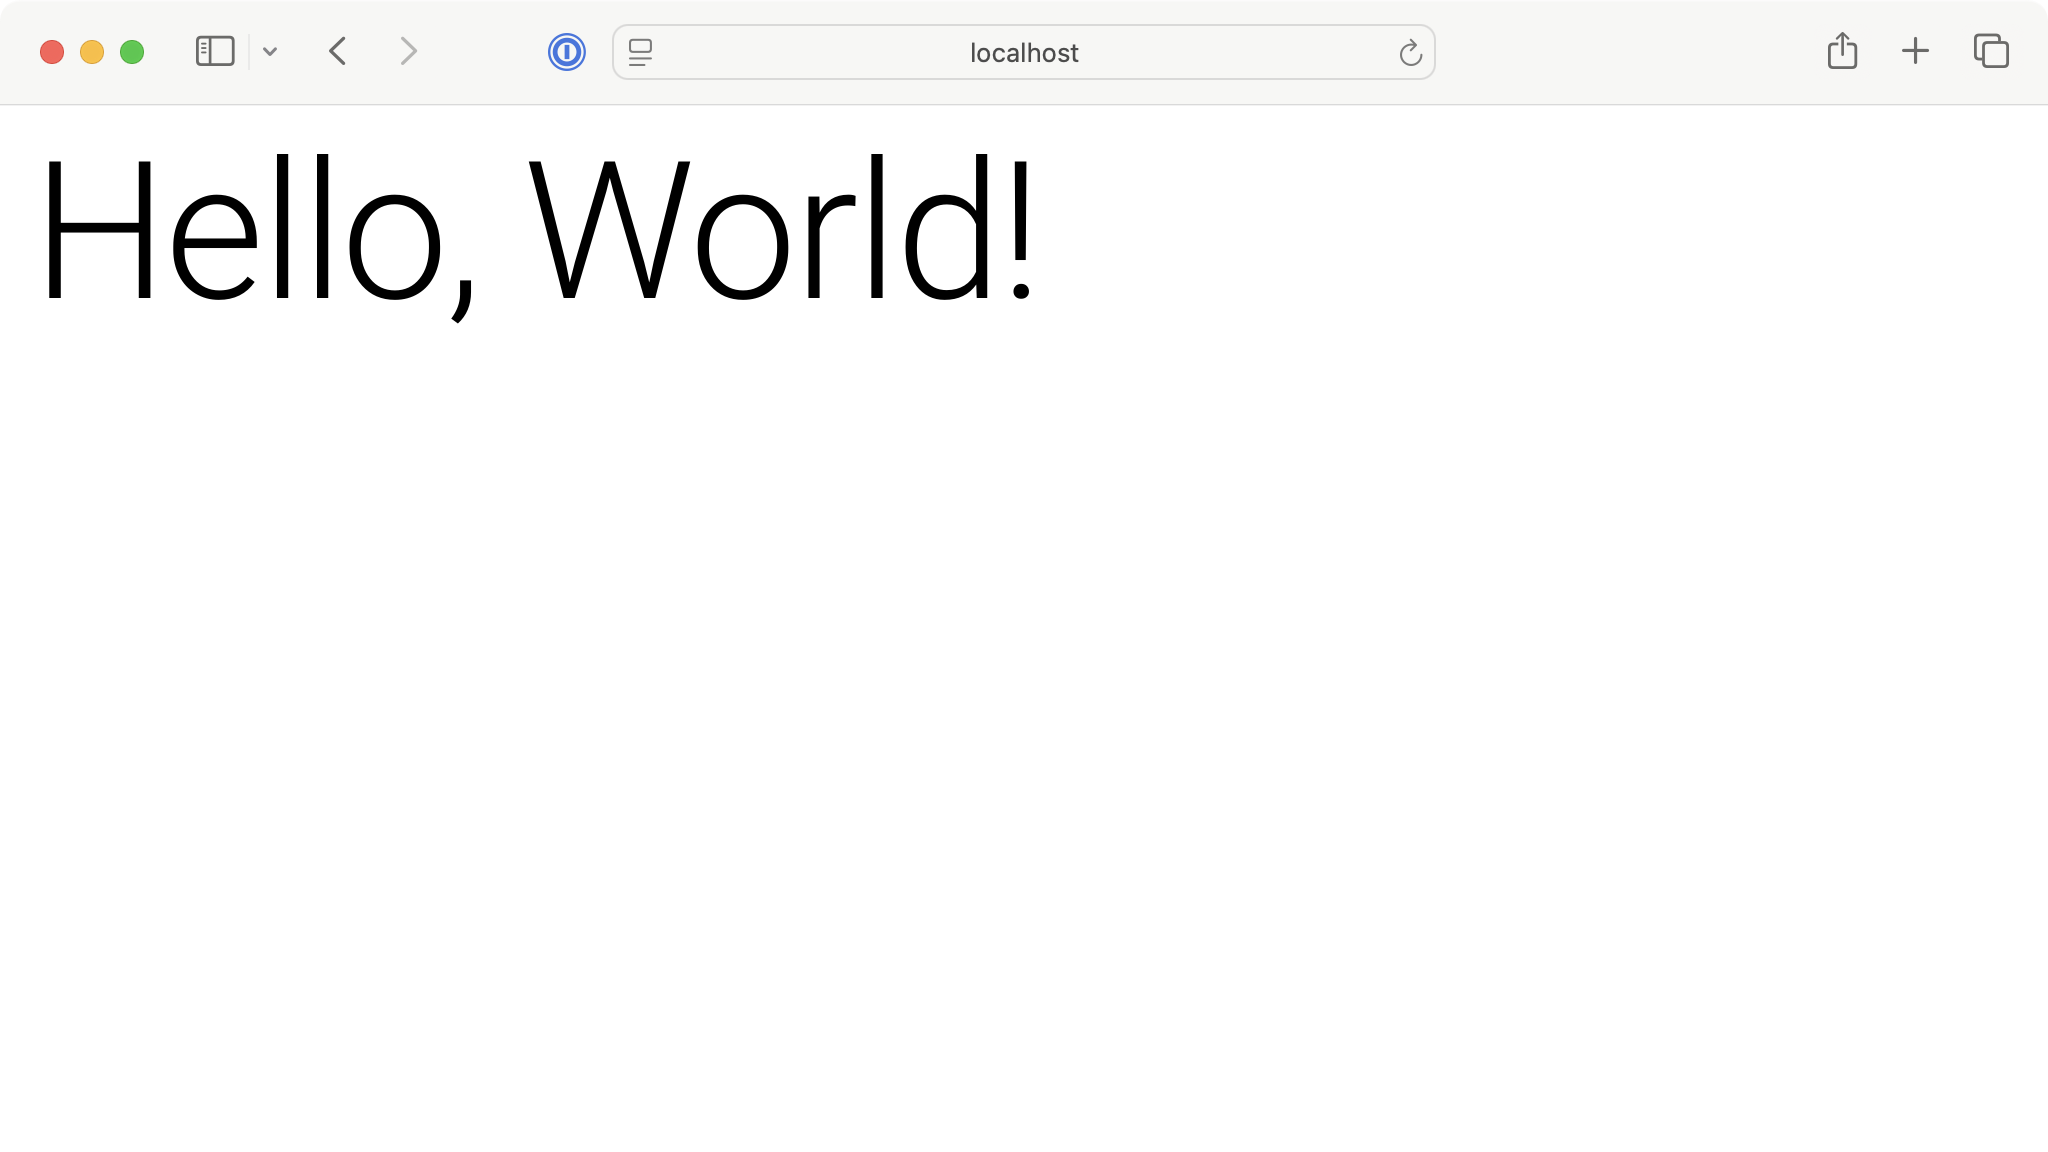
First NiceGUI Application
Congratulations! You’ve just written your first NiceGUI web app using Python. The next step is to explore some features of NiceGUI that will allow you to create fully functional web applications.
If the above command doesn’t open the app in your browser, then go ahead and navigate to http://localhost:8080.
Exploring NiceGUI Graphical Elements
NiceGUI elements are the building blocks that we’ll arrange to create pages. They represent UI components like buttons, labels, text inputs, and more. The elements are classified into the following categories:
In the following sections, you’ll code simple examples showcasing a sample of each category’s graphical elements.
Text Elements
NiceGUI also has a rich set of text elements that allow you to display text in several ways. This set includes some of the following elements:
The following demo app shows how to create some of these text elements:
from nicegui import ui

# Text elements
ui.label("Label")

ui.link("PythonGUIs", "https://pythonguis.com")

ui.chat_message("Hello, World!", name="PythonGUIs Chatbot")

ui.markdown(
    """
    # Markdown Heading 1
    **bold text**
    *italic text*
    `code`
    """
)

ui.restructured_text(
    """
    ==========================
    reStructuredText Heading 1
    ==========================
    **bold text**
    *italic text*
    ``code``
    """
)

ui.html("<strong>bold text using HTML tags</strong>")

ui.run(title="NiceGUI Text Elements")
In this example, we create a simple web interface showcasing various text elements. The page shows several text elements, including a basic label, a hyperlink, a chatbot message, and formatted text using the Markdown and reStructuredText markup languages. Finally, it shows some raw HTML.
Each text element allows us to present textual content on the page in a specific way or format, which gives us a lot of flexibility for designing modern web UIs.
Run it! Your browser will open with a page that looks like the following.
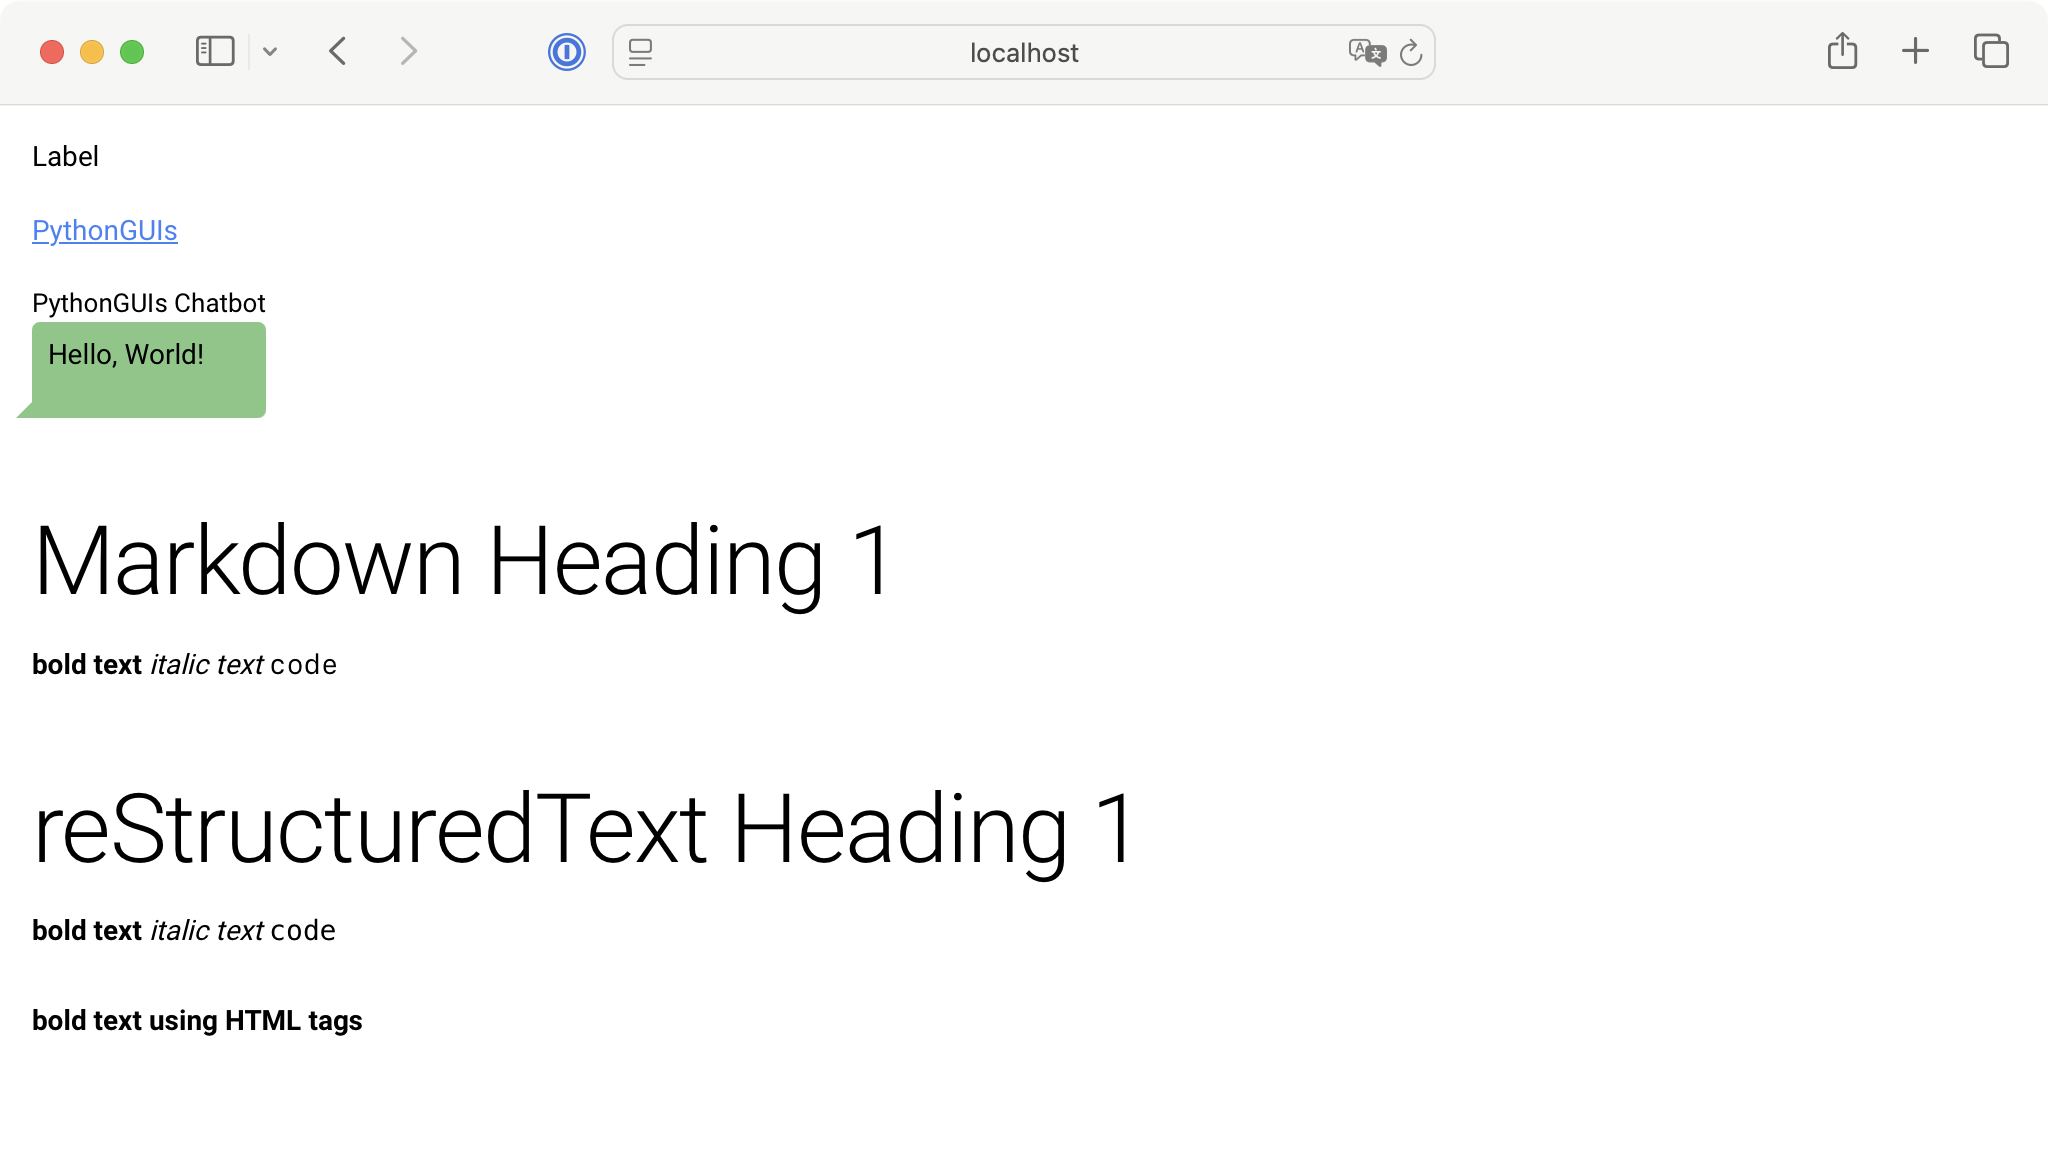
Text Elements Demo App in NiceGUI
Control Elements
When it comes to control elements, NiceGUI offers a variety of them. As their name suggests, these elements allow us to control how our web UI behaves. Here are some of the most common control elements available in NiceGUI:
- Buttons
- Dropdown lists
- Toggle buttons
- Radio buttons
- Checkboxes
- Sliders
- Switches
- Text inputs
- Text areas
- Date input
The demo app below showcases some of these control elements:
from nicegui import ui

# Control elements
ui.button("Button")

with ui.dropdown_button("Edit", icon="edit", auto_close=True):
    ui.item("Copy")
    ui.item("Paste")
    ui.item("Cut")

ui.toggle(["ON", "OFF"], value="ON")

ui.radio(["NiceGUI", "PyQt6", "PySide6"], value="NiceGUI").props("inline")

ui.checkbox("Enable Feature")

ui.slider(min=0, max=100, value=50, step=5)

ui.switch("Dark Mode")

ui.input("Your Name")

ui.number("Age", min=0, max=120, value=25, step=1)

ui.date(value="2025-04-11")

ui.run(title="NiceGUI Control Elements")
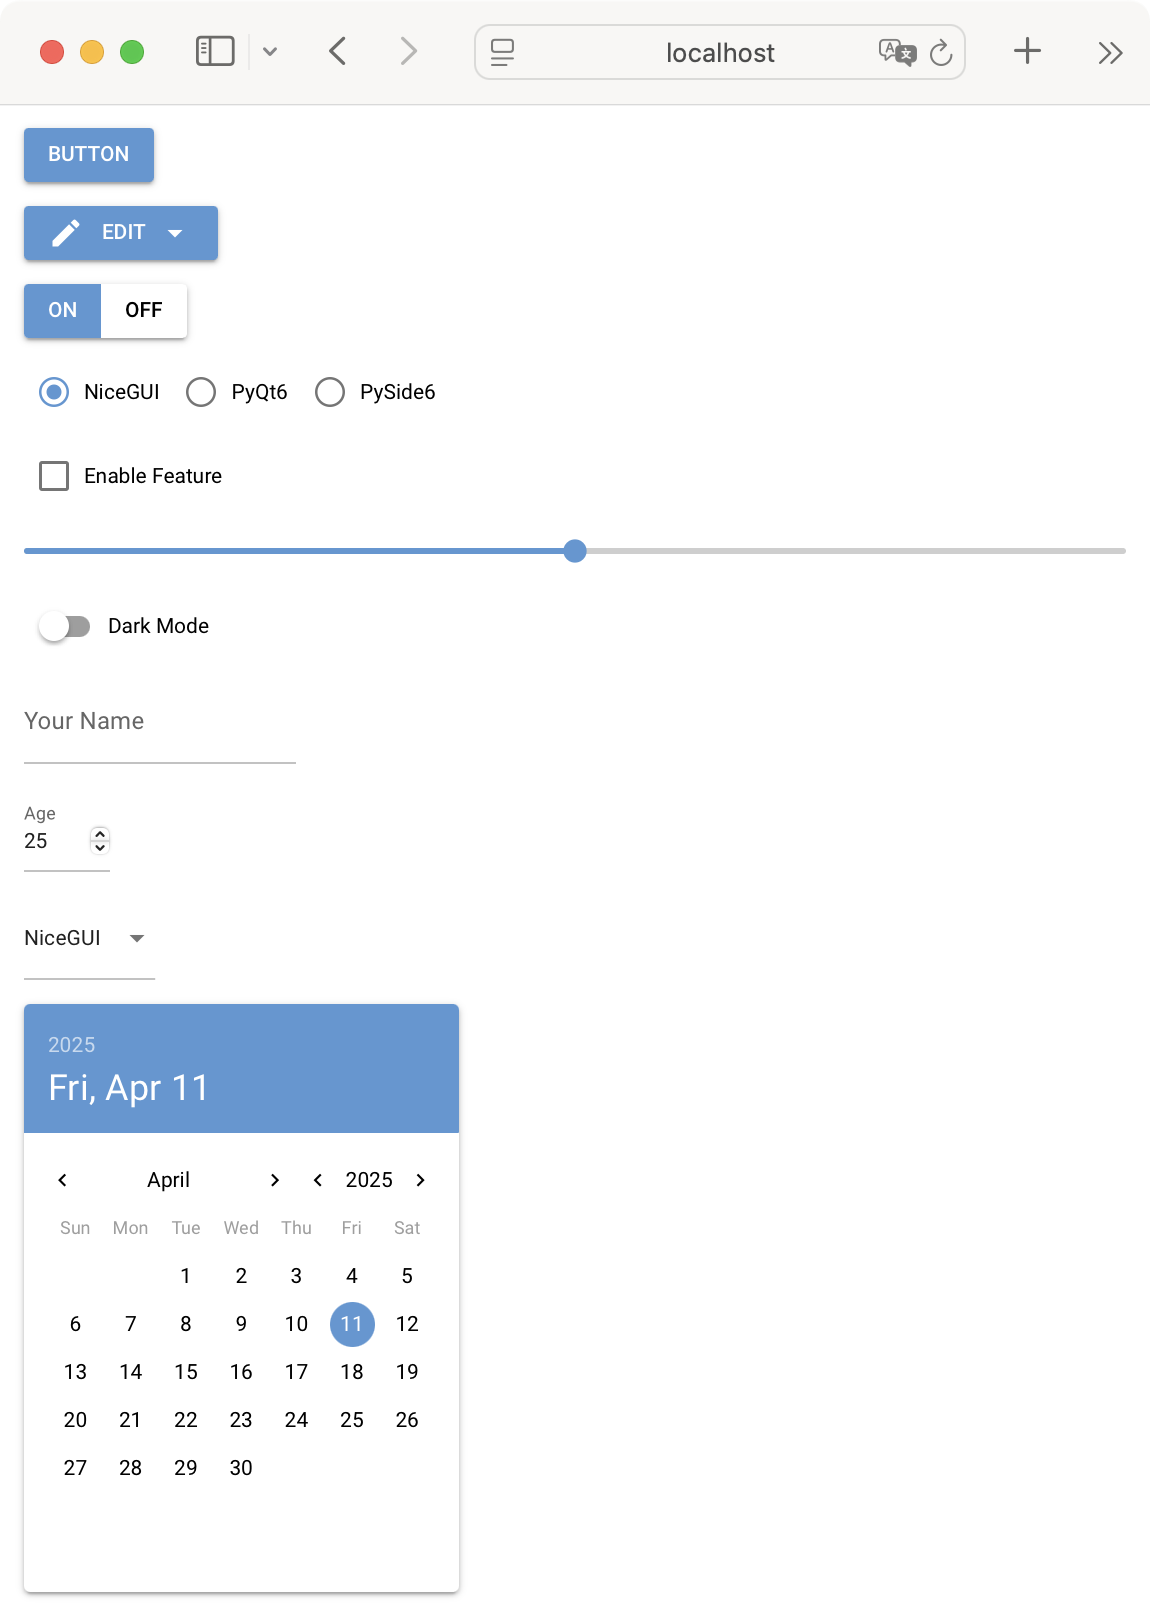
In this app, we include several control elements: a button, a dropdown menu with editing options (Copy, Paste, Cut), and a toggle switch between ON and OFF states. We also have a radio button group to choose between GUI frameworks (NiceGUI, PyQt6, PySide6), a checkbox labeled Enable Feature, and a slider to select a numeric value within a range.
Further down, we have a switch to toggle Dark Mode, a text input field for entering a name, a number input for providing age, and a date picker. Each of these controls has its own properties and methods that you can tweak to customize your web interfaces using Python and NiceGUI.
Note that the elements on this app don’t perform any action. Later in this tutorial, you’ll learn about events and actions. For now, we’re just showcasing some of the available graphical elements of NiceGUI.
Run it! You’ll get a page that will look something like the following.
Text Elements Demo App in NiceGUI
Data Elements
If you’re in the data science field, then you’ll be thrilled with the variety of data elements that NiceGUI offers. You’ll find elements for some of the following tasks:
- Representing data in a tabular format
- Creating plots and charts
- Building different types of progress charts
- Displaying 3D objects
- Using maps
- Creating tree and log views
- Presenting and editing text in different formats, including plain text, code, and JSON
Here’s a quick NiceGUI app where we use a table and a plot to present temperature measurements against time:
from matplotlib import pyplot as plt
from nicegui import ui

# Data elements
time = [1, 2, 3, 4, 5, 6]
temperature = [30, 32, 34, 32, 33, 31]

columns = [
    {
        "name": "time",
        "label": "Time (min)",
        "field": "time",
        "sortable": True,
        "align": "right",
    },
    {
        "name": "temperature",
        "label": "Temperature (ºC)",
        "field": "temperature",
        "required": True,
        "align": "right",
    },
]
rows = [
    {"temperature": temperature, "time": time}
    for temperature, time in zip(temperature, time)
]
ui.table(columns=columns, rows=rows, row_key="name")

with ui.pyplot(figsize=(5, 4)):
    plt.plot(time, temperature, "-o", color="blue", label="Temperature")
    plt.title("Temperature vs Time")
    plt.xlabel("Time (min)")
    plt.ylabel("Temperature (ºC)")
    plt.ylim(25, 40)
    plt.legend()

ui.run(title="NiceGUI Data Elements")
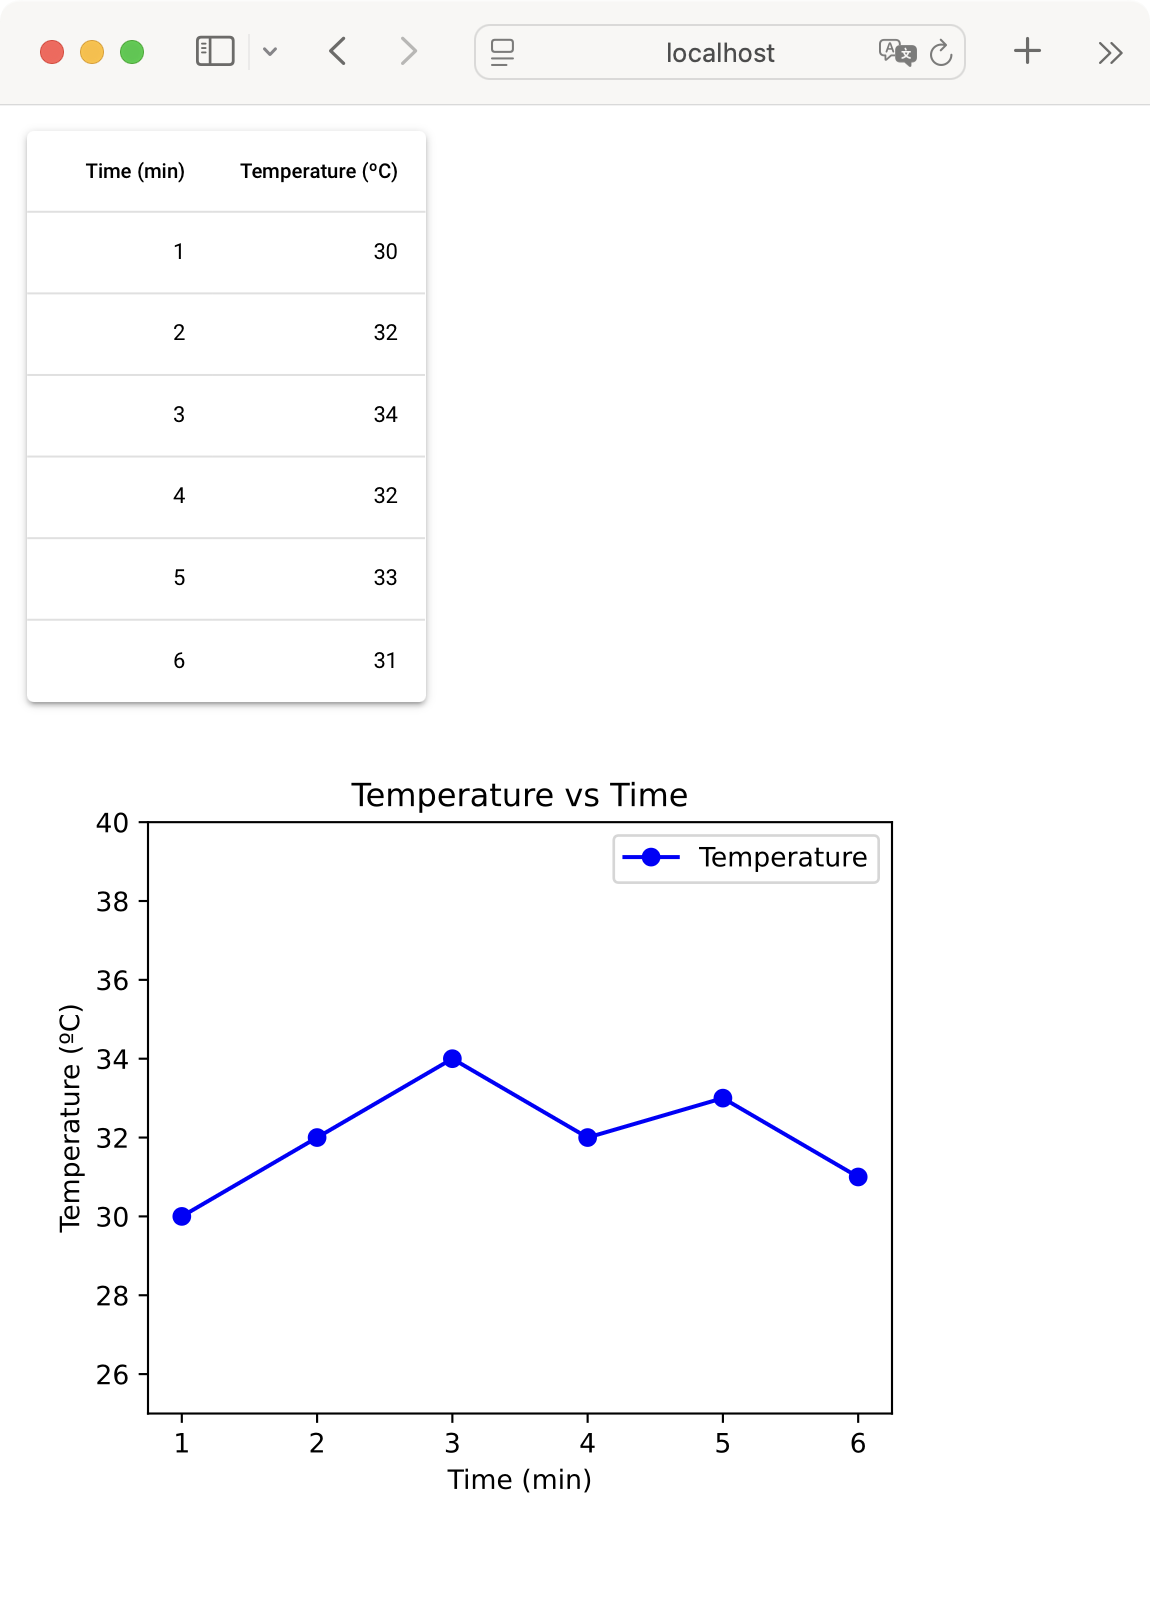
In this example, we create a web interface that displays a table and a line plot. The data is stored in two lists: one for time (in minutes) and one for temperature (in degrees Celsius). These values are formatted into a table with columns for time and temperature. To render the table, we use the ui.table element.
Below the table, we create a Matplotlib plot of temperature versus time and embed it in the ui.pyplot element. The plot has a title, axis labels, and a legend.
Run it! You’ll get a page that looks something like the following.
Data Elements Demo App in NiceGUI
Audiovisual Elements
NiceGUI also has some elements that allow us to display audiovisual content in our web UIs. The audiovisual content may include some of the following:
Below is a small demo app that shows how to add a local image to your NiceGUI-based web application:
from nicegui import ui

with ui.image("./otje.jpg"):
    ui.label("Otje the cat!").classes(
        "absolute-bottom text-subtitle2 text-center"
    )

ui.run(title="NiceGUI Audiovisual Elements")
In this example, we use the ui.image element to display a local image on your NiceGUI app. The image will show a subtitle at the bottom.
NiceGUI elements provide the classes() method, which allows you to apply Tailwind CSS classes to the target element. To learn more about using CSS for styling your NiceGUI apps, check the Styling & Appearance section in the official documentation.
Run it! You’ll get a page that looks something like the following.

Audiovisual Elements Demo App in NiceGUI
Laying Out Pages in NiceGUI
Laying out a GUI so that every graphical component is in the right place is a fundamental step in any GUI project. NiceGUI offers several elements that allow us to arrange graphical elements to build a nice-looking UI for our web apps.
Here are some of the most common layout elements:
- Cards wrap another element in a frame.
- Column arranges elements vertically.
- Row arranges elements horizontally.
- Grid organizes elements in a grid of rows and columns.
- List displays a list of elements.
- Tabs organize elements in dedicated tabs.
You’ll find several other elements that allow you to tweak how your app’s UI looks. Below is a demo app that combines a few of these elements to create a minimal but well-organized user profile form:
from nicegui import ui

with ui.card().classes("w-full max-w-3xl mx-auto shadow-lg"):
    ui.label("Profile Page").classes("text-xl font-bold")

    with ui.row().classes("w-full"):
        with ui.card():
            ui.image("./profile.png")

            with ui.card_section():
                ui.label("Profile Image").classes("text-center font-bold")
                ui.button("Change Image", icon="photo_camera")

        with ui.card().classes("flex-grow"):
            with ui.column().classes("w-full"):
                name_input = ui.input(
                    placeholder="Your Name",
                ).classes("w-full")
                gender_select = ui.select(
                    ["Male", "Female", "Other"],
                ).classes("w-full")
                eye_color_input = ui.input(
                    placeholder="Eye Color",
                ).classes("w-full")
                height_input = ui.number(
                    min=0,
                    max=250,
                    value=170,
                    step=1,
                ).classes("w-full")
                weight_input = ui.number(
                    min=0,
                    max=500,
                    value=60,
                    step=0.1,
                ).classes("w-full")

            with ui.row().classes("justify-end gap-2 q-mt-lg"):
                ui.button("Reset", icon="refresh").props("outline")
                ui.button("Save", icon="save").props("color=primary")

ui.run(title="NiceGUI Layout Elements")
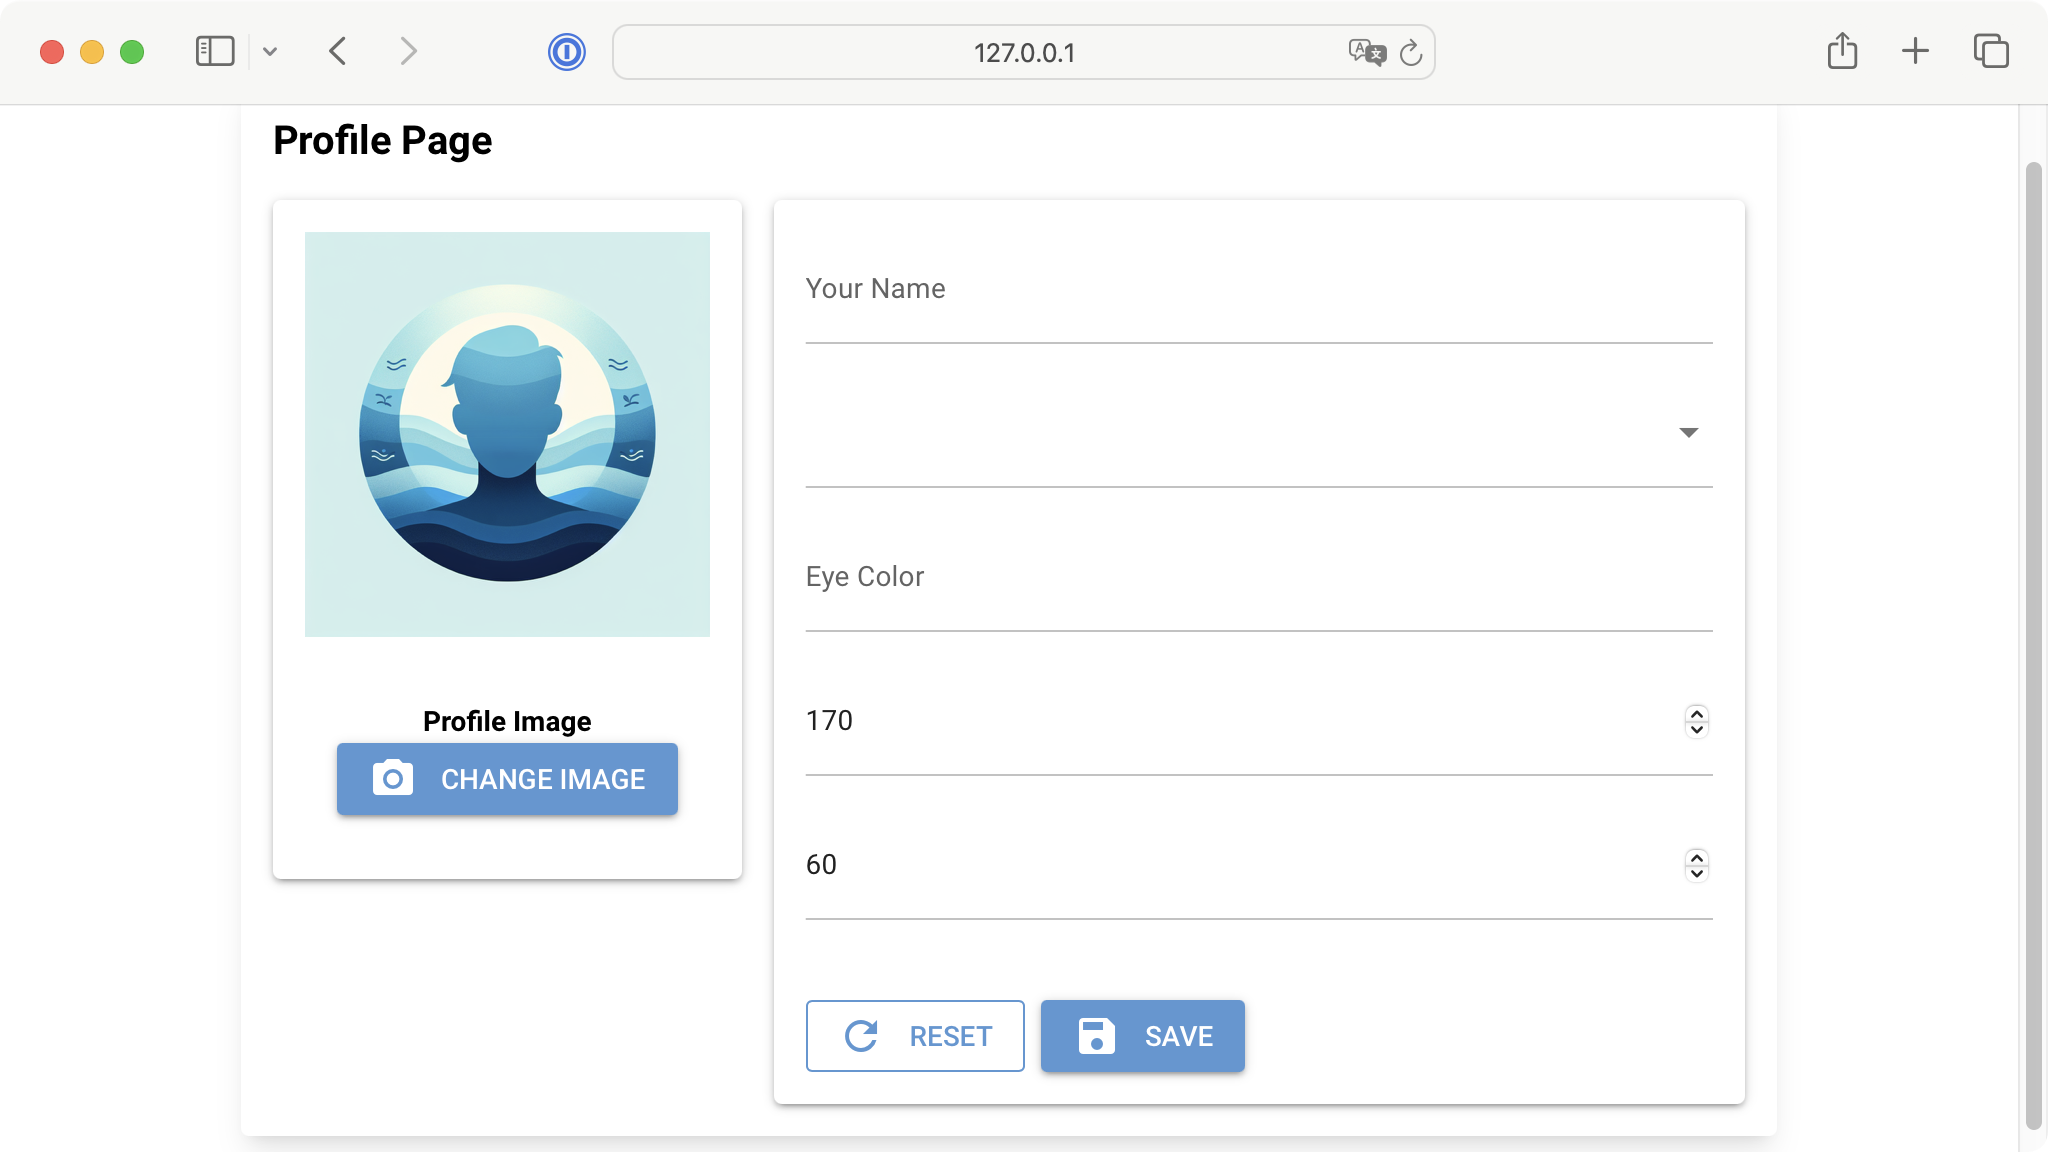
In this app, we create a clean, responsive profile information page using a layout based on the ui.card element. We center the profile form and cap it at a maximum width for better readability on larger screens.
We organize the elements into two main sections:
-
A profile image card on the left and a form area on the right. The left section displays a profile picture using the
ui.imageelement with a Change Image button underneath. -
A series of input fields for personal information, including the name in a
ui.inputelement, the gender in aui.selectelement, the eye color in aui.inputelement, and the height and weight inui.numberelements. At the bottom of the form, we add two buttons: Reset and Save.
We use consistent CSS styling throughout the layout to guarantee proper spacing, shadows, and responsive controls. This ensures that the interface looks professional and works well across different screen sizes.
Run it! Here’s how the form looks on the browser.
A Demo Profile Page Layout in NiceGUI
Handling Events and Actions in NiceGUI
In NiceGUI, you can handle events like mouse clicks, keystrokes, and similar ones as you can in other GUI frameworks. Elements typically have arguments like on_click and on_change that are the most direct and convenient way to bind events to actions.
Here’s a quick app that shows how to make a NiceGUI app perform actions in response to events:
from nicegui import ui

def on_button_click():
    ui.notify("Button was clicked!")

def on_checkbox_change(event):
    state = "checked" if event.value else "unchecked"
    ui.notify(f"Checkbox is {state}")

def on_slider_change(event):
    ui.notify(f"Slider value: {event.value}")

def on_input_change(event):
    ui.notify(f"Input changed to: {event.value}")

ui.label("Event Handling Demo")

ui.button("Click Me", on_click=on_button_click)
ui.checkbox("Check Me", on_change=on_checkbox_change)
ui.slider(min=0, max=10, value=5, on_change=on_slider_change)
ui.input("Type something", on_change=on_input_change)

ui.run(title="NiceGUI Events & Actions Demo")
In this app, we first define four functions we’ll use as actions. When we create the control elements, we use the appropriate argument to bind an event to a function. For example, in the ui.button element, we use the on_click argument, which makes the button call the associated function when we click it.
We do something similar with the other elements, but use different arguments depending on the element’s supported events.
You can check the documentation of elements to learn about the specific events they can handle.
Using the on_* type of arguments is not the only way to bind events to actions. You can also use the on() method, which allows you to attach event handlers manually. This approach is handy for less common events or when you want to attach multiple handlers.
Here’s a quick example:
from nicegui import ui

def on_click(event):
    ui.notify(f"Button was clicked!")

def on_hover(event):
    ui.notify(f"Button was hovered!")

button = ui.button("Button")
button.on("click", on_click)
button.on("mouseover", on_hover)

ui.run()
In this example, we create a small web app with a single button that responds to two different events. When you click the button, the on_click() function triggers a notification. Similarly, when you hover the mouse over the button, the on_hover() function displays a notification.
To bind the events to the corresponding function, we use the on() method. The first argument is a string representing the name of the target event. The second argument is the function that we want to run when the event occurs.
Conclusion
In this tutorial, you’ve learned the basics of creating web applications with NiceGUI, a powerful Python library for web GUI development.
You’ve explored common elements, layouts, and event handling. This gives you the foundation to build modern and interactive web interfaces. For further exploration and advanced features, refer to the official NiceGUI documentation.
Planet Python
Announcing AWS Glue zero-ETL for self-managed Database Sources
AWS Glue now supports zero-ETL for self-managed database sources. Using Glue zero-ETL, you can now setup an integration to replicate data from Oracle, SQL Server, MySQL or PostgreSQL databases which are located on-premises or on AWS EC2 to Redshift with a simple experience that eliminates configuration complexity.
AWS zero-ETL for self-managed database sources will automatically create an integration for an on-going replication of data from your on-premises or EC2 databases through a simple, no-code interface. You can now replicate data from Oracle, SQL Server, MySQL and PostgreSQL databases into Redshift. This feature further reduces users’ operational burden and saves weeks of engineering effort needed to design, build, and test data pipelines to ingest data from self-managed databases to Redshift.
AWS Glue zero-ETL for self-managed database sources are available in the following AWS Regions: US East (Ohio), Europe (Stockholm), Europe (Ireland), Europe (Frankfurt), Canada West (Calgary), US West (Oregon), and Asia Pacific (Seoul) regions. To get started, sign into the AWS Management Console. For more information visit the AWS Glue page or review the AWS Glue zero-ETL documentation.
Planet for the MySQL Community
World’s Largest Glue-Up?
https://s3files.core77.com/blog/images/1778860_81_139479_DPvJRSCKT.jpg
Furnituremakers among you undoubtedly remember your most difficult glue-up: A countertop, bench or tabletop of unwieldy dimensions. Well, you probably won’t complain again, after seeing what these folks are doing. Swiss timber company Huesser Holzleimbau, which specializes in creating glue-lam beams, recently won a contract to manufacture two burly beams for a bridge.
Twenty-eight employees (including people from the office called onto the shop floor to pitch in) worked together on the most massive glue-up I’ve ever seen:


Once all of the separate glue-ups were put together, the resultant part was 27.3 m (90 ft) long, with a width and height of 1320 x 1360 mm (52 x 54 in). Counting the steel brackets embedded into the beam, it weighs 24.1 tonnes (53,130 lbs)! And they made two of them.
Located in Obersaxen, Switzerland, the Lochlitobel Bridge was erected last month to span a gorge.

As for why they made it out of wood and not steel, it was actually faster and required less logistics to make it out of wood. Glue-lam beams have 1.5 to 3 times the strength-to-weight ratio of steel, and could thus be fabricated offsite, trucked to the site and hoisted into place with less equipment than would have been required with heavy steel.


"During the entire construction period, no auxiliary bridges would have been possible, and there would have been virtually no convenient detour options," writes the Canton of Graubunden, where the bridge is located. "To minimize traffic restrictions, the two wooden load-bearing girders, each weighing 25 tons and over 27 meters long, were prefabricated and then installed on site with millimeter precision. This process ensured high quality and, from the dismantling of the old bridge to the commissioning of the new one, a road closure of only eight weeks."
Core77
