ProxySQL in Front of AWS RDS & Aurora MySQL — Part 4: HA, Failover Patterns, and TLS

https://reliadb.com/images/og-default.png

Two API calls, same region, same lab session. Aurora writer failover: ProxySQL marked the writer SHUNNED at T0+8.7 seconds. Topology fully inverted at T0+15 seconds. Three errors across 2,020 queries through two ProxySQL nodes — the same order of magnitude as Part 2‘s 2-in-1,485 result from a single node. RDS Multi-AZ failover: 64 seconds from the same API trigger to AWS "completed." No ProxySQL topology change required, because there’s no topology to change — the standby isn’t readable, and the endpoint is DNS-based.

The 4× gap between 15 seconds and 64 seconds isn’t a sizing difference or an artifact of how the failover was triggered. It’s structural. Aurora’s ProxySQL integration reads INFORMATION_SCHEMA.REPLICA_HOST_STATUS directly, on its own polling schedule, independent of the AWS control plane. RDS Multi-AZ failover goes through DNS — and DNS propagation through resolver caches takes as long as it takes, regardless of what ProxySQL is doing.

Parts 1–3 built to this point: the placement decision, the Aurora wiring, and the query routing layer. This part is where the HA system is tested under pressure. ProxySQL Cluster sync timing and footguns, NLB health check reality versus the theoretical window, Aurora dual-node failover, RDS Multi-AZ as the baseline comparison, backend TLS with a footgun hiding in auto-discovery, and query mirroring’s measured latency impact. Everything here comes from a live AWS lab session.

Lab provenance: Tested live on Aurora MySQL 3.12.0 / MySQL 8.0.44 and RDS MySQL 8.0.40 (Multi-AZ), ProxySQL 2.7.3 in us-east-1 on 2026-05-09. All AWS resources destroyed post-capture. Estimated cost: ~$0.65.

ProxySQL Cluster Sync: Timings, Footguns, and Limits

The ProxySQL Cluster propagates configuration automatically between peers — it’s the mechanism that lets you apply a query rule change to one node and have it arrive on the other without a manual push. But the sync model has specific failure modes under fresh nodes and concurrent edits that are worth understanding before you rely on it during an incident.

What Syncs and How Fast

Three variables control sync cadence: admin-cluster_check_interval_ms sets how often each node polls its peers for config checksums; admin-cluster_mysql_query_rules_diffs_before_sync (and the equivalent for mysql_servers, mysql_users, and global_variables) sets how many consecutive checksum differences must be detected before sync fires. With check_interval_ms=200 and diffs_before_sync=3, the minimum propagation window is 3 × 200ms = 600ms.

Lab measurements, inserting a new query rule on proxysql-1 and polling proxysql-2 for arrival:

Config type Measured latency Notes
mysql_query_rules 614ms
mysql_servers 620ms
global variable (mysql-monitor_ping_interval) 597ms
mysql_users ~600ms see note

The mysql_users row warrants a note. runtime_mysql_users stores every user twice — one frontend row (for client authentication against ProxySQL) and one backend row (for ProxySQL’s own authentication against MySQL backends). A correctness check expecting COUNT(*)=1 after sync would always fail, because the synced state is COUNT(*)=2. That’s the correct count, not a sync failure. Verify sync by comparing the count on the peer against the count on the source node — they should match.

Disk persistence works per-node. Each node writes its runtime state to its own sqlite3 database when SAVE ... TO DISK is called. Cluster sync operates at the runtime layer only — it doesn’t sync disk state between nodes. If proxysql-2’s sqlite3 is wiped and proxysql-2 restarts, it comes back with an empty config regardless of what proxysql-1’s disk contains.

admin-cluster_mysql_servers_sync_algorithm=1 is the right setting for steady-state operation. It propagates only deltas — the diff between the current table state and the last state recorded from each peer. Efficient, low-overhead, and correct under normal conditions.

The failure mode is specific: a fresh node that has never seen any state has no baseline. There are no deltas to compute against nothing. The sync mechanism produces nothing, and the fresh node stays empty indefinitely.

Lab result: wiped proxysql-2’s sqlite3 while keeping proxysql_servers intact so the cluster could still communicate. With algorithm=1, mysql_query_rules synced at 592ms — the cluster had tracked that table across prior sessions and had a baseline to diff against. mysql_servers never arrived on proxysql-2, even after 60+ seconds of polling. ProxySQL’s diff engine had no previous state to compare against for mysql_servers on the fresh node, so it computed no changes and pushed nothing.

Fix: set admin-cluster_mysql_servers_sync_algorithm=0 on both nodes and reload. Full-pull mode disregards the diff baseline and copies the complete table from the peer with the highest epoch. Proxysql-2 had a populated mysql_servers within 3 seconds. Once you verify runtime_mysql_servers is correct on the bootstrapped node, restore algorithm=1.

-- Tested: ProxySQL 2.7.3, Lima VMs, 2026-05-09
-- Temporary fix for bootstrapping a fresh or wiped node
SET admin-cluster_mysql_servers_sync_algorithm=0;
LOAD ADMIN VARIABLES TO RUNTIME;

-- After confirming the fresh node has synced (check runtime_mysql_servers):
SET admin-cluster_mysql_servers_sync_algorithm=1;
LOAD ADMIN VARIABLES TO RUNTIME;
SAVE ADMIN VARIABLES TO DISK;

algorithm=0 for initial bootstrap; algorithm=1 for steady-state. Not both at once, not neither.

Concurrent Writes Don’t Converge Cleanly

The cluster’s conflict resolution model is last-epoch-wins: each config change increments the epoch counter on the node that made it, and peers adopt the config from whichever peer reports the highest epoch. For changes separated in time — the normal case — this works without issue.

What happens when two changes hit different nodes within the same check_interval window? Lab result: changed the same query rule row simultaneously on proxysql-1 (destination_hostgroup=10 at T0+50ms) and proxysql-2 (destination_hostgroup=20 at T0+102ms). Both changes fell inside a single 200ms polling cycle. After 5 seconds, neither node had adopted the other’s value. Config checksums had diverged and stayed diverged — proxysql-1 at 0x82176C666CE36C22, proxysql-2 at 0x23250DE02EC63EED.

The root issue: when both nodes increment their epochs within the same check cycle, neither sees the other as definitively higher before committing its own change. The split-brain persisted well past the "a few hundred milliseconds" convergence that the docs describe for normal propagation.

The operational fix is architectural, not a tuning parameter. Pick one ProxySQL node as the exclusive target for all config changes. Apply changes there, let cluster sync carry them to the peer, and confirm arrival before proceeding. Never write conflicting changes to both nodes simultaneously and rely on sync to reconcile the result.

NLB Health Checks: Why Your Runbook Says 90 Seconds But Should Say 110

An NLB in front of the ProxySQL pair routes around a failed node once its health checks reach the unhealthy_threshold. Standard configuration for this topology: TCP target group on port 6033, unhealthy_threshold=3, interval=30s. The theoretical detection window: 3 × 30s = 90 seconds.

The measured result was 110 seconds. The extra 20 seconds isn’t NLB slowness — it’s EC2 shutdown time. When an EC2 instance stops, there’s a graceful shutdown sequence before the OS releases the network stack and the TCP port becomes unreachable. The NLB’s health check timer starts only once connections are actively refused — it can’t detect "instance is shutting down," only "TCP connection failed." The additional 20-second gap between "shutdown initiated" and "connections refused" doesn’t shorten regardless of how you tune the health check thresholds.

Budget 110–120 seconds in your runbooks and alert thresholds, not 90. If your application has connect timeouts shorter than the actual detection window, you’ll see errors before the NLB reroutes. If they’re longer, the reroute happens first and the error disappears silently. The 110-second real-world number is the right one to design against.

Once the NLB marks a target unhealthy, all new TCP connections route to the surviving ProxySQL node. That node needs no configuration change — it already holds its share of backend connections and continues routing normally. Applications using connection pools with retry logic reconnect within one cycle. The surviving node handles the increased load without any config intervention.

Aurora Dual-Node Failover: 4× Faster Than RDS Multi-AZ

Scenario ProxySQL detection Full resolution AWS “completed” event Traffic errors
Aurora + dual ProxySQL T0+8.7s (SHUNNED) T0+15s (topology flip) T0+22s ~3 / 2,020 queries
RDS Multi-AZ (single ProxySQL HG) n/a — DNS-based T0+64s T0+64s not captured

AWS event timestamps drive the RDS comparison. Per-second client error counts for the RDS leg require manual inspection of the raw traffic log — the automated analysis script did not extract them. The 64-second figure comes directly from AWS event timestamps and is the reliable number.

Aurora resolves approximately 4× faster — 15 seconds versus 64 seconds — and without touching DNS. ProxySQL reads INFORMATION_SCHEMA.REPLICA_HOST_STATUS directly and reroutes at the TCP connection level. There’s no resolver cache between ProxySQL and the Aurora instance endpoints.

Aurora ProxySQL Configuration for Dual Nodes

The mysql_aws_aurora_hostgroups configuration adds a dedicated HG pair (200/201) for Aurora alongside the existing Lima MySQL hostgroups (HG 10/20). The key values and their constraints:

-- Tested: ProxySQL 2.7.3, Aurora MySQL 3.12.0 / MySQL 8.0.44, us-east-1, 2026-05-09
INSERT INTO mysql_aws_aurora_hostgroups (
  writer_hostgroup, reader_hostgroup, active,
  aurora_port, domain_name,
  max_lag_ms, check_interval_ms, check_timeout_ms,
  writer_is_also_reader, new_reader_weight,
  comment
) VALUES (
  200, 201, 1,
  3306, '.CLUSTER-EXAMPLE.us-east-1.rds.amazonaws.com',
  60000, 5000, 3000,
  1, 100,
  'part4-aurora'
);

Two values are worth flagging from experience. check_timeout_ms=3000 is the enforced upper bound — ProxySQL 2.7.3 has a CHECK constraint requiring 80 <= check_timeout_ms <= 3000. Exceeding it produces a silent failure: the INSERT returns success but the row isn’t accepted and the Aurora monitor thread never starts. If discovery isn’t happening, verify your check_timeout_ms first. Second: domain_name must start with a dot (.CLUSTER-EXAMPLE..., not CLUSTER-EXAMPLE...). The same constraint enforces this; INSERT without the leading dot fails with a constraint error.

After LOAD MYSQL SERVERS TO RUNTIME, the monitor thread polls the seed endpoint and auto-discovers the writer and reader within two polling cycles:

-- runtime_mysql_servers on proxysql-1 (~10s after LOAD TO RUNTIME)
hostgroup_id  hostname                                              port  status
200           mysql-ha-test-aurora-writer.CLUSTER-EXAMPLE...  3306  ONLINE
200           mysql-ha-test-aurora.cluster-CLUSTER-EXAMPLE... 3306  ONLINE  ← seed
201           mysql-ha-test-aurora-reader.CLUSTER-EXAMPLE...  3306  ONLINE

Both proxysql-1 and proxysql-2 show identical topology within seconds of configuration. The reason isn’t what you might expect.

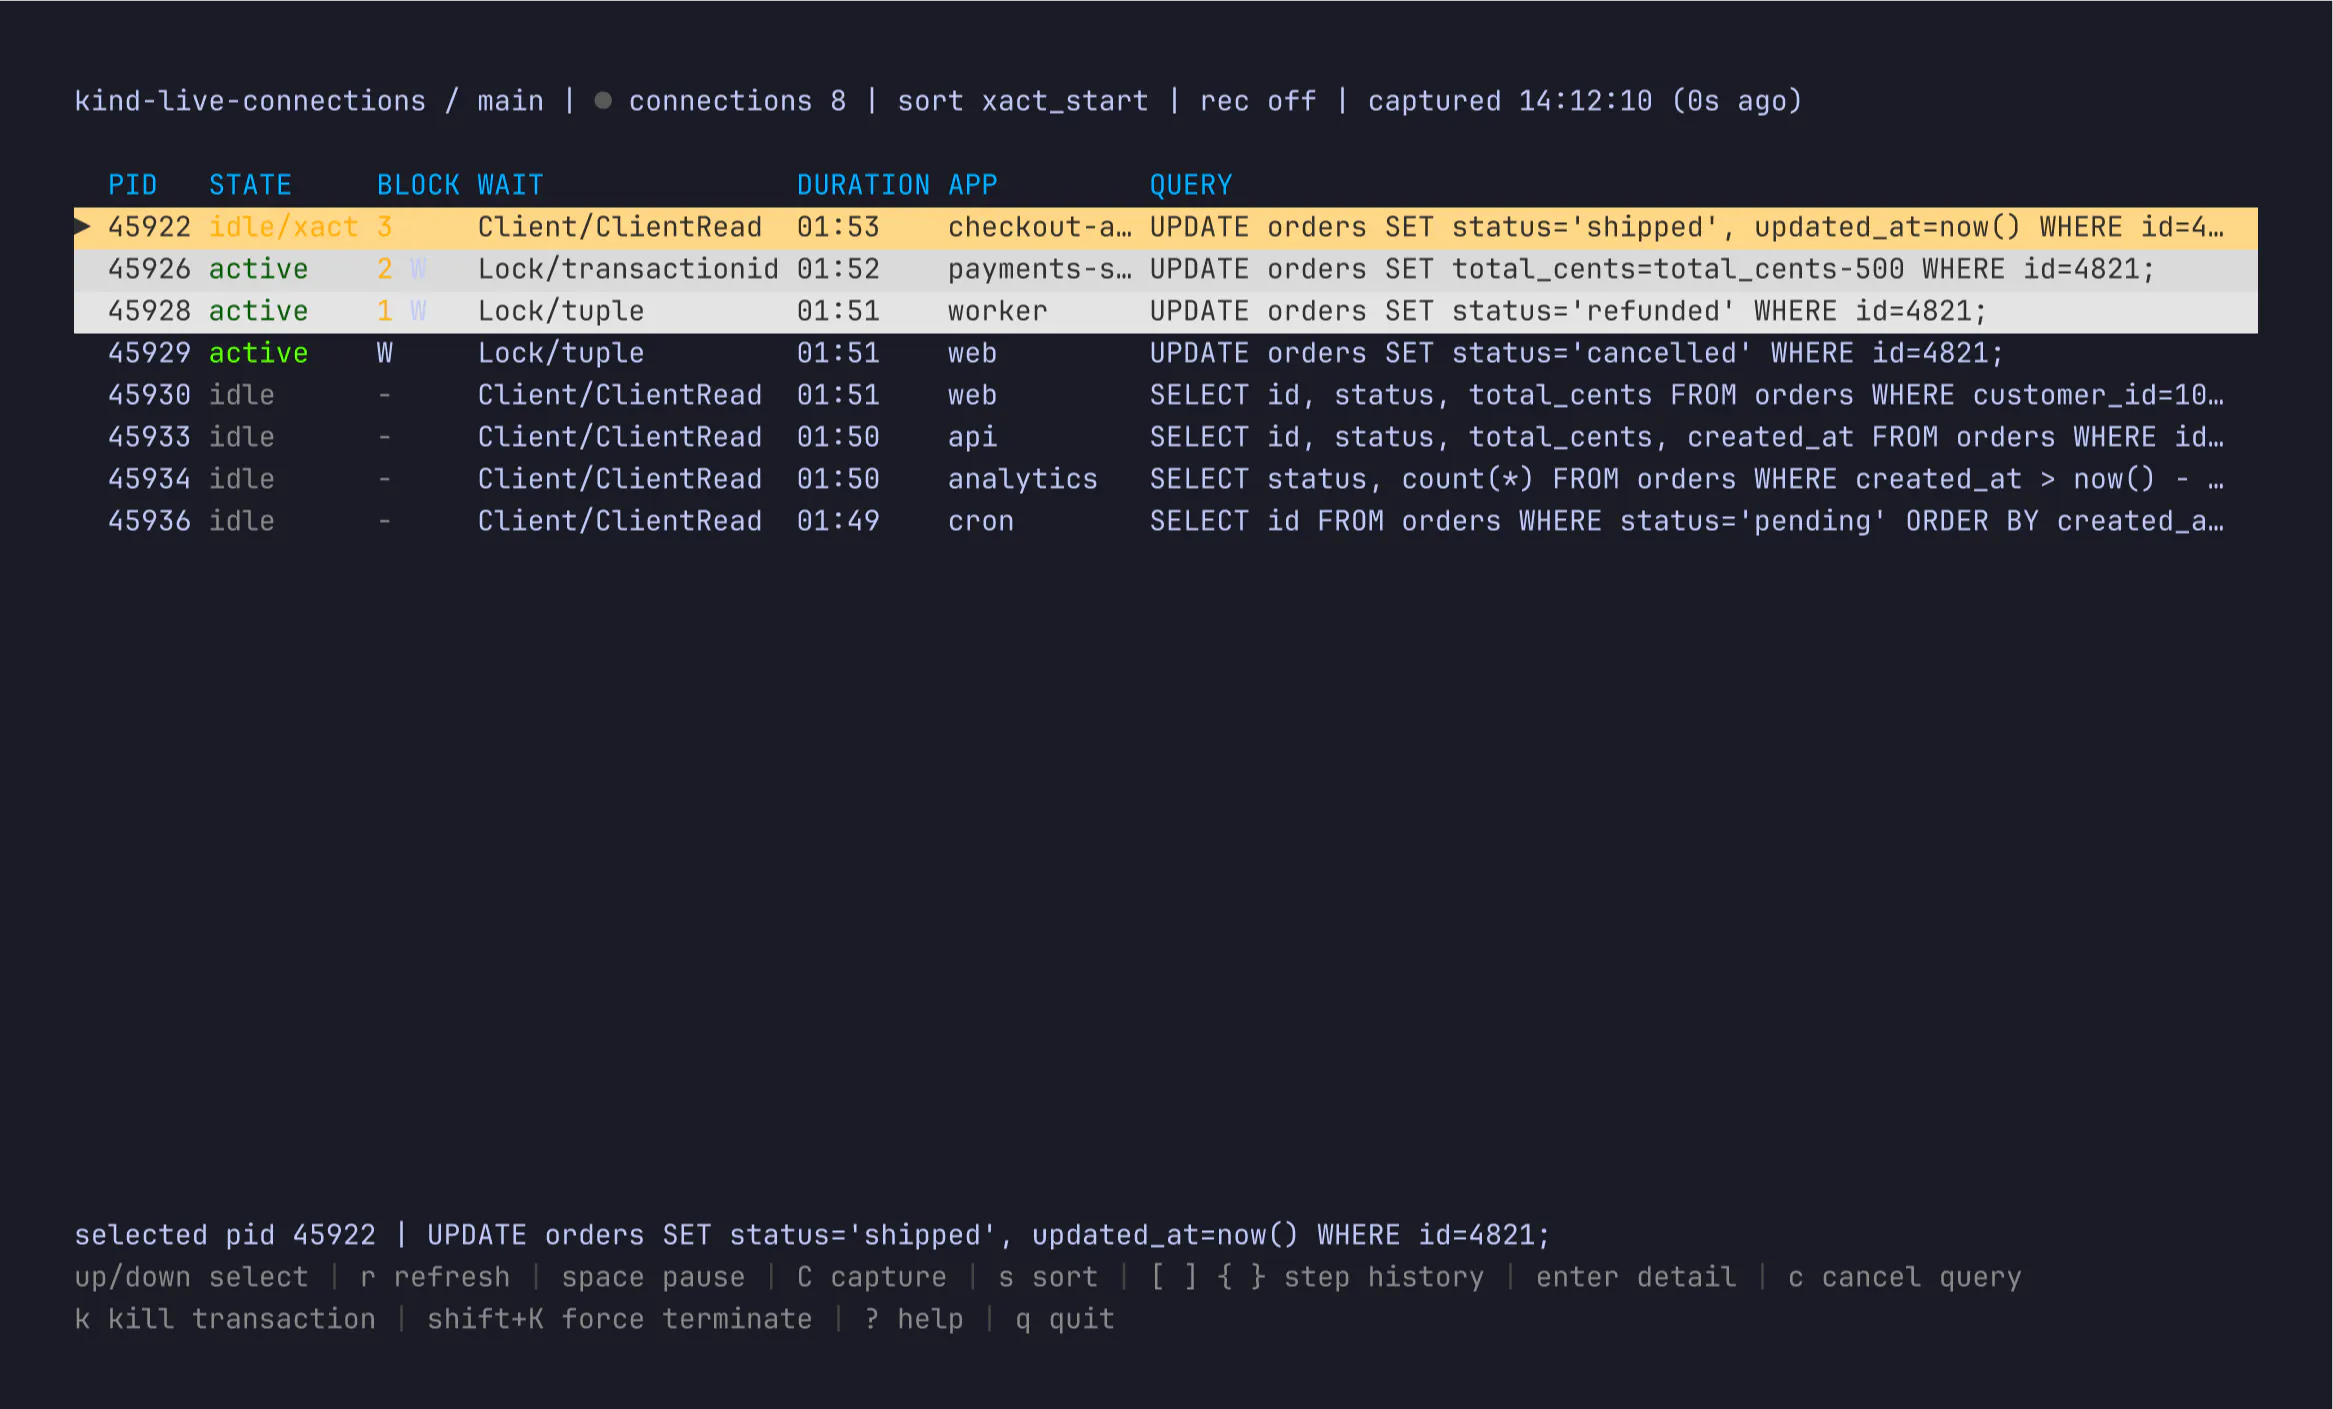
CLUSTER SYNC ISN’T WHAT MAKES BOTH NODES CONVERGE. Both ProxySQL nodes reached identical Aurora topology at T0+15s. That looks like cluster sync working. It isn’t. Each ProxySQL node runs its own independent Aurora monitor thread that queries INFORMATION_SCHEMA.REPLICA_HOST_STATUS on its own polling schedule. Both threads read the same Aurora metadata — the same SESSION_ID=MASTER_SESSION_ID flip — and independently update their own runtime_mysql_servers. No config change was propagated between nodes during the failover. The convergence is emergent from two monitors reading the same source of truth, not from ProxySQL cluster propagation.

This matters in production: Aurora topology detection works correctly even when cluster sync is degraded or lagging behind. The Aurora monitor subsystem and the ProxySQL Cluster sync subsystem are orthogonal — they share no state and don’t depend on each other. Design your monitoring with that distinction in mind.

The Failover Timeline

Triggered with a single AWS CLI command. T0 is the moment the API accepted the request:

# -- Trigger Aurora cross-AZ failover -- T0 = API accepted (15:32:07 CEST)
aws rds failover-db-cluster --db-cluster-identifier mysql-ha-test-aurora
Marker   Elapsed   Event
------   -------   -----
T0       +0.0s     failover-db-cluster API accepted
         +3.1s     Aurora: "Started cross AZ failover to aurora-reader"
         +8.7s     Writer endpoints SHUNNED on both proxysql-1 and proxysql-2
         +15.0s    Topology flip: aurora-reader → HG 200 ONLINE, old writer → HG 201
         +22.2s    Aurora: "Completed customer initiated failover to aurora-reader"

Two milestones, not one. ProxySQL marked the old writer SHUNNED at T0+8.7s — it knew the writer was unreachable. The full topology flip — old writer demoted to HG 201, new writer promoted to HG 200 — landed at T0+15s, on the next successful poll of REPLICA_HOST_STATUS after Aurora completed the internal promotion. SHUNNED means "I can’t reach this backend right now." The topology flip means "I’ve confirmed, from Aurora’s own metadata, who the new writer is." The gap between them is Aurora’s internal promotion time — the same floor discussed in Part 2’s detection math section. ProxySQL was polling on schedule throughout; the backends were simply unreachable while Aurora was mid-promotion.

The SHUNNED state explains why errors appeared at ~T0+6s, before SHUNNED was recorded at T0+8.7s. ProxySQL routes a query to a backend before detecting its failure — the SHUNNED state is set after a health check fails, not preemptively. Queries that attempted new handshakes in the window between when the writer became unreachable and when ProxySQL formally recorded it got the handshake failure directly.

Three Errors Across 2,020 Queries

Two load generators ran simultaneously — one through proxysql-1:6033, one through proxysql-2:6033 — at 5 SELECTs/second each throughout the failover window.

Proxysql-1: 1 error. Proxysql-2: 2 errors. All three were ERROR 2013 (HY000): Lost connection to server at 'handshake: reading initial communication packet' — new connection attempts during the SHUNNED window that hit an Aurora backend mid-promotion. Queries running on existing multiplexed backend connections continued without error. ProxySQL’s connection multiplexing kept those backend connections alive through the SHUNNED window; only new handshakes failed.

The comparison to Part 2: that run used a single ProxySQL node and recorded 2 errors in 1,485 queries (~0.13% error rate). This run used two nodes and recorded ~3 errors across 2,020 queries (~0.15% error rate). Adding a second ProxySQL node didn’t change the error ratio in any meaningful way. The bottleneck isn’t the proxy layer — it’s Aurora’s internal promotion window, which is identical regardless of how many ProxySQL nodes are in front of it.

RDS Multi-AZ: The 64-Second Baseline

The RDS Multi-AZ configuration in ProxySQL is simpler than Aurora’s: one hostgroup (HG 300), one server row, no topology discovery table. The endpoint DNS is the failover mechanism — after the standby promotes, the same DNS name resolves to the new primary. ProxySQL doesn’t need to change anything.

-- HG 300 for RDS Multi-AZ — single endpoint, no topology discovery needed
INSERT INTO mysql_servers (hostgroup_id, hostname, port, comment)
VALUES (
  300,
  'mysql-ha-test-rds-multiaz.CLUSTER-EXAMPLE.us-east-1.rds.amazonaws.com',
  3306,
  'rds-multiaz'
);
LOAD MYSQL SERVERS TO RUNTIME; SAVE MYSQL SERVERS TO DISK;

Failover triggered via reboot-db-instance --force-failover. T0 is the moment the API accepted:

Marker   Elapsed   Event
------   -------   -----
T0       +0s       reboot-db-instance --force-failover (15:37:16 CEST)
         +10s      AWS: "Multi-AZ failover started"
         +25s      AWS: "DB instance restarted"
         +64s      AWS: "Multi-AZ instance failover completed"

Post-failover, runtime_mysql_servers shows HG 300 ONLINE again with the same hostname and port. From ProxySQL’s perspective, the backend went unavailable and came back. No hostgroup changes, no topology flip, no epoch updates required.

Two limitations worth naming explicitly. First, the standby isn’t readable during normal operation. You pay for a full second instance — same CPU, memory, and storage class — and receive zero read capacity in return. ProxySQL can distribute reads across Aurora reader instances; it can’t read from an RDS Multi-AZ standby because Aurora’s architecture makes it deliberately inaccessible. Second, the 64-second resolution window goes through DNS — ProxySQL isn’t aware of the topology change until the DNS TTL expires and the endpoint resolves to the new primary. The 4× failover gap and the zero read capacity are the two concrete reasons to prefer Aurora when active read scaling and fast application-visible failover both matter.

TLS on ProxySQL-to-Aurora Backend Connections

What Aurora MySQL Actually Enforces

Aurora MySQL 3 supports TLS and most clients negotiate it automatically — the default cipher from the Lima VMs was TLSv1.3 / TLS_AES_256_GCM_SHA384. But "supports by default" is not "enforces by default." In this lab cluster, require_secure_transport=OFF is the factory setting, and a connection opened with --ssl-mode=DISABLED succeeded with an empty Ssl_cipher. Enforcement requires require_secure_transport=ON set explicitly at the cluster parameter group level. Don’t assume Aurora encrypts backend connections without checking the parameter group.

Configuring ProxySQL for Backend TLS

Two ProxySQL settings control proxy-to-server TLS. mysql-have_ssl=true enables TLS capability on backend connections where TLS can be negotiated. mysql-ssl_p2s_ca provides the CA bundle ProxySQL uses to verify the server certificate. Together they give you encrypted, certificate-verified backend connections.

Aurora provides a CA bundle containing all AWS certificate authorities. Download it and copy it to the ProxySQL VM:

# Download the AWS RDS global CA bundle (162KB, 108 CAs as of May 2026)
curl -o /tmp/aurora-global-bundle.pem \
  https://truststore.pki.rds.amazonaws.com/global/global-bundle.pem

sudo mkdir -p /etc/proxysql/certs
sudo cp /tmp/aurora-global-bundle.pem /etc/proxysql/certs/
-- Configure backend TLS on proxysql-1 (cluster sync carries it to proxysql-2)
SET mysql-have_ssl=true;
SET mysql-ssl_p2s_ca='/etc/proxysql/certs/aurora-global-bundle.pem';
LOAD MYSQL VARIABLES TO RUNTIME;
SAVE MYSQL VARIABLES TO DISK;

Per-server TLS is also controlled by use_ssl in mysql_servers: setting use_ssl=1 on a row tells ProxySQL to use TLS for that specific backend. The interaction with Aurora’s auto-discovery is where it gets complicated — and where the footgun lives.

Certificate Verification Behavior

Direct-connection tests to Aurora to verify behavior before relying on ProxySQL config:

Test ssl-mode flag CA bundle Result
Default TLS none none TLSv1.3 / TLS_AES_256_GCM_SHA384
TLS disabled --ssl-mode=DISABLED none Accepted — Ssl_cipher empty
VERIFY_CA — correct bundle --ssl-mode=VERIFY_CA aurora-global-bundle.pem SUCCESS — TLSv1.3
VERIFY_CA — wrong CA --ssl-mode=VERIFY_CA system CAs (no AWS roots) ERROR 2026: certificate verify failed

AUTO-DISCOVERY DEFEATS PER-SERVER TLS SETTINGS — VERIFY IN runtime_mysql_servers. When mysql_aws_aurora_hostgroups is active, the Aurora monitor thread populates runtime_mysql_servers with rows for every discovered endpoint. Those auto-discovered rows are created with use_ssl=0, regardless of any use_ssl=1 you set in mysql_servers for manually-inserted entries.

Lab evidence: after UPDATE mysql_servers SET use_ssl=1 WHERE hostgroup_id IN (200,201); LOAD MYSQL SERVERS TO RUNTIME;, the static cluster endpoint seed kept use_ssl=1 in the runtime table. The auto-discovered reader and writer endpoints appeared with use_ssl=0. The Aurora monitor thread owns those rows and resets them on each discovery cycle.

The reliable enforcement path is mysql-have_ssl=true combined with mysql-ssl_p2s_ca. These are global defaults that apply to all backend connections capable of negotiating TLS, including auto-discovered endpoints. Per-server use_ssl is not the enforcement mechanism when Aurora auto-discovery is active. After any Aurora configuration change, verify with:

SELECT hostgroup_id, hostname, port, use_ssl
FROM runtime_mysql_servers
WHERE hostgroup_id IN (200, 201)
ORDER BY hostgroup_id, hostname;

A row showing use_ssl=0 on an auto-discovered endpoint isn’t unencrypted if mysql-have_ssl=true is set — it means TLS is negotiated via the global setting, not the per-server flag. But if mysql-have_ssl is false or unset, that same row is sending plaintext and won’t tell you.

Running Aurora MySQL behind ProxySQL in production?

The TLS footgun in auto-discovery is one of several configuration details that fail silently without surfacing an error. If you want a second pair of eyes on your ProxySQL configuration before it handles production Aurora failovers, book a free assessment call.

Book Free Assessment →

Query Mirroring: No Measurable Impact on the Primary Path

Query mirroring in ProxySQL routes each matched query to a secondary hostgroup simultaneously — fire-and-forget, results discarded, the calling application never knows. The mirror_hostgroup column in mysql_query_rules activates it per rule. This section is the latency measurement.

100 queries with mirroring active to a secondary hostgroup: 3,907ms total / 39ms average. 100 queries without mirroring: 4,081ms total / 40ms average. Delta: −174ms total, −1ms per query — within measurement noise and not a meaningful latency penalty.

ProxySQL sends mirrored queries from a separate goroutine. The primary query’s result is returned to the client immediately; the mirror is dispatched independently with no serialization point on the primary path. If the mirror hostgroup is unavailable, the primary path is unaffected. Enabling mirroring to a staging Aurora cluster or a new version under evaluation doesn’t require a performance conversation with your application team. The only cost is backend resources on the mirror target itself.

What’s Not in This Part

Three topics are deferred to Part 5 by design:

  • Production monitoring — querying stats_mysql_query_digest for latency baselines, alerting on Aurora detection gaps via mysql_server_aws_aurora_log, and dashboards for connection pool headroom → Part 5
  • check_interval_ms production sizing — this part used check_interval_ms=5000; Part 5 covers sizing it based on observed Aurora promotion time from your own event history → Part 5
  • Rolling upgrade runbook — how to upgrade the ProxySQL binary on one node without taking the proxy layer offline, including NLB drain sequencing → Part 5

What’s Next

In Part 5, the system from Parts 1–4 is running and has been through a failover. Part 5 is about knowing it’s healthy: stats_mysql_query_digest for query latency baselining, mysql_server_aws_aurora_log for Aurora detection gap alerting, max_lag_ms tuning for excluding lagging readers under replication pressure, the rolling ProxySQL upgrade sequence, and the production-sizing decisions for check_interval_ms and multiplexing variables that weren’t worth making until the system had been under load.

M

Mario — ReliaDB

ReliaDB is a specialist DBA team for PostgreSQL and MySQL performance, high availability, and cloud database optimization. More about ReliaDB →

Planet for the MySQL Community

ProxySQL in Front of AWS RDS & Aurora MySQL — Part 5: Monitoring, Tuning, and Troubleshooting

https://reliadb.com/images/og-default.png

The system is running. ProxySQL in front of Aurora, query rules routing reads to replicas, the two-node cluster syncing config in ~600ms, TLS on the backend leg. Four parts to reach this point. The question shifts now: how do you know it’s still working correctly at 3am on a Sunday — and when it isn’t, where do you look?

This part covers the operational layer. The same Lima lab topology from Parts 1–4 runs throughout: dbdeployer MySQL 8.0.41 sandbox (master on port 25001, two replicas on 25002 and 25003), ProxySQL 2.7.3 on proxysql-1 and proxysql-2, backends in HG 10 (writer) and HG 20 (readers). No AWS resources — Part 5 is fully local. The Aurora-specific captures referenced in Section 2 are reused from Parts 2 and 4, cited explicitly.

The System from Parts 1–4 — and What Part 5 Adds

Part 1 made the placement decision. Part 2 wired ProxySQL to Aurora’s native topology discovery — mysql_aws_aurora_hostgroups, REPLICA_HOST_STATUS, 2 errors across 1,485 queries through a live failover. Part 3 built the query routing layer: mysql_query_rules, the ordering rule for SELECT ... FOR UPDATE, transaction_persistent, and the exact conditions that break multiplexing. Part 4 tested the full HA stack under pressure — Aurora at T0+15s, RDS Multi-AZ at T0+64s, TLS footguns in auto-discovery, and NLB health check timing that says 90 seconds in the docs but measured 110 in the lab.

Part 5 adds three things those parts explicitly deferred: the monitoring layer you query to know the system is healthy, the tuning decisions now grounded in observed behavior, and the recovery path for the most common non-obvious production failure mode.

The Monitoring Layer: What to Watch and Why

Three tables cover health at different granularities. Together they answer: is my proxy routing correctly, how loaded is my backend pool, and did my Aurora topology discovery run cleanly?

stats_mysql_query_digest: Workload Shape and Latency Baselines

-- Tested on Lima VMs, MySQL 8.0.41 via dbdeployer, ProxySQL 2.7.3, 2026-05-10

stats_mysql_query_digest accumulates per-digest statistics for every query ProxySQL routes. The primary uses are identifying slow queries by total time spent and reading the shape of your workload — which hostgroups are receiving traffic and in what proportions.

The two captures below show the same ProxySQL instance under two workload patterns. Both are correct behavior. The point is that monitoring tells you which shape you have; your job is to verify it matches what you expect.

Shape A — Transactional workload with transaction_persistent=1 (Part 5 lab, 20 sysbench threads, 300s oltp_read_write):

-- stats_mysql_query_digest on proxysql-1 — top 5 by sum_time, 300s oltp_read_write load
-- Note: all queries land in HG 10 — see analysis below
hostgroup  schemaname  digest_text                                count_star  avg_time_us
10         lab_test    SELECT c FROM sbtest1 WHERE id=?           193270      1936
10         lab_test    SELECT c FROM sbtest2 WHERE id=?           193150      1929
10         lab_test    SELECT c FROM sbtest4 WHERE id=?           191770      1940
10         lab_test    SELECT c FROM sbtest3 WHERE id=?           192110      1927
10         lab_test    COMMIT                                      77046      4280

Every query — including the SELECT statements — landed in HG 10 (the writer). HG 20 (readers) received 644 total executions against 247,593 for HG 10. This is not a routing misconfiguration. The oltp_read_write workload wraps every statement inside BEGIN … COMMIT. With transaction_persistent=1 set on the app user, ProxySQL pins all queries in a detected transaction to the same hostgroup — the writer, where the transaction opened. The reads never had an opportunity to fan out to replicas because the transaction boundary kept them anchored.

The corresponding connection pool snapshot confirms this:

-- stats_mysql_connection_pool on proxysql-1 (mid-load, 20 sysbench threads)
hostgroup  srv_host       srv_port  status  ConnUsed  ConnFree  ConnOK  Latency_us
10         192.168.105.6  25001     ONLINE  20        0         20      2489
20         192.168.105.6  25002     ONLINE   0        12        12      2556
20         192.168.105.6  25003     ONLINE   0         9         9      2445

ConnUsed=20 on HG 10 — one backend connection per sysbench thread, held for the duration of each active transaction. ConnUsed=0 on both replicas — they’re healthy and connected, but receiving no queries.

Shape B — Idle multiplexing baseline (from the Part 3 lab, 100 Python threads, SELECT 1, no session state — reused for comparison):

-- stats_mysql_connection_pool on proxysql-1 (T0+10s, 100 idle frontends, no session state)
-- Source: Part 3 A.5 capture — reused for baseline comparison
hostgroup  srv_host       srv_port  ConnUsed  ConnFree
10         192.168.105.6  25001     0         100
20         192.168.105.6  25002     0          42
20         192.168.105.6  25003     0          61

One hundred frontend sessions open. Zero backend connections pinned to any of them. After SELECT 1 completed, ProxySQL returned all connections to the free pool — the frontends are connected, they just don’t hold a MySQL thread on the other side.

The diagnostic question these two shapes answer: if you expect reads to distribute across replicas but HG 20 shows ConnUsed=0 and stats_mysql_query_digest shows all executions in HG 10, check transaction_persistent first, then check whether your ORM or application wraps reads inside explicit transactions. Both shapes above represent correct behavior for their respective workloads. The monitoring tells you which one you’re looking at.

The two queries to run routinely:

-- Top 10 queries by total time spent — identifies slow-query candidates
SELECT hostgroup, schemaname, username, digest_text,
       count_star,
       ROUND(sum_time / count_star) AS avg_time_us,
       max_time
FROM stats_mysql_query_digest
ORDER BY sum_time DESC
LIMIT 10;

-- Per-hostgroup execution distribution — reveals workload shape
SELECT hostgroup,
       COUNT(DISTINCT digest)    AS unique_queries,
       SUM(count_star)           AS total_executions
FROM stats_mysql_query_digest
GROUP BY hostgroup
ORDER BY hostgroup;

Rising avg_time_us on a digest that was previously stable is the early slow-query signal. Unexpected hostgroup skew — all traffic in HG 10 when you expect a 70/30 read split — tells you to check transaction_persistent or your query rules before blaming the backends.

mysql_server_aws_aurora_log: Topology Detection and Gap Alerting

monitor.mysql_server_aws_aurora_log is the only table that shows Aurora topology discovery in real time. ProxySQL writes a row every check_interval_ms for each backend it polls. It’s the authoritative record of whether ProxySQL is successfully reading INFORMATION_SCHEMA.REPLICA_HOST_STATUS — and how long each poll took.

-- monitor.mysql_server_aws_aurora_log — healthy polling pattern (3-row excerpt)
-- Source: Part 2 live Aurora lab capture, 2026-05-08 (reused — no AWS resources in Part 5)
SELECT check_utc, hostname, is_writer_per_replica_host_status AS writer_detected, lag_ms
FROM monitor.mysql_server_aws_aurora_log
ORDER BY check_utc DESC
LIMIT 3;
check_utc               hostname (polled)                           writer_detected              lag_ms
2026-05-08 10:53:16     proxysql-aurora-EXAMPLE-writer.EXAMPLE...  proxysql-aurora-EXAMPLE-writer   0
2026-05-08 10:53:14     proxysql-aurora-EXAMPLE-reader.EXAMPLE...  proxysql-aurora-EXAMPLE-writer   0
2026-05-08 10:53:12     proxysql-aurora-EXAMPLE-reader.EXAMPLE...  proxysql-aurora-EXAMPLE-writer   0

A healthy pattern: rows appear at roughly check_interval_ms intervals, writer_detected is consistent across all rows in a given window, and lag_ms stays low or zero. The 6-second detection gap from the Part 2 and Part 4 failover captures appeared in this table exactly: ProxySQL polled on schedule throughout, but Aurora’s backends were unreachable mid-promotion, so no rows appear between 10:53:10 and 10:53:16. Section 3 covers how to size check_interval_ms against that observed promotion floor.

Detection gap alerting rule: alert when no successful poll row appears for more than 2×check_interval_ms. At check_interval_ms=2000, that’s a 4-second silence. Any gap longer than that means ProxySQL either can’t reach the backend or Aurora’s control plane is mid-promotion. This is the right threshold to wire into your monitoring system — not a static time value, but a function of your configured polling interval.

SCHEMA NOTE: mysql_server_aws_aurora_log lives in the monitor schema, not in main or stats. Use SELECT ... FROM monitor.mysql_server_aws_aurora_log. The table main.mysql_server_aurora_log does not exist in ProxySQL 2.7.3. This footgun was documented in Part 2 during the auto-discovery setup.

stats_mysql_connection_pool and stats_mysql_processlist: Pool Headroom

stats_mysql_connection_pool answers the connection budget question: how close am I to exhausting the backend pool? The ConnUsed / (ConnUsed + ConnFree) ratio is the headroom metric. The mid-load capture from the Part 5 lab shows the pattern for a transactional workload:

-- stats_mysql_connection_pool on proxysql-1 (mid-load, 20 threads, oltp_read_write)
-- Tested on Lima VMs, MySQL 8.0.41 via dbdeployer, ProxySQL 2.7.3, 2026-05-10
hostgroup  srv_host       srv_port  status  ConnUsed  ConnFree  ConnOK  ConnERR  Queries   Latency_us
10         192.168.105.6  25001     ONLINE  20        0         20      0        181493    2489
20         192.168.105.6  25002     ONLINE   0        12        12      2280     116       2556
20         192.168.105.6  25003     ONLINE   0         9         9      2230     83        2445

A few readings worth calling out. ConnERR of 2,280 and 2,230 on the replicas are artifacts of earlier lab sessions, not live failures — verify by watching whether they increment during active load. If ConnERR climbs alongside a ConnUsed spike, that’s a backend connectivity problem. If it’s static, it’s historical noise.

Latency_us is the proxy-measured round-trip for health checks to each backend. Rising latency on one backend before rising ConnERR is the early warning signal: the backend is struggling before it starts failing checks. At 2,489µs on the master and ~2,500µs on the replicas, latency is healthy and symmetric in this capture.

Pool headroom alert threshold: flag when ConnUsed / (ConnUsed + ConnFree) > 0.8 sustained for more than 30 seconds on any hostgroup. Below 0.5 at steady state is healthy. Above 0.8 means you’re approaching the connection ceiling — either raise max_connections in mysql_servers, add a backend, or reduce transaction_persistent scope if the workload allows it.

stats_mysql_processlist gives the live per-session view — which hostgroup each frontend session is currently assigned to and what command it’s running:

-- stats_mysql_processlist on proxysql-1 (mid-load snapshot)
SELECT SessionID, user, db, hostgroup, command, time_ms, info
FROM stats_mysql_processlist
ORDER BY time_ms DESC
LIMIT 10;

During the Part 5 sustained load, all 20 sessions showed hostgroup=10 with a mix of Execute and Sleep states. A session in Sleep with time_ms climbing means it’s holding an open backend connection without issuing queries — the cost of transaction_persistent=1 in a slow-consumer application. Use processlist during incidents to see exactly which sessions are holding pool resources and which queries are actively executing.

Production Sizing: Polling Intervals, Lag Thresholds, Multiplexing

The right values for these variables don’t come from the ProxySQL docs. They come from your own observed promotion time and workload shape. Here’s how to derive them from the data Parts 2–4 already captured.

check_interval_ms: Sizing Against the Promotion Floor

The detection latency formula from Part 2’s detection math section:

detection latency = Aurora internal promotion time (~6s, opaque to ProxySQL)
                  + at most one check_interval_ms cycle

Aurora’s internal promotion time is the floor — ProxySQL was polling on schedule throughout both the Part 2 and Part 4 failovers, but the backends were simply unreachable while Aurora was mid-promotion. Lowering check_interval_ms below 1000ms adds polling load on Aurora’s INFORMATION_SCHEMA without meaningfully reducing detection latency — the floor is Aurora’s promotion time, and that’s set by instance class and cross-AZ replication state, not polling frequency.

check_interval_ms controls the worst-case additional lag on top of that floor:

check_interval_ms Worst-case detection Typical use case
2000ms (2s) ~8s Most production workloads — low overhead, tight detection
5000ms (5s) ~11s Cost-sensitive setups; 3s of additional lag vs. 2000ms is acceptable for many apps
10000ms (10s) ~16s Background or batch Aurora clusters where sub-15s detection isn’t required

The Part 2 lab used check_interval_ms=2000; Part 4 used 5000. Both labs produced identical detection floors because the constraint was Aurora’s ~6-second internal promotion, not polling frequency. Choose based on the detection window your application’s connection pool and retry logic can tolerate — not on the assumption that faster polling reduces the floor. check_timeout_ms must also remain below check_interval_ms and at or below 3000ms (ProxySQL 2.7.3 enforces this with a CHECK constraint; a silent INSERT failure is the symptom if you exceed it, as documented in Part 4).

Lag Thresholds: max_replication_lag vs max_lag_ms

These are two different columns in two different tables with different units. Conflating them produces a config that looks correct but either does nothing or clips reads far more aggressively than intended.

Column Table Unit Scope What it controls
max_replication_lag mysql_servers seconds Standard MySQL replication SHUNNED when Seconds_Behind_Source > max_replication_lag
max_lag_ms mysql_aws_aurora_hostgroups milliseconds Aurora only (REPLICA_HOST_STATUS) Excludes reader from HG when replica_lag_in_milliseconds > max_lag_ms

The footgun: max_lag_ms=600000 in mysql_aws_aurora_hostgroups means 600000 milliseconds (= 600 s = 10 minutes of acceptable Aurora replica lag) — a generous lab default from Part 2; the column name carries the _ms unit. The sibling knob mysql_servers.max_replication_lag is in whole seconds for standard replication lag. Copying the numeric literal 600000 from max_lag_ms into max_replication_lag does not mean “10 minutes”; it means 600000 seconds (about 7 days). Your replicas would have to lag roughly a week before ProxySQL excluded them from routing.

Lab result for max_replication_lag: with max_replication_lag=2 set on replica2 (port 25003) and the replica’s SQL thread stopped, Seconds_Behind_Source returns NULL. ProxySQL treats NULL as 60 seconds of lag by default — so a stopped SQL thread suddenly looks like a 60-second-lagging replica even though the underlying data is fine. The variable mysql-monitor_slave_lag_when_null=60 controls this; size it based on how tolerant your application is of reads from a replica whose SQL thread is stopped.

With slave_lag_when_null=60 and max_replication_lag=2, replica2 transitioned to SHUNNED within one monitor_replication_lag_interval cycle (10 seconds) after the SQL thread was stopped. The status was SHUNNED, not OFFLINE_SOFT — that’s the actual ProxySQL 2.7.3 behavior for lag-threshold violations. Reads stopped routing to replica2 immediately; replica1 absorbed them cleanly.

Recovery after START REPLICA SQL_THREAD: replica2 returned to ONLINE in approximately 72 seconds — about 7× the 10-second monitor_replication_lag_interval, as the lag counter drained across multiple polling cycles before ProxySQL confirmed it was clear. Recovery time is bounded by monitor_replication_lag_interval × monitor_replication_lag_count polling cycles, not by a fixed timeout.

transaction_persistent and Multiplexing Variables

The Part 5 sysbench capture (all traffic in HG 10) makes the transaction_persistent tradeoff concrete. With transaction_persistent=1, queries inside an open transaction stay on the writer. This is correct for application accounts that hold real transactions — the alternative, allowing in-transaction reads to jump to a replica, would route a SELECT to a server that doesn’t yet have the transaction’s uncommitted writes visible, which produces inconsistent reads without any error. Don’t set transaction_persistent=0 for application accounts that use explicit transactions or that issue DML.

Set transaction_persistent=0 for analytics or reporting accounts that connect, run a read, and disconnect — no open transactions, no consistency hazard. This is the same analytics user pattern from Part 3.

Two monitor variables worth knowing for the lag and health check rhythm:

  • mysql-monitor_ping_interval=10000 (10s default): how often ProxySQL sends COM_PING to each backend on existing connections. With mysql-monitor_ping_max_failures=3, three consecutive ping failures trigger SHUNNED — a 30-second window of consistently-failing pings before a backend is excluded.
  • mysql-wait_timeout=28800000 (8 hours): how long ProxySQL keeps backend connections alive. This means a credential change on the MySQL side doesn’t immediately invalidate existing ProxySQL connections — they continue using the cached auth until the connections cycle out or a new connection attempt fails. Section 5 covers exactly what this looks like when it’s the monitor user whose credentials change.

Rolling Upgrade Runbook

LAB NOTE: ProxySQL 2.7.3 was the latest available 2.7.x package in our apt repository at time of writing — there was no newer minor version to upgrade to. The runbook below is the canonical drain/upgrade/restore procedure for any binary upgrade; only the apt-get install proxysql=2.7.X version string changes. We executed the full cycle on both nodes to verify timing and zero-error behavior on a properly-configured client.

ZERO ERRORS, ~25 SECONDS PER NODE: A Linux MySQL 8.0 client running queries against both ProxySQL nodes throughout the upgrade window saw 0 errors across 40 requests during post-upgrade verification. Per-node cycle from drain to restored: ~26 seconds on node 1, ~20 seconds on node 2. The surviving node handled all traffic seamlessly during each drain window.
Note: a macOS MySQL 9.5 client in the test harness produced ERROR 2059 (HY000): Authentication plugin 'mysql_native_password' cannot be loaded errors — the mysql_native_password.so plugin was removed from MySQL 9.x. These are client-side errors unrelated to ProxySQL behavior, confirmed by parallel testing from the Linux client which saw 0 errors.

Step 1 — Capture pre-upgrade baseline. Record the version and connection pool state on both nodes before touching anything. If something goes wrong during the upgrade, this snapshot is your reference point.

-- Pre-upgrade version baseline on both nodes (proxysql-1 shown)
-- Tested on Lima VMs, ProxySQL 2.7.3, 2026-05-10
SELECT @@version;
-- 2.7.3-12-g50b7f85

SELECT hostgroup, srv_host, srv_port, status, ConnUsed, ConnFree
FROM stats_mysql_connection_pool
ORDER BY hostgroup, srv_port;

Step 2 — Start background traffic. Run a SELECT loop from your client against both ProxySQL nodes simultaneously. Log every response with a timestamp — this is the evidence trail that quantifies the upgrade’s error window. In production, your application’s existing traffic serves this purpose; in a maintenance window, an explicit probe script gives you a clean record.

Step 3 — Drain proxysql-1. In production: deregister proxysql-1 from the NLB target group first (NLB default connection draining: 30 seconds). Wait for in-flight connections to finish, then stop the service. The NLB routes all new connections to proxysql-2 from the moment the target is deregistered. In the lab, where there’s no NLB, stopping the service directly simulates this:

# Drain proxysql-1 (lab simulation of NLB target deregistration + service stop)
# Production: deregister from NLB first, wait for connection draining, then stop
sudo systemctl stop proxysql

Verify proxysql-1 is unreachable on port 6033 and proxysql-2 is serving normally before proceeding. Part 4’s NLB section covers the 110-second real-world detection window versus the theoretical 90-second threshold — size your drain window accordingly.

Step 4 — Upgrade the binary.

# Upgrade ProxySQL binary (replace 2.7.X with your target version)
sudo apt-get install proxysql=2.7.X

Step 5 — Start the service and verify cluster sync. After systemctl start proxysql, the restarted node bootstraps from its peer automatically — given a populated proxysql_servers table and matching cluster credentials, it fetches the current runtime config from proxysql-2 within the cluster’s check_interval_ms window (~600ms in our lab from Part 4).

# Start ProxySQL after upgrade; cluster sync bootstraps from peer automatically
sudo systemctl start proxysql
-- Verify cluster sync on the restarted node: runtime_mysql_servers should match proxysql-2
SELECT hostgroup_id, hostname, port, status
FROM runtime_mysql_servers
ORDER BY hostgroup_id, port;

If runtime_mysql_servers shows the master (port 25001) in both HG 10 and HG 20 after restart, that’s expected: mysql-monitor_writer_is_also_reader=true places the master in both the writer and reader hostgroups. It’s not a routing anomaly — it reflects the ProxySQL default that allows reads to land on the writer when both replicas are lagging or SHUNNED.

If mysql_servers doesn’t arrive on the restarted node, check whether admin-cluster_mysql_servers_sync_algorithm=1 (delta mode) is set and the node has no sync baseline — the bootstrap footgun from Part 4. Set it to 0 temporarily to force a full pull, then restore 1.

Step 6 — Re-register with NLB (production step) and spot-check traffic through the upgraded node.

Step 7 — Repeat for proxysql-2.

Lab timing for both nodes:

Step proxysql-1 proxysql-2
Service stopped 21:01:27Z 21:02:56Z
Service back online 21:01:53Z 21:03:16Z
Total cycle ~26s ~20s

The per-node time includes the apt-get install step. In a real upgrade where the package download is already cached, the binary swap itself takes under 5 seconds — the remaining time is service start, monitor thread initialization, and cluster sync confirmation.

Troubleshooting: When Something Goes Wrong

The most common non-obvious production failure with ProxySQL follows a specific pattern: backends appear SHUNNED or errors start climbing, the instinct is to check Aurora or the MySQL backends directly, but the actual cause lives in a ProxySQL internal table that most DBAs don’t check first. Here’s the diagnostic sequence that surfaces it quickly.

The worked example is monitor user credential revocation. ProxySQL connects to each backend using the monitor user (set via mysql-monitor_username and mysql-monitor_password) to run health checks — COM_PING, SHOW REPLICA STATUS for replication lag, SHOW GLOBAL VARIABLES LIKE 'read_only' for writer detection. If those credentials break — password rotation without updating ProxySQL, a permission change by someone who didn’t know the monitor user was load-bearing — every health check against every backend starts failing simultaneously.

The troubleshooting flowchart:

Symptom: rising errors or SHUNNED backends in runtime_mysql_servers
                │
                ▼
   Step 1: Check runtime_mysql_servers
   ──────────────────────────────────────────────────────
   All ONLINE?
     YES → backend health is fine → check query rules
           and stats_mysql_query_digest for routing anomalies
     NO (SHUNNED present) → continue ↓
   ──────────────────────────────────────────────────────
                │
                ▼
   Step 2: Check mysql_server_connect_log
   ──────────────────────────────────────────────────────
   SELECT hostname, port, time_start_us,
          connect_success_time_us, connect_error
   FROM monitor.mysql_server_connect_log
   ORDER BY time_start_us DESC LIMIT 20;

   connect_error = NULL?
     YES → connect checks are clean → go to ping_log
     "Access denied for user 'monitor'" → FOUND IT
   ──────────────────────────────────────────────────────
                │
                ▼
   Step 3: Confirm with mysql_server_ping_log
   ──────────────────────────────────────────────────────
   SELECT hostname, port, time_start_us,
          ping_success_time_us, ping_error
   FROM monitor.mysql_server_ping_log
   ORDER BY time_start_us DESC LIMIT 20;

   Same "Access denied" pattern? → confirms monitor credentials
   "Gone away" / timeout? → backend connectivity problem
   ──────────────────────────────────────────────────────
                │
                ▼
   Step 4: Verify the monitor user directly on the backend
   ──────────────────────────────────────────────────────
   mysql -h <backend-host> -P <port> -u monitor -p'<pass>' \
     -e "SHOW REPLICA STATUS\G"

   Access denied → confirm which grant is missing
   ──────────────────────────────────────────────────────
                │
                ▼
   Step 5: Restore
   ──────────────────────────────────────────────────────
   On the MySQL backend (run on master; replicated to replicas):
     GRANT REPLICATION CLIENT ON *.* TO 'monitor'@'%';
     GRANT SELECT ON sys.* TO 'monitor'@'%';
     FLUSH PRIVILEGES;

   If the password changed on the MySQL side, also update ProxySQL:
     SET mysql-monitor_password='<new-pass>';
     LOAD MYSQL VARIABLES TO RUNTIME;
     SAVE MYSQL VARIABLES TO DISK;
   ──────────────────────────────────────────────────────

MONITOR-USER REVOCATION: DIAGNOSTIC ORDER

  1. Check runtime_mysql_servers for SHUNNED backends — this is the symptom, not the cause.
  2. Check monitor.mysql_server_connect_log ordered by time_start_us DESC. Look at connect_error. "Access denied for user ‘monitor’" on every recent row is the smoking gun.
  3. Check monitor.mysql_server_ping_log — the same "Access denied" pattern appears here once existing cached backend connections cycle out.
  4. Test the monitor user directly from the ProxySQL node: mysql -h <backend> -u monitor -p'<pass>' -e "SHOW REPLICA STATUS\G" — confirms which specific privilege is missing.
  5. Restore: GRANT the missing privilege on the MySQL backend, FLUSH PRIVILEGES, and if the password changed on the MySQL side, update mysql-monitor_password in ProxySQL global_variables and LOAD MYSQL VARIABLES TO RUNTIME.

What the lab capture shows. After changing the monitor user’s password to an incorrect value on the MySQL backend, monitor.mysql_server_connect_log filled with this pattern on the next connect-check cycle:

-- monitor.mysql_server_connect_log — credential failure in progress
-- connect_interval=60s; errors appear once per cycle on each backend
hostname       port   time_start_us       connect_success_time_us  connect_error
192.168.105.6  25001  1778361407360863    0   Access denied for user 'monitor'@'proxysql-1' (using password: YES)
192.168.105.6  25002  1778361406680516    0   Access denied for user 'monitor'@'proxysql-1' (using password: YES)
192.168.105.6  25003  1778361408042762    0   Access denied for user 'monitor'@'proxysql-1' (using password: YES)

All three backends, same error, every connect-check cycle. That pattern — not one backend, not an intermittent error, but every backend on every cycle — points directly at the monitor credentials, not at backend connectivity.

Auth failures don’t trigger SHUNNED instantly. The connect check fires every mysql-monitor_connect_interval (default 60s), and ProxySQL needs mysql-monitor_ping_max_failures consecutive ping failures before it formally SHUNs a backend. What you see first is the connect log filling with "Access denied" entries — one per polling cycle per backend. That window, from first error to formal SHUNNED, is your diagnostic opportunity. The signal is clear and early; the cascade is gradual by design. A credential problem that would cause a full SHUNNED state on all backends gives you several minutes of warning in mysql_server_connect_log before client traffic starts seeing widespread errors.

Recovery is equally bounded by the polling cycle. After restoring the correct credentials on the MySQL backend, the connect log showed a clean entry 11 seconds after the GRANT was restored — that’s wherever in the 60-second polling cycle the next connect check happened to fire. The range is 0 to mysql-monitor_connect_interval (60s default); expect recovery on the next monitor poll after the fix is applied.

ProxySQL in production and something doesn’t look right?

The monitoring layer takes minutes to query and hours to interpret if you don’t know what healthy looks like. If you’re seeing SHUNNED backends, rising ConnERR, or Aurora detection gaps you can’t explain, a 30-minute call usually narrows it to one root cause.

Book Free Assessment →

What’s Not in This Series

Three topics adjacent to this series are real and important. Each deserves its own treatment.

Sharding. ProxySQL supports basic query-level sharding — routing by schema boundary or by a rule that hashes a user ID into a destination hostgroup. For simple cases this works. For production sharding at scale, with consistent cross-shard transactions and managed schema migrations, this is Vitess territory. ProxySQL’s sharding support is a routing primitive, not a sharding framework.

Multi-region Aurora + ProxySQL. Aurora Global Database places a writer in one region and reader clusters in others, with sub-second replication lag. ProxySQL in front of a Global Database deployment is a different configuration: mysql_aws_aurora_hostgroups scoped per-region, topology discovery that stays local while the primary region is healthy, and failover coordination when a secondary region is promoted to writer. This series covers single-region Aurora only.

PostgreSQL ProxySQL HA. ProxySQL speaks MySQL wire protocol. For PostgreSQL, the equivalent stack is different: see the ProxySQL PostgreSQL HA series which covers the same placement-to-operations arc for PostgreSQL backends.

Across Five Parts

Across five parts, you’ve built and operated a production-representative ProxySQL + Aurora MySQL topology: decided where the proxy layer goes and why, wired it to Aurora’s native topology discovery, tuned query routing and multiplexing against real workload patterns, tested HA under a live failover with a measured error count, and now have the monitoring queries and runbooks to operate it day-to-day.

Three things adjacent to this series worth exploring from here: the Aurora Performance Insights layer for correlating ProxySQL digest data with query execution inside the database engine itself; the ProxySQL Prometheus exporter for time-series dashboards that alert on ConnUsed headroom and detection gaps without manual polling; and slow query log parsing to match ProxySQL’s stats_mysql_query_digest patterns against Aurora’s slow log and identify the same queries from both sides of the proxy.

If you’re standing up ProxySQL in front of RDS or Aurora MySQL and want a second pair of eyes before production traffic, book a free assessment.

M

Mario — ReliaDB

ReliaDB is a specialist DBA team for PostgreSQL and MySQL performance, high availability, and cloud database optimization. More about ReliaDB →

Planet for the MySQL Community

UW DubHacks Next startup incubator produces 20 new student ventures in latest batch

https://cdn.geekwire.com/wp-content/uploads/2026/05/dubhacks-2048×1476.jpg

DubHacks Next Batch 5 founders at Demo Day on May 7 at the University of Washington. (DubHacks Photo)

Senior engineers are retiring faster than companies can replace them, creating a widening expertise gap in industries from aerospace to nuclear energy. 

Hera, a project developed by University of Washington students, is aiming to address the issue with technology that automates the design of parts that meet safety and industry rules, a process that normally requires many years of knowledge and experience. 

The product is timely, as 1.9 million manufacturing jobs are expected to go unfilled in the $2.3 trillion sector by 2033, according to Deloitte.

“Hera answers design questions 10-times faster than a senior engineer,” said Meera Patel, co-creator of Hera. “Once it knows the drawing can be manufactured, it pulls data from all your machines and gives you an exact production plan.”

That’s one of several problems University of Washington students tackled through DubHacks Next, a 16-week startup incubator. On Thursday, May 7, student founders pitched 20 startups hoping to turn their ideas into viable companies.

Since 2022, DubHacks Next has spurred 68 startups and at least 25 active companies. Participants get access to free workshops, mentorship sessions, customer discovery meetings and networking with potential investors. 

This year’s batch of 20 startups includes AI salon receptionists, a student subleasing platform and an emotional recovery app. 

“I’ve never had the experience of building such a large-scale idea and bringing it to life,” said William Pantel, co-developer of Catalvst, an AI audio plugin builder. 

The incubator’s past projects have raised more than $5 million collectively, with alumni going on to join accelerators such as Y Combinator and Techstars or land jobs at major tech companies. 

Starting this year, students could apply to join the Pack Ventures portfolio, including $50,000 up front and $150,000 when another firm buys in. 

Hera co-creators Meera Patel and Noelle So pitch their manufacturing automation tool at DubHacks Next Demo Day. (DubHacks Photo)

Patel and Hera co-creator Noelle So are among the students working with Pack. The demo is now live in three production plants, Patel said.

Here are more standouts from this year’s batch:

Chameleon: For the 1.3 billion people living with disabilities worldwide, nearly 96% of the internet’s top homepages are considered inaccessible. Enter Chameleon, an AI-powered web accessibility tool suite.

The suite includes a Chrome extension with tools like focus rulers, voice commands and head-tracking controls for accessible web navigation on any site, say co-founders Aditya Shirodkar and Ajit Mallavarapu.

“Especially with vibe coding, people are quick to develop software and don’t think about accessibility needs,” Shirodkar told GeekWire. “It’s a silent barrier that isn’t really addressed.” 

Chameleon is entering a market with growing need – and financial opportunity. The global digital accessibility market is estimated at $1.8 billion, and is projected to reach $3.2 billion by 2034, according to Straits Research. 

“It’s not just about making something cool,” Mallavarapu said. “It’s about making something people will actually use every day.”

Iris: Sthiti Patnaik and Saachi Dhamija focused on another technological headache: spreadsheets. 

Universities often rely on sprawling spreadsheets to track alumni for fundraising, networking and event planning, but records quickly become outdated and difficult to search. With Iris, alumni associations and other groups can more easily maintain member databases. 

“We ingest their spreadsheet, then present it in a more visual format with bubbles and graphs,” Dhamija told GeekWire. 

Along with data enrichment and interactive visual mapping for organizers, Iris helps members discover one another through shared experiences and interests. Patnaik, a recent graduate and managing director for DubHacks Next, hopes the solution will help her stay connected to other founders.

“All of our alumni go on to do really fantastic things, such as raise money, start their own startups, or work at really great companies,” she said.

After presenting Iris, Patnaik and Dhamija landed a design partnership with Pack Ventures.

Catalvst: For Aaron Li and William Pantel, the incubator became a launching pad for Catalvst, what may be the first-ever AI audio plugin builder.

High-end audio plugins – software tools that shape and manipulate sound – can cost music producers hundreds or even thousands of dollars. Li, who began producing EDM three years ago, said software costs have delayed his progress.

“I remember working all summer just to save up,” he said. “It’s a domino effect. You get one piece of software, and realize there’s another one you need that’s super expensive.”

With Catalvst, users can describe the sound they want in plain language and generate downloadable, working audio software in under a minute.

“If you’re like, ‘I want my songs to sound like I sing them in a cathedral,’ it’ll create software that makes your song sound like that,” Pantel said.

The founders distinguish their product from AI-generated music platforms, emphasizing that their goal is to empower human creators rather than replace them. They’re currently beta testing with music producers to refine the product and grow its user base.

“We’re using AI to build tools human producers can use,” Pantel said. 

Applications for the incubator’s sixth batch open this fall.

Other Batch 5 startups:

  • BeamBell: AI salon receptionist | Arvin Hakakian, Anant Dhokia, Aur Shalev Merin
  • Clearlobby: Legislative lobbying workspace | Shruthika Balasubramanian
  • Healr: Emotional recovery app | Advait Raman
  • HeartBeats: Music mixing for exercise | Hriesha Popat
  • Intently: Agentic product management | Ronald Luong
  • Leasee: Student-to-student subleasing | Sanjana Satagopan, Annika Chan
  • madr: Campus life app | Abraham Gibson, Azim Memon, Keshav Kalia
  • MindMark: Resource tracking tool | Chandana Robba
  • nomad: Travel social media app | Rahul Bonthu
  • nomi: Roommate management app | Anika Rao, Taj Khandekar, Nandini Sinha, Tharika Jayaraj, Aditi Agarwal, Sophia Zhang
  • Qualty: E2E agentic testing | Jove Pendapotan, Reuben Santoso, Samuel Purnama
  • Query: Q&A tool for live events | Saachi Surana, Shreya Pandey
  • Scout: Camping app | Aditi Agarwal, Anika Rao
  • sparks: Modest fashion shopping | Aleeza Bhatti, Zahra Taher
  • Wallzy: Credit card rewards app | George Evans Daenuwy, Kezia Joesoef, Patrick Wijaya, Calista Vidianto
  • Zither: Spatial web and file browser | Alexander Zhu

GeekWire

How to Safely Start Rock Climbing 

https://i0.wp.com/s3.amazonaws.com/images.gearjunkie.com/uploads/2026/04/shutterstock_1118291951.jpg?w=700&ssl=1

(Photo/Shutterstock)

To thrive and survive outdoors, safety starts the minute you get behind the wheel. Don’t overlook the first, and most critical, rule of the road: Put on your seat belt. Beyond the drive there, an accident-free first climb up a destination crag comes down to etiquette and execution.

Planning and preparation matter, whether the route is in your backyard or at the end of an epic road trip. Here are a few best-practice reminders on how to be a good steward, plus safety keys for moving your rock climbing outdoors, and then coming home alive.  

Gym-to-Crag Safety Tips for an Accident-Free First Climb

Practice cleaning anchors: Most crag-ccidents happen not during the climb, but during the descent. Learn to clean sport anchors without untying yourself from the rope.

Do your checks: Outside, distractions abound — as do half-finished knots. Check each other right before leaving the ground. (And exchange an obligatory fist bump.) 

Come up with a code: On long climbs, you might not be able to hear your partner. Establish a system — i.e, three tugs on the rope means “lower” — ahead of time.

Knot your ends: Tie a barrel knot in each end of the rope before climbing. That way, if your route is longer than it looks, the rope won’t come zipping through the belay device.  

Stand close: Outdoor whippers happen fast. Stand close to the wall while lead-belaying, and spot your partner up to the first bolt. Remember the key to hand-positioning shape when spotting: spoons, not forks.

(Photo/Shutterstock)

Responsibility Reminders 

Leash your pup. Canine companions aren’t as rockfall-aware as we’d like them to be. Make sure your doggo is leashed, especially when your hands are full belaying. 

Share the route. Feel free to bring your whole crew, but be mindful of other groups. Offer to share ropes or let other climbers work in. 

Turn down the volume. We know you have great taste, but some climbers find music distracting. Ask your neighbors before you crank the T-Swift. 

Climbing Tips for Deeper Trips 

Watch your noggin. Helmets are always a good idea, but they become a must when you’re leading in remote environments. 

Respect the local ethic. Every crag has its rules when it comes to ticking holds, bolting, leaving draws, and stashing gear. Check with locals before you make yourself at home.

Pack it out. In places without a ton of moisture, buried deposits don’t decompose. If you’re climbing in an alpine or desert environment, Wag Bag your waste. 

 — See more in The Safety Detail, our film series and full activity guide to surviving and thriving outdoors. 


This article is sponsored by NHTSA: Click It or Ticket. 

GearJunkie

Dolt 2.0

https://static.dolthub.com/blogimages/dolt-2.0-featured.webp/8b951383196a6d74cf2de65ab91afcff56d059907ed7b8516d36ebaa8af5a4b1.webp

Three years ago, we announced Dolt 1.0, signalling that Dolt was ready for production workloads. We haven’t stopped improving the world’s first and only version-controlled SQL database. Today, we are excited to announce Dolt 2.0.

Dolt 2.0

What Did Dolt 1.0 Mean?#

Dolt 1.0 meant four things:

  1. Forward Storage Compatibility
  2. Production Performance
  3. MySQL Compatibility
  4. Stable Version Control Interface

Dolt 2.0 maintains the promises of Dolt 1.0. Dolt 2.0 improves on the performance and correctness metrics established in Dolt 1.0.

What Does Dolt 2.0 Mean?#

Dolt 2.0 also means four things:

  1. Automated Garbage Collection on by Default
  2. Archive Compression on by Default
  3. Faster than MySQL on sysbench
  4. Beta Vector Support
  5. Adaptive Storage

Unlike Dolt 1.0, Dolt 2.0 is fully backwards compatible with all Dolt 1.0 versions. No storage migration using dolt migrate is required. Let’s dive into the details of each of these points.

Garbage Collection#

Dolt makes a lot of disk garbage, especially during import. Dolt is copy-on-write so all intermediate committed transaction state is preserved to disk. Any intermediate state that is not in a Dolt commit is garbage and can be collected.

Garbage

Dolt already must preserve all history in the commit graph on disk. Adding extra garbage can eat through your disk very quickly.

Dolt 2.0 has automatic garbage collection on by default, meaning most users don’t have to care about disk garbage. Many users have been running in this mode for over a year. We’re confident it is stable.

Dolt 2.0 databases do not require extra garbage maintenance, just like other modern SQL engines.

Archives#

Following on the disk space theme, we also have a new on disk format we call archives that can reduce Dolt’s storage footprint by an additional 30-50%. Archives use dictionary compression to de-duplicate storage in the deepest layers of Dolt, saving even more disk space.

As with automatic garbage collection, archives have been the default format for new Dolt databases for months. We’re confident the format is stable and delivers real disk space wins.

Dolt 2.0 databases are kind to your disk with automatic garbage collection and archives. Version control already requires more disk space than traditional databases. Dolt 2.0 preserves that disk for your data’s history.

Faster than MySQL on sysbench#

We’ve long used the industry standard sysbench to measure and benchmark the latency of simple SQL queries in Dolt. We started at about 10X slower on reads and 20X slower on writes than MySQL. We’ve worked tirelessly to improve Dolt’s performance and we are now 13% faster than MySQL on writes and 5% faster on reads, averaging out to 8% faster than MySQL on sysbench style workloads.

Dolt 2.0 databases deliver real production database performance coupled with version control functionality.

Beta Vector Support#

We announced vector index support early last year. We have a much bigger challenge than traditional databases with vector indexes because our vector indexes must be version-controlled. We’ve done the hard computer science to achieve this. We adopted the Vector type from MariaDB in September 2025.

Dolt 2.0 databases have Beta vector support. Dolt is the only database where your vectors are version-controlled. We still have some edge cases on the read query path where a vector index should be used but it is not. Closing these gaps will reove the Beta tag from Dolt’s vector support.

Adaptive storage for large column types#

Borrowing from our Doltgres adaptive storage work to support TOAST types, we’re excited to announce Dolt 2.0 has adaptive storage.

For large column types like TEXT, BLOB, and JSON, databases generally store the value “out of band”, as a file on disk with a pointer to the file in the actual table structure. A different strategy, popularized by Postgres, is to examine the size of the value and store small values in the table structure while preserving the files and pointers strategy for large values. This strategy allows the user to be less disciplined about sizing VARCHAR columns and just use TEXT instead. It’s also a big performance win for these types when the values are small.

Dolt 2.0 has adaptive storage making MySQL databases that use TEXT, BLOB, GEOMETRY, or JSON columns a good fit regardless of whether they need version control or not.

Conclusion#

Dolt 2.0 is here. It’s kinder to your disk and it’s fast. Questions? Stop by our Discord and just ask.

Planet for the MySQL Community

‘I Am Your Father,’ Reveals Trump To Horrified Mark Hamill

https://media.babylonbee.com/articles/69fe0b407534869fe0b4075349.jpg

WASHINGTON, D.C. — Donald Trump called an impromptu press conference in front of the White House this week to deliver a life-changing message to actor Mark Hamill, revealing that he was, in reality, the actor’s father.

The actor was reportedly reluctant to accept the invitation to appear at the press conference but sensed something deep within himself that made him feel compelled to be present.

"Search your feelings, Mark, you know it to be true," Trump said while extending his hand toward Hamill. "George Lucas never told you what happened to your father."

Hamill recoiled in fear, somehow knowing what was next. "He told me enough," he said. "He told me you’re basically Hitler and that you’re destroying democracy. We have to stop you."

"No. I am your father, Trump explained.

"No… no… that’s not true," Hamill sobbed. "That’s impossible!"

"It’s true. It’s a beautiful thing, maybe the best fatherhood in the history of families. Many people are saying it," Trump answered.

"NOOOOOOOOOOOOOO! NO!" the actor then shouted as members of the media looked on.

"This is a great opportunity, Mark," Trump continued as he adjusted his red power tie. "You can destroy the Left. The Democrats have foreseen this. Join me, and together we can make America great again as father and son."

Hamill was later seen fleeing the press conference and was unavailable for comment.

At publishing time, Trump also announced that he had ordered the United States military to destroy all copies of any Star Wars movies made after Return of the Jedi, a move that skyrocketed his popularity with Republicans and Democrats alike.


Every hour a racist loses hope, will you help the Southern Poverty Law Center to help a racist in need?

Click to watch the latest sketch!

Babylon Bee

Laravel ClickHouse: A Full-Featured ClickHouse Driver for Laravel

https://picperf.io/https://laravelnews.s3.amazonaws.com/featured-images/clickhouse-laravel-featured.png

Laravel ClickHouse is a database driver that integrates ClickHouse with Laravel, including Eloquent, the Query Builder, Schema Builder, and more:

  • Eloquent models with non-incrementing ID support
  • Query Builder with ClickHouse-specific clauses (i.e.,FINAL, ARRAY JOIN, SAMPLE)
  • Schema Builder with ENGINE, PARTITION BY, ORDER BY, and LowCardinality column types
  • Laravel migration support via artisan migrate
  • Concurrent query execution using Guzzle’s async HTTP pool
  • Dual HTTP transport options: Guzzle and Curl/phpclickhouse

ClickHouse is an open-source column-oriented database built for analytical workloads. It stores data by column rather than by row, making aggregations over large datasets fast—capable of querying billions of rows in seconds. It’s a common choice for event tracking, time-series data, and analytics dashboards where read performance at scale is the priority.

Eloquent Models

You can define Eloquent models pointing at ClickHouse the same way you would for any other database connection:

class Event extends Model

{

protected $connection = 'clickhouse';

}


$events = Event::where('user_id', 1)->get();

ClickHouse doesn’t use auto-incrementing primary keys, so the driver configures models with non-incrementing IDs by default. Scopes and collections work as expected.

Query Builder with ClickHouse Extensions

The Query Builder covers standard Laravel methods and adds ClickHouse-specific clauses. The final parameter applies the FINAL modifier to a query, which forces ClickHouse to merge duplicate rows at read time—useful with the ReplacingMergeTree engine:

$events = DB::connection('clickhouse')

->table('events', final: true)

->where('user_id', 1)

->get();

Other extensions include PREWHERE (ClickHouse’s pre-filter for primary key columns), ARRAY JOIN, SAMPLE, LIMIT BY, and SEMI/ANTI/ASOF join types.

Schema Builder and Migrations

The Schema Builder supports ClickHouse DDL via a ClickHouseBlueprint, letting you define table engines, partition keys, order keys, and column types like LowCardinality:

Schema::connection('clickhouse')->create('events', function (ClickHouseBlueprint $table) {

$table->engine('MergeTree()');

$table->orderBy(['id', 'created_at']);

$table->partitionBy('toYYYYMM(created_at)');

});

Standard artisan migrate commands work with a ClickHouse-compatible migration repository, so you can manage schema changes alongside your other databases.

Concurrent Query Execution

The package includes a Parallel helper that runs multiple queries at the same time using Guzzle’s async HTTP pool:

$results = Parallel::get([

'users' => User::where('active', 1),

'events' => Event::where('type', 'click'),

]);

Both users and events execute concurrently, and the results are returned as a keyed array once all queries resolve.

You can find the full documentation and source on GitHub.

Laravel News

Board for balance exercises, with acupressure #3DPrinting #3DThursday

https://cdn-blog.adafruit.com/uploads/2026/05/Board-for-balance-exercises-with-acupressure.webp


Hutnik shares:

These are balance boards, which are a great way to practice your balance. To make it not so easy, I created, in addition to a smooth board, boards with different types of protrusions that work like acupressure, which will take your balance to higher level

download the files on: https://makerworld.com/en/models/2743722-board-for-balance-exercises-with-acupressure


649-1
Every Thursday is #3dthursday here at Adafruit! The DIY 3D printing community has passion and dedication for making solid objects from digital models. Recently, we have noticed electronics projects integrated with 3D printed enclosures, brackets, and sculptures, so each Thursday we celebrate and highlight these bold pioneers!

Have you considered building a 3D project around an Arduino or other microcontroller? How about printing a bracket to mount your Raspberry Pi to the back of your HD monitor? And don’t forget the countless LED projects that are possible when you are modeling your projects in 3D!

LIVE CHAT IS HERE! http://adafru.it/discord

Adafruit on Instagram: https://www.instagram.com/adafruit

Shop for parts to build your own DIY projects http://adafru.it/3dprinting

3D Printing Projects Playlist:

3D Hangout Show Playlist:

Layer by Layer CAD Tutorials Playlist:

Timelapse Tuesday Playlist:

Connect with Noe and Pedro on Social Media:

Noe’s Twitter / Instagram: http://instagram.com/ecken

Pedro’s Twitter / Instagram: http://instagram.com/videopixil

3D printing – Adafruit Industries – Makers, hackers, artists, designers and engineers!

How the Ford Model T Changed Factories Forever

https://theawesomer.com/photos/2026/05/ford_model_t_factory_t.jpg

How the Ford Model T Changed Factories Forever

The Ford Model T helped democratize car ownership while revolutionizing factory production. Primal Space explores how Henry Ford and his engineers developed a moving assembly line that brought parts directly to workers, dramatically speeding up manufacturing. Ford’s Highland Park factory also helped popularize the five-day work week.

The Awesomer