Guzzle is a PHP HTTP client that Laravel uses to send outgoing HTTP requests to communicate with external services. Guzzle’s wrapper in Laravel focuses on the most popular use cases while providing a great development experience. Using Guzzle will save you time and reduce the number of lines of code in your application, making it more readable.
A common use case is when two Laravel applications are developed, and one functions as the server while the other is the client. They will need to make requests to each other. Here are a few things we’ll cover in this article:
- What is an API?
- Difference between external and internal APIs.
- What is Guzzle?
- Laravel’s HTTP Client.
- Making requests.
- Inspecting the response format.
Prerequisites
The following will help you keep up with this tutorial:
What Is an API?
An API is a software-to-software interface that enables two applications to exchange data. APIs are propelling a new era of service-sharing innovation. They are used by nearly every major website you can think of, including Google, Facebook, and Amazon. All of these websites and tools use and provide ways for other websites and products to consume and extend each other’s data and services. You’ve been in the presence of an API if you’ve ever signed into an app or service using your Facebook or Google credentials.
They serve as a bridge between developers and the different programs that people and organizations use on a regular basis, allowing them to create new programmatic interactions. Companies can open up their applications’ data and functionality to external third-party developers, commercial partners, and internal departments through an application programming interface, or API. Through a documented interface, services and products can communicate with one another and benefit from each other’s data and capability.
Here are some common examples of APIs:
- Pay with PayPal
- Twitter Bots
- Sign In with Google
How Do APIs Work?
APIs operate as an intermediary layer between an application and a web server, facilitating data transfer across systems. To retrieve information, a client application makes an API call, often known as a request. This request, which contains a request verb, headers, and sometimes a request body, is sent from an application to the web server via the API’s uniform resource identifier (URI).
The API makes a call to the external program or web server after receiving a valid request. The server responds to the API with the requested data. The data are transferred to the requesting application via the API.
Internal vs. External APIs
Internal APIs provide a safe environment for teams to share data and break down traditional data silos. An internal API is an interface that allows developers to gain access to a company’s backend information and application functionality. The new apps built by these developers can subsequently be shared with the public, although the interface is hidden from anyone who isn’t working directly with the API publisher.
Internal APIs can help cut down on the amount of time and resources required to develop apps and the resources. Developers can leverage a standardized pool of internal software assets instead of designing apps from scratch.
External APIs provide secure communication and content sharing outside of an organization, resulting in a more engaging customer experience. An external or open API is an API designed for access by a larger population, as well as by web developers. Thus, an external API can be easily used by developers inside the organization (that published the API) and any other developer from the outside who desires to register with the interface.
Benefits of APIs
Abstraction
An API makes programming easier by abstracting the implementation and just exposing the objects or actions that the developer needs.
Security
They enable secure communication of abstracted data to be displayed or used as required.
Automation
APIs allow computers to manage tasks rather than individuals. Agencies can use APIs to update workflows to make them more efficient.
Personalization
An API can be used to establish an application layer for use in disseminating information and services to new audiences and can be customized to create unique user experiences.
What Is a REST API?
REST is an acronym for representational state transfer. The first distinction to make is that API is the superset, whereas REST API is the subset. This implies that while all REST APIs are APIs, not all APIs are REST APIs. REST is a software architectural style developed to guide the design and development of the World Wide Web’s architecture. REST API is an API that follows the design principles of the REST architectural style. REST APIs are sometimes referred to as RESTful APIs because of this. For developers, REST provides a considerable amount of flexibility and independence. REST APIs have become a popular approach for connecting components and applications in a microservices architecture because of their flexibility.
REST APIs use HTTP requests to perform common database activities, including creating, reading, updating, and deleting records (also known as CRUD). A REST API might, for example, use a GET request to retrieve a record, a POST request to create one, a PUT request to update one, and a DELETE request to delete one.
What is Guzzle?
Guzzle is a PHP HTTP client that makes sending HTTP requests with data and headers easy. It also makes integrating with web services simple. It offers a simple yet powerful interface for sending POST requests, streaming massive uploads and downloads, using HTTP cookies, and uploading JSON data, among other things. One amazing feature is that it allows you to make synchronous and asynchronous requests from the same interface.
Previously, we relied on cURL for similar tasks. However, as time passed, more advancements have been made. Guzzle is a result of one of these advancements.
Laravel’s HTTP Client
Laravel wraps the Guzzle HTTP client in an expressive, basic API, allowing one application to swiftly make outgoing HTTP requests to communicate with other web apps efficiently. Requests can be sent, and responses can be retrieved using a HTTP Client. Guzzle is a powerful HTTP client, but when performing a simple HTTP GET or retrieving data from a JSON API, the 80% use-case seems difficult. Here are some popular features the Laravel HTTP Client provides:
- JSON response data is easily accessible.
- There’s no need for a boilerplate setup to make a simple request.
- Failed requests are retried.
You may need to use Guzzle directly for more complicated HTTP client tasks. However, Laravel’s HTTP Client includes everything you’ll need for most of your applications.
Making HTTP Requests to an API Using Laravel’s HTTP Client
For us to explore various options and use cases for Laravel’s HTTP Client, we’ll build a Laravel application that shows how to make requests to an external API using Laravel’s HTTP Client.
Note: The external API being used here is hosted on my local server. You can use any API you desire; its important to ensure you get the correct URL to make request to the API.
The URL that we will be hitting on the user API for this article is the following:
Create a New Laravel Project
You can create a new Laravel project via the Composer command or the Laravel installer:
laravel new project_name
    or
composer create-project laravel/laravel project_name
Install the Package
You need make sure that the Guzzle package is installed as a dependency of your application. You can install it using Composer:
composer require guzzlehttp/guzzle
Set Up the URL in .env and in the config/app Directory
Considering that you’ll be using this URL more than once, it’s a good idea to store it as one of your environment variables. This is beneficial because, if the URL needs to be changed later on, only the .env file will be modified rather than all the points at which the URL is called in the application. Store the URL as a variable in the .env file.
GUZZLE_TEST_URL=http://127.0.0.1:8000
Add it to the return[] array in config/app.php directory.
'guzzle_test_url' => env('GUZZLE_TEST_URL'),
Next, clear your configuration and application cache by running these commands:
php artisan config:cache
php artisan cache:clear
Set up the Controller
You’ll be making GET, POST, and DELETE requests to the API in the controller.
Create the controller with this Artisan command:
php artisan make:controller TestController
Import the Http Facade
use Illuminate\Support\Facades\Http;
Note: The base URL is being fetched from config/app.php, and the specific endpoint for a request is appended to it.
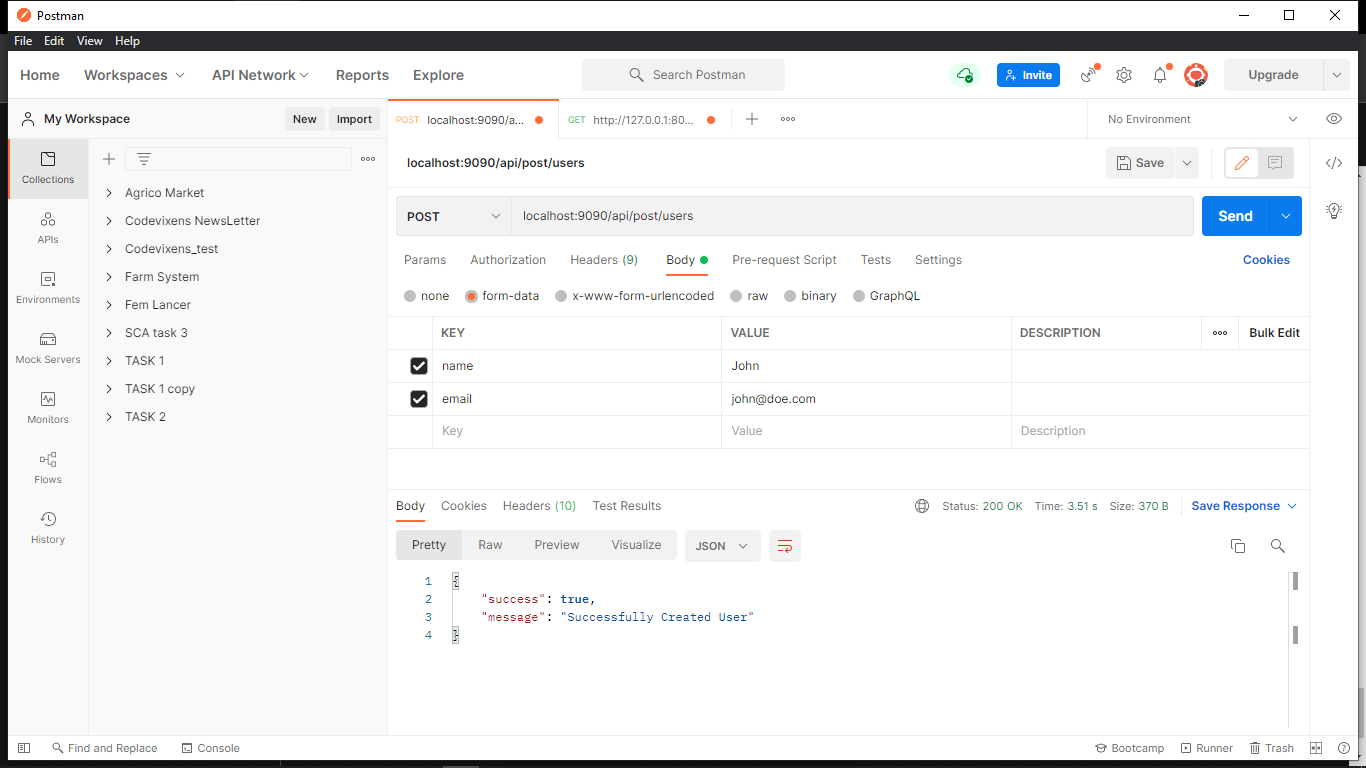
Make a POST Request
public function createUser(Request $request){
$theUrl     = config('app.guzzle_test_url').'/api/users/create';
  $response= Http::post($theUrl, [
      'name'=>$request->name,
      'email'=>$request->email
  ]);
  return $response;
}
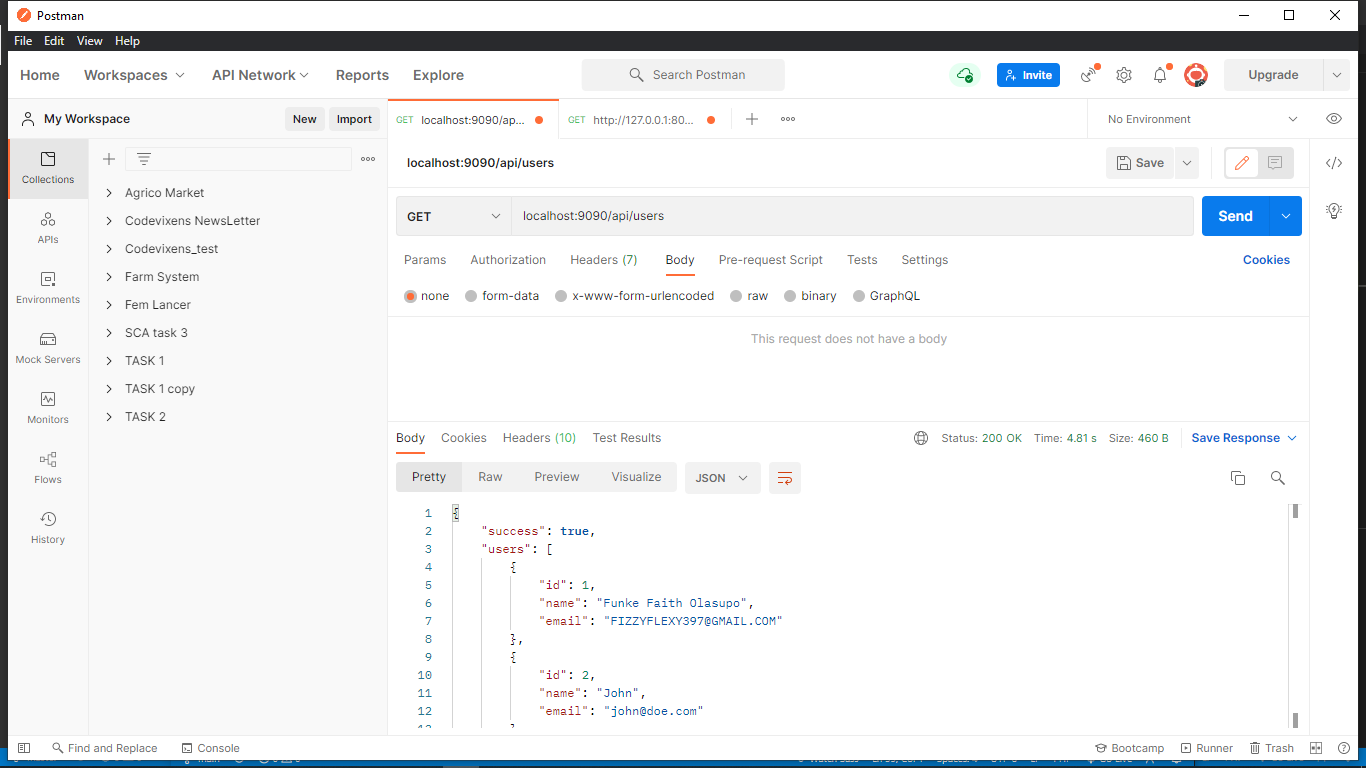
Make a GET Request
public function getUsers(){
   $theUrl     = config('app.guzzle_test_url').'/api/users/';
   $users   = Http ::get($theUrl);
   return $users;
}
Make a DELETE Request
public function deleteUser($id){
$theUrl     = config('app.guzzle_test_url').'/api/users/delete/'.$id;
     $delete   = Http ::delete($theUrl);
    return $delete;
}
Set Up the Route
Since this is an API, the routes are defined in the routes/api.php directory.
Route::post('post/users', [TestController::class, 'createUser']);
Route::get('users/', [TestController::class, 'getUsers']);
Route::delete('delete/users/{id}', [TestController::class, 'deleteUser']);
Serve the Project
Run this Artisan command to serve the project:
Note: I am using port 9000; you can use your desired port.
php artisan serve --port 9090
Testing
We’ll be using Postman to test the API. These are the results for the requests, and they return successful for every request.
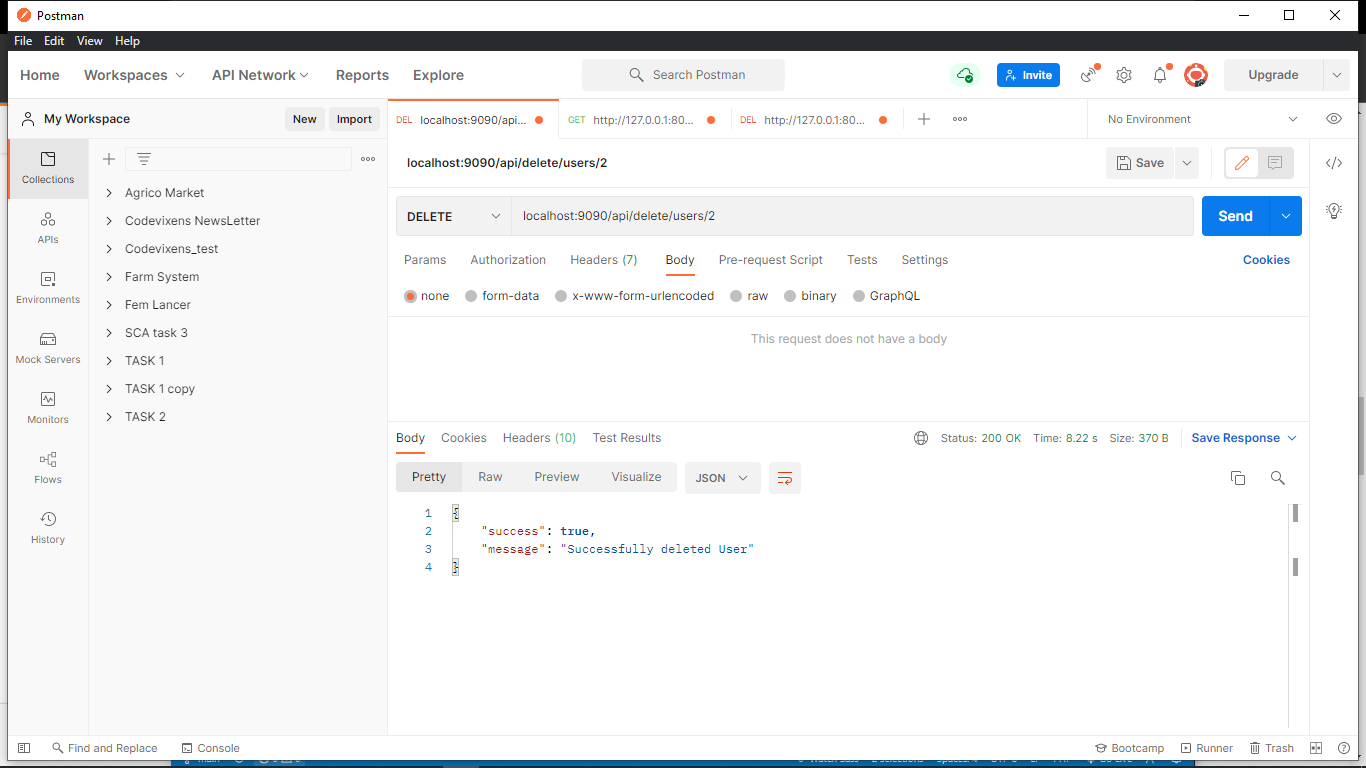
Laravel’s HTTP Client provides a list of options containing various formats in which response can be returned. Further queries can be performed on the response, depending on the format it is returned in. It returns a string by default.
String
Object
JSON
Check out the official Laravel documentation to learn more about Laravel’s HTTP Client. It provides various options, such as adding Authentication with Bearer Token,Headers, Timeout, and many other options, to make requests more flexible.
Conclusion
In this tutorial, you’ve learned how to consume APIs in Laravel using Laravel’s HTTP Client. Consuming APIs in Laravel is a broad concept on its own, but this tutorial can serve as a great starter guide. More information can be found in the official Laravel documentation. The code for this project is open-source and available on GitHub.
I am open to questions, contributions, and conversations on better ways to implement APIs, so please comment on the repository or DM me @twitter.
Thanks for reading 🤝.


 coated stainless steel slide features front and rear serrations to a shooter’s ability to effortlessly rack the slide back for loading and clearing the action.