https://s3files.core77.com/blog/images/1226899_81_111236_gTOoP6wNM.jpg
This year 3D printing continued its inexorable rise as a powerful, game-changing fabrication technique. Two areas were of interest to us: Pro-level advances achieved by corporations or universities, and the experiments, improved techniques and innovative objects produced by individuals or small teams.
Professional Advances
Argentinian manufacturer Trideo makes a 3D printer so large, it comes on wheels. Their Big T Has a build area of one square meter!


Stratasys wowed us with the bonkers 3D prints that their J8 Polyjet machines are capable of.


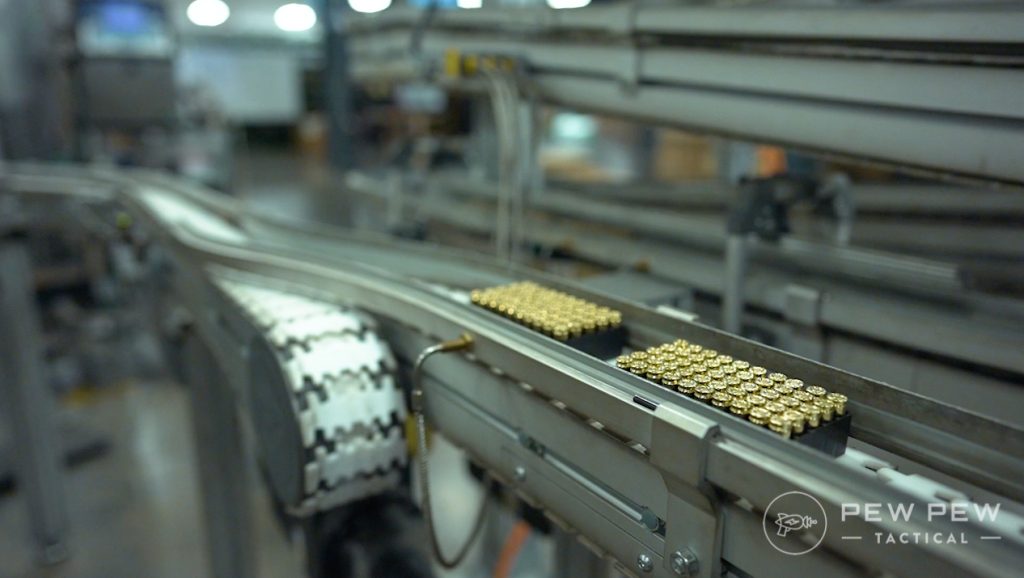
Also from Stratasys comes this VeroUltra 3D printing material, which offers crazy level of material realism, convincingly replicating wood, glass and even LED displays. Note that the sweaty bottle and label below were printed in a single shot.


This year we learned about Desktop Metal’s binder jetting, a 3D printing process that uses inkjet print heads to deposit a liquid binding agent onto a powder bed. It can be roughly 100 times faster than laser powder bed fusion systems (see side-by-side comparison below) and looks to be a gamechanger.
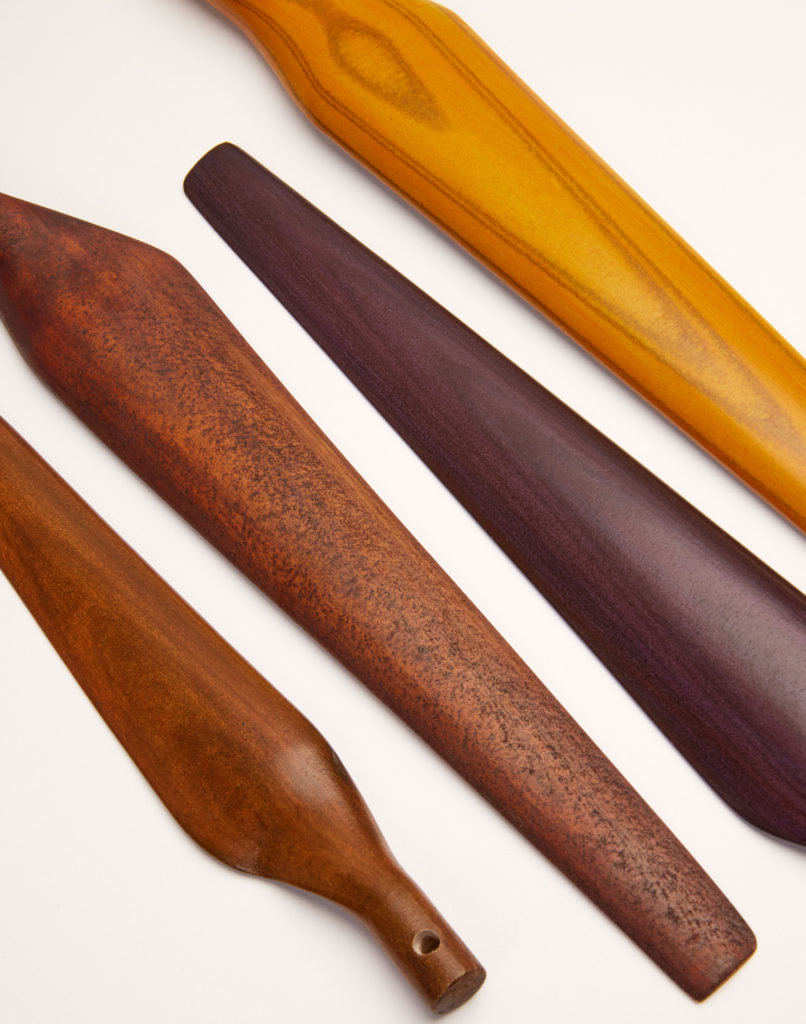
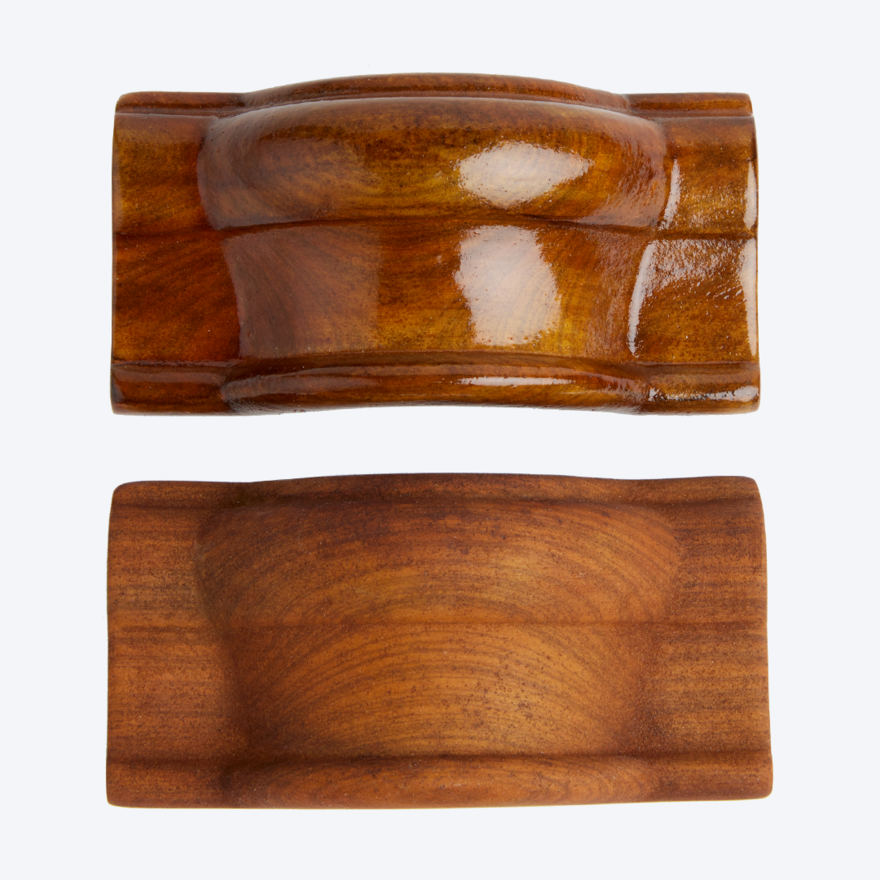
Desktop Metal subsidiary Forust is using binder jetting to 3D print wood from sawdust—pretty convincingly, at least in photos.

As for more affordable improvements, Mosaic Manufacturing’s Palette 3 Pro is a filament splicer that allows you to print up to eight colors with your existing single-nozzle 3D printer.

Researchers at USC created a mechanical bed for an FDM 3D printer that allows them to print without support structures.


By studying lobsters and crustaceans, Purdue University researchers discovered that 3D printing in spiral layers adds strength to structures, halting cracks and fractures.


Similarly, researchers at Australia’s RMIT University found that 3D printing concrete in different patterns also positively impacts the strength of a structure.


Moving closer to commercial construction, researchers at Spain’s Polytechnic University of Valencia (UPV) in Spain have developed a 3D-printed alternative to reinforced concrete beams, made from recycled plastic.


Researchers at Switzerland’s ETH Zürich, along with Zaha Hadid Architects, 3D printed concrete at specific angles to create a new type of bridge. The technique not only uses less material, but enables new types of forms.


As we mentioned in our 2021 roundup post of architecture, this year Habitat for Humanity started building their first 3D-printed houses.


Also this year, a company called Icon started selling "the first 3D-printed homes for sale in the U.S." in Austin, Texas.


Individual/Small Team Efforts
Here’s a handy tip: Stefan over at CNC Kitchen shows you how to make your 3D printer quieter for $2.


After a vintage design for a fractal vise went viral this year, product designer Christopher Borge figured out how to 3D print one.


Digital fabrication enthusiast MakerPaul designed and 3D printed an hourglass-like timer that notifies you when time’s up, and can be instantly reset.

Engineer Akaki Kuumeri brilliantly used 3D-printed flexures to improve an Xbox game controller.
ID student Charlie Ransford developed a 3D-printed turntable.


I know it’s silly, but Oodesign sells this amusing 3D-printed rubber-band-implementing insect cage.


In the name of science and space exploration, mechanical engineer Yuto Kuroki hacked a 3D printer to make sandwiches.
If you’re looking to make money selling self-designed items you can 3D print, you can be inspired by TreeHugger Systems’s smart, low-cost 3D-printed objects to make camping easier.


Lastly, here’s a free resource that should be useful for 2022 and beyond: The Scan the World Open Source Museum offers, for free, 17,000+ scans of famous artworks you can download and 3D print.

Core77
 Dilbert Daily Strip