qwen2.5-7b-laravel-coder

https://ollama.com/public/og.png

qwen2.5-7b-laravel-coder

Bob — a Laravel & PHP coding assistant built on Qwen2.5-Coder 7B, customized with official Laravel documentation (v10–v13) and a senior-architect persona.

Overview

Model qwen2.5-7b-laravel-coder
Base qwen2.5-coder (7B)
Persona Bob — senior PHP/Laravel specialist
Laravel 10.x, 11.x, 12.x, 13.x (version-aware)
Focus PHP & Laravel ecosystem only

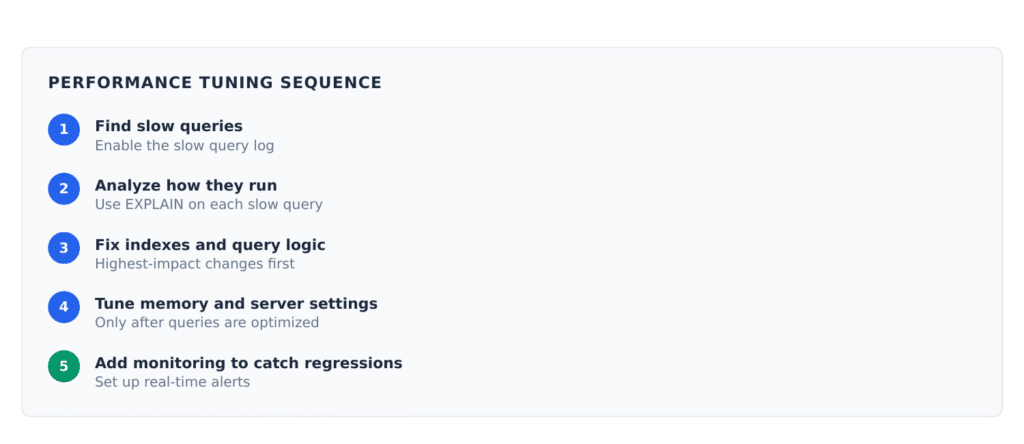
Bob detects your Laravel version from composer.json, bootstrap/app.php, and project patterns, then gives version-specific answers. He follows PSR-12, flags common pitfalls (N+1 queries, mass assignment, missing indexes), and declines topics outside PHP/Laravel.

Quick start

ollama pull bhavingajjar/qwen2.5-7b-laravel-coder
ollama run bhavingajjar/qwen2.5-7b-laravel-coder

Model page: https://ollama.com/bhavingajjar/qwen2.5-7b-laravel-coder

Example prompts

  • “How do I register middleware? Here’s my composer.json and bootstrap/app.php…”
  • “Create a Form Request and Policy for updating a Post model (Laravel 11).”
  • “Set up Sanctum SPA authentication — project uses Laravel 10.”
  • “Who are you?” — Bob introduces himself as your Laravel mentor.

Capabilities

  • Version detection from composer.json, bootstrap/app.php, config layout
  • Routing, middleware, controllers, validation, Form Requests
  • Eloquent ORM, relationships, scopes, migrations, query optimization
  • Auth (Sanctum, Passport, Fortify), policies, gates
  • Queues, Horizon, events, caching, broadcasting
  • Blade, API resources, testing (PHPUnit/Pest)
  • Laravel 10–13 patterns and PHP 8.x best practices

Parameters

Parameter Value
temperature 0.3
top_p 0.9
num_ctx 8192

License

Laravel News Links

Star Wars Drone Show

https://theawesomer.com/photos/2026/07/star_wars_drone_show_t.jpg

Star Wars Drone Show

Over 2000 drones took to the skies over Seoul, Korea, to celebrate the Star Wars universe. The eye-popping, 10-minute show featured flying formations of the iconic Star Wars Logo, the Millennium Falcon, Luke Skywalker, Darth Vader, R2-D2, BB-8, Stormtroopers, Din Djarin and Grogu, and more. They even programmed the drones to display video footage.

The Awesomer

★ 12 Open-Source Laravel Projects Every Developer Should Explore

https://saasykit.com/open-graphy?title=Learn%20Laravel%20by%20Exploring%20Open-Source%20Projects&url=https%3A%2F%2Fsaasykit.com%2Fblog%2Flearn-laravel-by-exploring-open-source-projects&signature=ab4fc4fe1255c986b0d89b4ddccf7de6475021dd230908006343f8cae4dd5add&.png

For developers starting their journey, getting practical experience can be a chicken-and-egg problem. Without hands-on exposure to real projects, it’s difficult to build the skills needed to land opportunities. Yet, without those opportunities, gaining experience feels impossible. This is where open-source projects become a godsend. 

By exploring and contributing to these projects, you not only learn how professional applications are built but also get a chance to see how seasoned developers solve real-world problems.

Even for experienced developers, exploring open-source projects can be incredibly valuable. These projects offer a chance to see diverse coding styles, learn advanced techniques, and discover innovative ways of solving complex problems. 

Laravel is one of the most popular PHP frameworks for building modern web applications. While tutorials and documentation provide a great foundation, diving into real-world open-source projects can offer invaluable insights into best practices, architecture, and advanced features of Laravel.

Below, I’ve compiled a list of notable Laravel-based projects, along with descriptions and learning opportunities for each.

Let’s dive in. 👇

1. Cachet

Cachet is an open-source status page system for monitoring and displaying service uptime.

Project URL: Cachet on Github

What to Learn:

  • Building real-time dashboards with Laravel.
  • Managing scheduled tasks with Laravel’s Task Scheduler.
  • Creating APIs for external integrations.
  • Using various types of notifications.
  • Using Reponsitory pattern in Laravel apps.
  • How to handle storage and retrieval of metric (analytics) data.


2. Monica

Monica is a personal relationship management tool designed to help users manage their personal contacts and interactions.

Project URL: Monica on Github

What to Learn:

  • Domain-driven (DDD) design using Laravel.

3. BookStack

BookStack is a platform for creating and organizing documentation and knowledge bases.

Project URL: BookStack on Github

What to Learn:

  • Managing rich text editors and integrating Markdown parsing.
  • Creating nested content structures and permission systems.
  • Employing policies and gates for authorization.
  • Writing good tests using PHPunit.

4. Flarum

Flarum is a forum software that emphasizes simplicity and flexibility.

Project URL: Flarum on Github

What to Learn:

  • Extending Laravel with plugins and extensions.
  • Handling user authentication and roles.
  • Managing real-time interactions with WebSockets.

5. Coolify

Coolify is an open-source tool to self-host applications effortlessly.

Project URL: Coolify on Github

What to Learn:

  • Automating deployments and server management with Laravel.
  • Using Docker & Docker compose with Laravel applications.
  • Implementing queue systems for background tasks.

6. Bagisto

Bagisto is an open-source e-commerce platform built on Laravel.

Project URL: Bagisto on Github

What to Learn:

  • Building and customizing e-commerce features like product catalogs, orders, and inventory management.
  • How to work with Vue.js in Laravel.
  • Extending Laravel using packages and modular architecture.
  • Implementing multi-language and multi-currency support.

7. OctoberCMS

OctoberCMS is a content management system built on Laravel.

Project URL: OctoberCMS on Github

What to Learn:

  • Building content management systems using Laravel.
  • Working with themes and plugins.
  • Leveraging Laravel’s event system for extensibility.

8. Invoice Ninja

Invoice Ninja is an invoicing and billing platform for freelancers and small businesses.

Project URL: InvoiceNinja on Github

What to Learn:

  • Generating PDFs dynamically using Laravel.
  • Handling events & listeners.
  • Using Livewire components in Laravel apps.
  • Building robust REST APIs.

9. Akaunting

Akaunting is an open-source accounting software.

Project URL: Akaunting on Github

What to Learn:

  • Implementing financial calculations and reporting features.
  • Using Vue.js and TailwindCSS in Laravel.
  • Handling Laravel Jobs.
  • Sending emails & notifications.
  • Handling multi-tenancy in a Laravel application.
  • Extending functionality with app modules.

10. Pterodactyl

Pterodactyl is a game server management platform.

Project URL: Pterodactyl on Github

What to Learn:

  • Using Laravel with Docker to manage server instances.
  • Securing sensitive operations with detailed role-based access control.
  • Monitoring server performance and resource usage.

11. Canvas

Canvas is a content management system specifically for bloggers.

Project URL: Canvas on Github

What to Learn:

  • Building blogging platforms with Laravel.
  • Managing user-generated content and media files.
  • Implementing SEO-friendly features.

12. TastyIgniter

TastyIgniter is an open-source restaurant management system with online ordering features.

Project URL: TastyIgniter on Github

What to Learn:

  • Building custom management systems for niche industries.
  • Integrating third-party APIs for payments and notifications.
  • Handling real-time order tracking and updates.


Exploring these projects offers a fantastic opportunity to see Laravel in action. By reviewing the codebases, you can understand how seasoned developers structure their applications, solve complex problems, and use Laravel’s rich ecosystem to build robust solutions.

Happy learning! 🤘

Laravel News Links

How to Become a MySQL DBA in 2026

https://webyog.com/wp-content/uploads/2023/04/online-business-database_53876-95876.jpeg

Database administrators are the unsung architects of the modern internet. Every time a patient’s electronic
health record loads instantly, every time you check out a shopping cart without a hitch, every time a
recommendation engine surfaces exactly what you want — a database administrator made sure the system
could handle it. In 2026, that responsibility has grown larger, more complex, and more rewarding than ever.
If you’re wondering how to break into MySQL DBA work — or level up from a junior role — this guide maps out
the path clearly. MySQL 8.0/8.4 LTS and the MySQL 9.x Innovation series have expanded what DBAs need to
know, but the fundamentals remain the same. Let’s walk through them.

Why MySQL DBA Skills Are Still in High Demand

MySQL has consistently ranked among the top relational databases worldwide, trailing only Oracle in the
DB-Engines rankings — and it’s not slowing down. It powers massive global platforms — Meta’s social graph,
YouTube’s video metadata, countless SaaS applications, and a growing share of AI training and inference
pipelines that need fast, reliable structured data access.
Despite the rise of NoSQL systems and cloud-managed databases, MySQL expertise remains a hiring priority.
Cloud providers offering managed MySQL (Amazon RDS, Google Cloud SQL, Azure Database for MySQL)
have increased accessibility, but they haven’t reduced the need for skilled DBAs. Someone still needs to tune
queries, manage access controls, architect backup strategies, and respond when things go wrong. That
someone is you.

What Does a MySQL DBA Actually Do Day-to-Day?

Before you invest months of learning, it helps to understand what the job looks like in practice. A typical MySQL
DBA’s day might include:

  • Implementing database changes — rolling out schema migrations, index additions, or stored procedure
    updates with minimal downtime
  • Refreshing development databases — copying sanitized production data to dev and QA environments
    so developers can test against realistic datasets
  • Diagnosing performance issues — identifying slow queries, lock contention, or replication lag and
    resolving them before they cascade into outages
  • Managing access permissions — using GRANT, REVOKE, and role-based access controls to enforce the
    principle of least privilege
  • Conducting compliance reviews — auditing user permissions and data handling practices, increasingly
    important as privacy regulations tighten globally
  • Supporting disaster recovery testing — verifying that backup and restore procedures work as
    documented, not just as assumed

In 2026, many DBAs also find themselves involved in AI infrastructure work — maintaining databases that store
training datasets, feature stores, or model metadata. Familiarity with high-throughput ingestion patterns and
vector-adjacent storage has become a differentiator.

The Learning Roadmap: What to Study

Installation and Configuration

Start with the basics: install MySQL Community Edition on your local machine (or a free-tier cloud VM),
configure the server, and learn your way around the configuration file (my.cnf / my.ini). Understand the
difference between MySQL 8.0/8.4 LTS (the stable, long-term support branch) and MySQL 9.x Innovation
releases (feature-rich but faster-moving). Most production environments run LTS versions — that’s where your
hands-on practice should focus.

Security and Access Control

Security is non-negotiable. Learn the MySQL privilege system thoroughly:

  • GRANT — assign privileges to users
  • REVOKE — remove specific privileges
  • Role-based access control (introduced in MySQL 8.0 and now mature in 8.4)
  • Authentication plugins, including caching_sha2_password (the modern default)
  • SSL/TLS configuration for encrypted connections

In containerized and cloud environments, managing secrets and rotating credentials securely is as important as
the SQL syntax itself.

Backup and Restore

A DBA who can’t restore a database is a liability. Study:

  • mysqldump for logical backups
  • MySQL Enterprise Backup / Percona XtraBackup for physical backups
  • Point-in-time recovery using binary logs
  • Replication as a component of your HA and DR strategy

Practice restores regularly. Many DBAs have discovered their backup strategy was broken only when they
needed it most.

Indexing and Query Optimization

Understanding how MySQL executes queries is what separates good DBAs from great ones. Learn to:

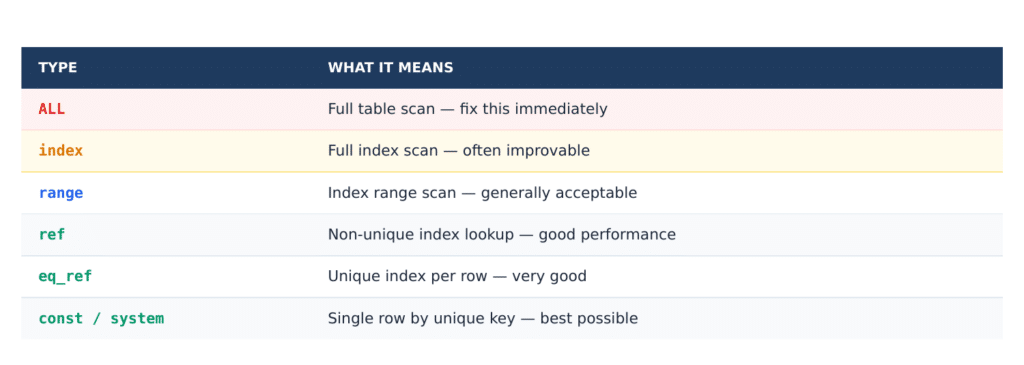
  • Read EXPLAIN and EXPLAIN ANALYZE output
  • Design indexes that support your workload’s query patterns
  • Identify and resolve N+1 query problems, full table scans, and missing index conditions
  • Use the Performance Schema and sys schema for workload analysis

MySQL 8.4 and 9.x have added richer optimizer tracing and index skip scan capabilities — worth learning
alongside the fundamentals.

Replication and High Availability

Most production MySQL environments use replication. Learn:

  • Asynchronous replication (the classic model)
  • Semi-synchronous replication for stronger durability guarantees
  • Group Replication / InnoDB Cluster for multi-primary topologies
  • MySQL Router for automatic failover routing

Cloud-managed services abstract some of this, but understanding what’s happening underneath makes you far
more effective when things go wrong.

Monitoring

You cannot manage what you cannot measure. Learn to query Performance Schema, watch global status
variables, and set up alerting for:

  • Replication lag
  • Long-running queries and lock waits
  • Connection exhaustion

Familiarity with monitoring tools will accelerate your effectiveness immediately.

Career Paths Into MySQL DBA Work

Many successful MySQL DBAs didn’t start there. Common transition paths include:

  • Systems administrators who learned database operations as part of owning the full stack
  • Software developers who moved into data engineering or backend operations
  • Data analysts who wanted to go deeper into the infrastructure powering their data

If you’re transitioning from sysadmin or dev work, you already have transferable skills — Linux administration,
scripting, networking, and version control all apply directly to DBA work.
Mentorship accelerates the path considerably. If you can find an experienced DBA to learn from — through a
job, a community forum, or an open-source project — take that opportunity. The gap between knowing the
commands and understanding the judgment calls comes from experience, and mentorship compresses that
timeline.

Tools That Will Make You Effective

Learning MySQL’s command-line tools (mysql, mysqladmin, mysqldump, mysqlcheck) is foundational. As
you advance, dedicated tooling becomes essential.
SQL Diagnostic Manager for MySQL is the tool Webyog and IDERA offer for professional MySQL monitoring.
It provides:

  • Real-time performance dashboards covering connections, query throughput, and buffer pool health
  • Disk and lock monitoring to catch I/O bottlenecks and contention before they escalate
  • Security alerts for privilege changes and suspicious access patterns
  • Multi-user access for DBA teams managing multiple instances
  • Root cause analysis tools that surface the query or configuration change behind a performance event

For day-to-day query writing and database browsing, SQLyog (available as Community and paid editions) is a
widely-used GUI client that speeds up development and administration workflows significantly.

How Long Does It Take?

Expect 6–12 months of consistent study and hands-on practice to reach functional competency — enough to
take on a junior DBA role. Most practitioners report logging 200+ hours of practical work before feeling genuinely
confident handling production incidents.

The MySQL documentation is excellent and free. MySQL Community Edition gives you a full server to
experiment on at no cost. There’s no excuse not to start today.

Getting Started This Week

  1. Download and install MySQL Community Edition (8.4 LTS recommended for beginners)
  2. Work through the official MySQL Reference Manual chapters on installation, security, and backup
  3. Install SQLyog Community Edition for a GUI interface alongside your CLI practice
  4. Join the Webyog Forums — a community of 15,000+ MySQL users where questions get answered
  5. Build something real: a sample database, a backup script, a monitoring query

The MySQL DBA path is well-documented, practically learnable, and professionally rewarding. In 2026, the
demand is strong and growing. The question isn’t whether the opportunity is there — it’s whether you’ll start.

Frequently Asked Questions

Do I need a formal degree to become a MySQL DBA?

No. Many successful DBAs come from sysadmin backgrounds, software development, or entirely self-taught
paths. Employers care about what you can demonstrate — not the credential on your resume. A portfolio of
hands-on work with real MySQL instances carries more weight than a certificate alone.

How long does it take to land a junior DBA role?

Most people reach functional competency — enough to handle a junior position — within 6–12 months of
consistent, hands-on practice. Budget for 200+ hours of real work: installing, configuring, breaking, and restoring
MySQL in a lab environment.

What’s the difference between MySQL 8.4 LTS and MySQL 9.x Innovation?

MySQL 8.4 LTS (Long-Term Support) is the stable, production-recommended track with multi-year security and
bug-fix support. MySQL 9.x Innovation releases ship new features faster but are not intended for long-term
production use. For learners, start with 8.4 LTS — it’s what most production environments run.

Is MySQL experience transferable to other databases?

Absolutely. The fundamentals — indexing, query optimisation, backup strategy, access control, replication —
translate well to PostgreSQL, MariaDB, and cloud-managed databases like Amazon Aurora. MySQL DBA
experience is a strong foundation for a broader data infrastructure career.

What tools should I learn as a MySQL DBA?

Start with the MySQL command-line tools (mysql, mysqldump, mysqladmin). Add a GUI client like SQLyog
for day-to-day administration. As you advance, learn a professional monitoring platform — SQL Diagnostic
Manager for MySQL is widely used in production environments and worth familiarising yourself with early.

Is MySQL DBA a good long-term career in the age of AI?

Yes. AI workloads increase — not decrease — the demand for reliable structured data storage. Model training
pipelines, feature stores, and inference logging all depend on databases. DBAs who understand high-throughput
ingestion, replication, and cloud deployments are well-positioned for the AI era.

Start Your MySQL DBA Journey Today

Whether you’re just exploring the role or ready to accelerate your path to production, Webyog has the tools to
get you there faster.

  • Try SQL Diagnostic Manager for MySQL free for 14 days — learn on a real monitoring platform used by
    professionals
  • Request a demo — see how DBAs use it to manage production MySQL environments
  • Contact our team — get guidance on building a MySQL lab environment or career development resources

Visit webyog.com and take the first step today.

Download the IDERA whitepaper “How to Become a MySQL DBA” for a deeper dive into the curriculum and career path. Available at webyog.com.

Curious what this career actually pays? Read our salary deep-dive: MySQL DBAs Are Landing Six-Figure Jobs
in 2026 — And You Can Too.

Planet for the MySQL Community

Top MySQL Performance Metrics to Monitor in 2026

https://webyog.com/wp-content/uploads/2017/11/connections-and-buffer-pool-usage-1.png

As databases power increasingly complex workloads — from AI-driven applications to cloud-native
microservices and containerized deployments — the ability to monitor MySQL performance with precision has
never been more important. Whether you’re running MySQL 8.0/8.4 LTS in a stable production environment or
experimenting with the MySQL 9.x Innovation series, the fundamentals of connection management and buffer
pool tuning remain the bedrock of a healthy database.
This post, part of our ongoing MySQL monitoring series, dives into two critical areas: connection metrics and
the InnoDB buffer pool. Mastering these will help you catch problems before they become outages.

Why Performance Monitoring Matters in 2026

Modern infrastructure has raised the stakes for database performance. AI inference workloads generate
high-throughput, low-latency query patterns. Cloud deployments scale horizontally but introduce new failure
modes. Containerized MySQL instances — whether on Kubernetes or ECS — spin up and down rapidly, making
consistent monitoring essential.
The good news: MySQL’s built-in instrumentation is richer than ever. MySQL 8.4 LTS and the 9.x Innovation
releases ship with improved Performance Schema coverage, enhanced replication visibility, and better
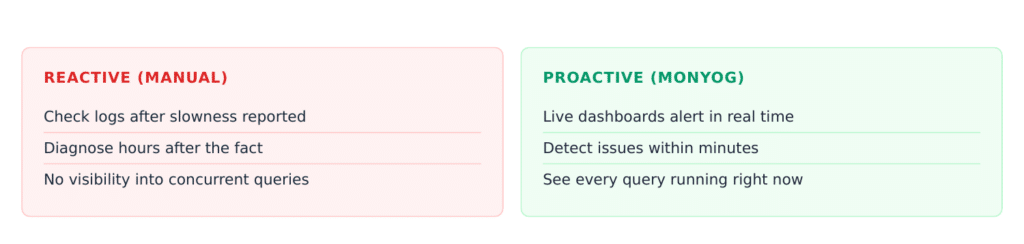
diagnostics for connection errors. Knowing which metrics to watch — and what thresholds to act on — separates
reactive firefighting from proactive operations.

Part 1: MySQL Connection Metrics

How MySQL Manages Connections

Every client request to MySQL passes through the connection manager thread. MySQL maintains a pool of
threads to handle these connections, and each active connection consumes memory and CPU. In
high-concurrency workloads — think e-commerce flash sales, real-time analytics pipelines, or AI feature stores
— connection pressure is one of the first things that breaks.

The default max_connections value is 151, which is appropriate for development but far too low for
production. Most production environments should set this to hundreds or even thousands, depending on
available RAM and workload patterns.

Key Connection Metrics to Track

Metric What It Tells You
Threads_connected Number of currently open connections
Threads_running Connections actively executing queries (not idle)
Connections Cumulative total connections since server start
Connection_errors_internal Errors from internal server issues
Aborted_connects Failed connection attempts
Aborted_clients Failed connection attempts

Threads_running is arguably the most important of these. A spike here — especially if it approaches
max_connections — signals that your server is under stress. If Threads_running climbs while
Threads_connected stays flat, you likely have slow queries piling up.

Granular Error Diagnostics

MySQL surfaces granular connection error counters that help you diagnose the root cause of failed connections:

  • Connection_errors_accept — errors at the network accept layer, often a kernel or OS-level issue
  • Connection_errors_max_connections — clients being refused because max_connections is
    exhausted
  • Connection_errors_peer_address — errors resolving client IP addresses
    In containerized environments, Connection_errors_peer_address can spike unexpectedly due to DNS
    resolution latency or ephemeral IP behavior. Watching this counter saves hours of debugging.

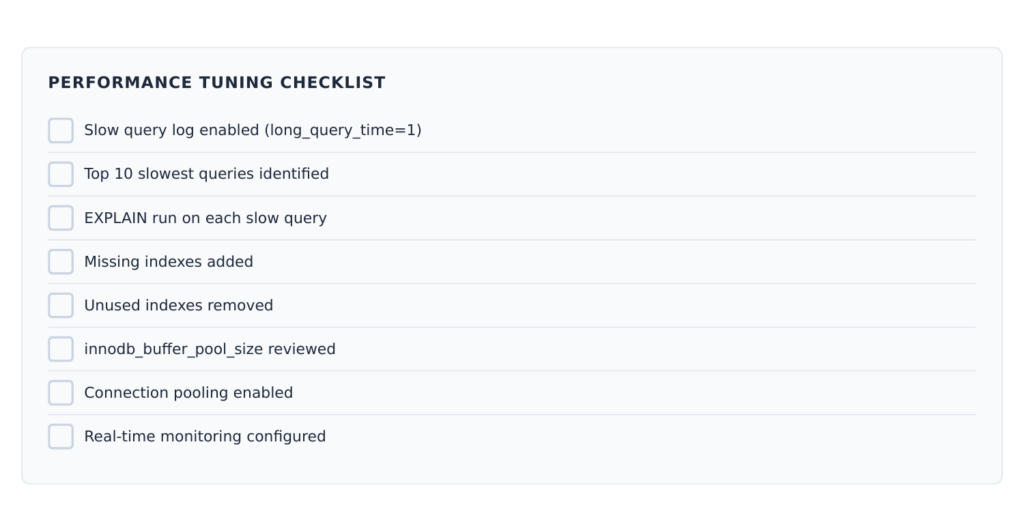
Connection Tuning Checklist

  • Set max_connections based on available RAM, not intuition
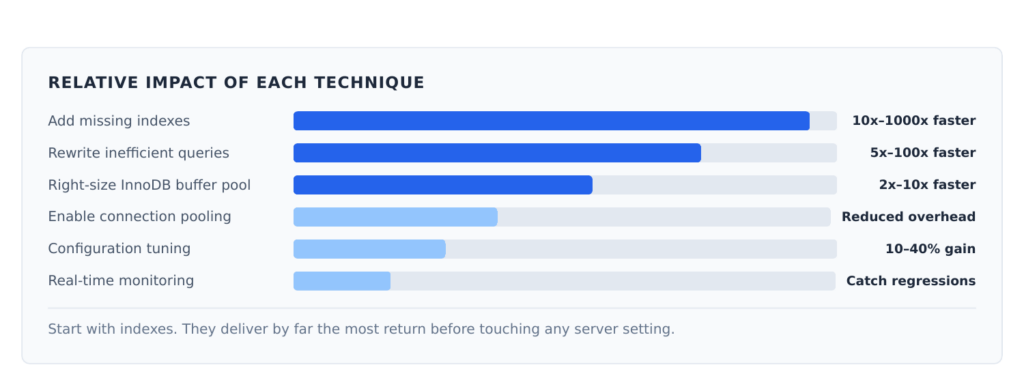
  • Use connection pooling (ProxySQL, MySQL Router) to reduce raw connection overhead in high-concurrency apps
  • Monitor Aborted_clients — persistent values indicate application-level connection leaks
  • Alert when Threads_running / Threads_connected > 0.5 consistently

Part 2: InnoDB Buffer Pool Metrics

What the Buffer Pool Does

The InnoDB buffer pool is MySQL’s most important memory structure. It caches table data and index pages in
RAM, reducing the need for expensive disk reads. A well-sized buffer pool can serve the majority of reads from
memory — dramatically reducing latency and I/O load.

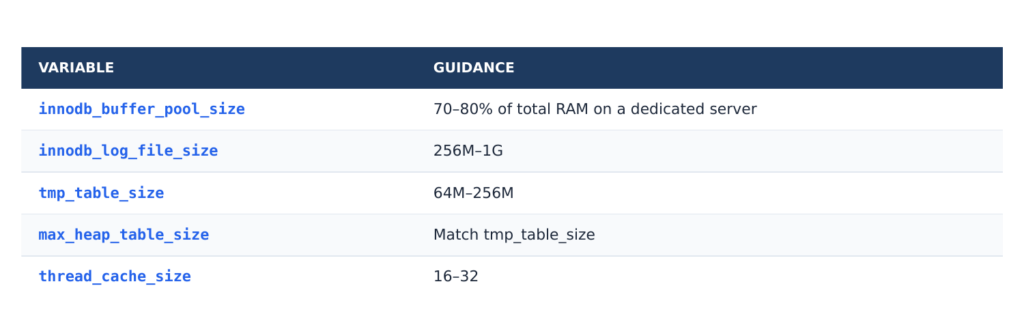
The default buffer pool size is 128MB, which is a reasonable starting point for development. For dedicated
database servers, the best practice is to allocate approximately 80% of available RAM to the buffer pool.

Sizing the Buffer Pool

The buffer pool size must align with this formula:

innodb_buffer_pool_size = N × innodb_buffer_pool_chunk_size × innodb_buffer_pool_instances

MySQL 8.x allows online resizing of the buffer pool, meaning you can adjust it without a restart — a significant
operational improvement. In cloud environments where instance sizes change frequently, this matters.

The LRU Algorithm and Midpoint Insertion

InnoDB uses a variant of the Least Recently Used (LRU) algorithm to manage which pages stay in the buffer
pool. Rather than a simple LRU list, MySQL uses a midpoint insertion strategy: newly loaded pages enter at
the midpoint of the list, not the head. This prevents large full-table scans from flushing your hot working set out of
the pool.

Two tuning parameters control this behavior:

  • innodb_old_blocks_pct — percentage of the buffer pool reserved for “old” (recently loaded) pages; default is 37%
  • innodb_old_blocks_time — how long a page must stay in the old sublist before it can be promoted to “young”; default is 1000ms

For OLTP workloads with repeated access to the same rows, the defaults work well. For mixed workloads
running analytical queries alongside transactional ones — increasingly common as AI pipelines run batch
feature extraction alongside live serving — you may need to tune these values to protect your hot page set.

Key Buffer Pool Metrics

Metric What It Tells You
Innodb_buffer_pool_read_requests Total logical read requests (memory hits + disk reads)
Innodb_buffer_pool_reads Physical reads from disk (cache misses)
Innodb_buffer_pool_pages_total Total pages in the buffer pool
Innodb_buffer_pool_pages_free Pages currently available (not in use)

Calculating Buffer Pool Efficiency

Cache Miss Rate = (Innodb_buffer_pool_reads / Innodb_buffer_pool_read_requests) × 100

A healthy production system should have a cache miss rate below 1% — meaning 99%+ of reads are served
from memory. If your miss rate climbs above this threshold, your buffer pool is undersized for your working data
set.

Watch Innodb_buffer_pool_pages_free as well. A consistently low free page count means the pool is
under memory pressure, and MySQL is spending time evicting pages rather than serving data.

Monitoring These Metrics in Practice

Manual monitoring with SHOW GLOBAL STATUS is a starting point, but it doesn’t scale. For teams running
MySQL in production — especially across multiple instances or cloud regions — a dedicated monitoring tool is essential.

SQL Diagnostic Manager for MySQL (part of the Webyog/IDERA family) provides real-time dashboards for all
the metrics discussed here, plus automated alerting, query analysis, and root cause diagnostics. Whether you’re
managing a single server or dozens of replicas behind a load balancer, having these metrics in one place makes
the difference between proactive tuning and reactive recovery.

Summary

Connection management and buffer pool sizing are foundational to MySQL performance. In 2026’s environment
of AI workloads, cloud scaling, and containerized deployments, these metrics deserve continuous attention —
not just one-time configuration.

  • Monitor Threads_running and connection error counters for early warning signs
  • Size your buffer pool to approximately 80% of RAM on dedicated servers
  • Target a cache miss rate below 1%
  • Use a monitoring tool that surfaces these metrics continuously, not just on demand

Stay tuned for the next post in this series, where we cover InnoDB I/O metrics and query performance
diagnostics.

Frequently Asked Questions

What is a healthy value for Threads_running?

In most workloads, Threads_running should stay well below max_connections. If it consistently exceeds
20–30% of your connection limit, investigate slow queries or lock contention. A sudden spike often points to a
rogue query or a batch job gone wrong.

How do I know if my buffer pool is too small?

Check your cache miss rate: (Innodb_buffer_pool_reads / Innodb_buffer_pool_read_requests)
× 100. A value above 1% is a warning sign. Also watch Innodb_buffer_pool_pages_free — if free pages hover near zero, MySQL is under memory pressure and evicting data it needs.

Can I resize the buffer pool without restarting MySQL?

Yes — MySQL 8.x supports online buffer pool resizing via SET GLOBAL innodb_buffer_pool_size. The
resize happens in chunks and may take a few seconds to minutes depending on pool size. No restart required.

What causes Aborted_clients to increase?

Aborted clients typically indicate application-side connection leaks — connections opened but not properly
closed. Check your application’s connection pooling configuration and ensure connections are returned to the
pool after each operation.

How often should I review these metrics?

Critical metrics like Threads_running and buffer pool efficiency should be monitored continuously with
alerting thresholds. Review trends weekly and investigate any sustained drift from your baseline.

Does this apply to cloud-managed MySQL (RDS, Cloud SQL)?

Yes. These metrics are exposed in cloud-managed MySQL instances and most providers surface them in their
native monitoring dashboards. You can also connect SQL Diagnostic Manager for MySQL to RDS and Cloud
SQL instances for deeper analysis.

Ready to Monitor MySQL Like a Pro?

Stop flying blind on your MySQL performance. SQL Diagnostic Manager for MySQL gives you real-time
dashboards, automated alerting, and root cause analysis — covering every metric discussed in this post and
more.

  • Start a free 14-day trial — no credit card required
  • Request a personalised demo — see it working against your own workload
  • Talk to our team — get advice on the right monitoring setup for your environment

Visit webyog.com to get started today.

Planet for the MySQL Community

untitled

RonSQL: a new SQL engine for RonDB with predictable low latency and CTEs

RonSQL: a new SQL engine for RonDB with predictable low latency and CTEs

Today we released RonDB 26.04.1, a beta release. It contains a
lot of new features, but the most interesting one is that RonSQL now
supports pushdown join aggregation and CTEs
, so that complex queries run
with low, predictable latency.

RonDB has always been able to answer complex queries through a MySQL Server.
The problem with that path is predictability. The application asks for an
answer, but it has no guarantee about how fast that answer arrives: the MySQL
optimizer picks a plan that may or may not parallelise the query across the RonDB
data nodes, and a plan that looks fine on a small table can fall off a cliff as
the data grows.

RonSQL takes a different contract. The rule is simple:

Anything RonSQL accepts can be pushed down to the RonDB data nodes for
parallel execution.

If a query parses and plans in RonSQL, it runs as a parallel pushdown —
there is no fallback to a slow, single-threaded plan. That means the latency of a
complex query is something the application can actually reason about up front,
instead of discovering it in production.

Why this matters: Feature Stores

RonSQL grew out of the needs of AI applications built on Feature
Stores
, and in particular on-demand (real-time)
transformations in Hopsworks
.

Traditionally an online Feature Store only does primary-key lookups. To keep
those lookups fast, every feature has to be pre-computed and
written back before serving. That works, but it has two costs:

  1. Stale features. A feature is only as fresh as the last
    batch job that recomputed it. The events from the last few seconds —
    often the most predictive ones for fraud, recommendations, or anomaly
    detection — are not yet reflected.
  2. Expensive BLOB packing. A common trick is to pack a range
    of values into a single BLOB (often Avro-encoded) so a whole feature group can
    be fetched in one lookup. But every change to any value means
    re-encoding the whole BLOB, which may hold hundreds of values.

RonSQL attacks both problems:

  • Fresh features on the fly. Instead of pre-computing
    aggregations, you stream raw rows into RonDB and let RonSQL aggregate them at
    query time. A row inserted a second ago is included immediately, so the
    feature reflects what just happened.
  • Index scans instead of BLOBs. Instead of packing values
    into a BLOB and re-encoding on every change, you store the values as ordinary
    rows and let RonSQL read them with an index scan. Updates become simple inserts
    and deletes — and deletes are usually handled for you by RonDB’s
    row-level TTL, so old data ages out without any application
    code.

CTEs (Common Table Expressions, the SQL WITH clause) are what let
you combine these two ideas in a single, readable query: aggregate the fresh fact
rows in a CTE, then join the result against your normalised dimension tables.

A worked example: real-time card-fraud features

Consider a fraud-scoring model. At inference time it needs a feature vector for
one card, computed over that card’s most recent activity. The raw transactions
arrive continuously and are inserted straight into RonDB:

-- Fact table: one row per card transaction, inserted in real time.
CREATE TABLE txn (
  txn_id       BIGINT       NOT NULL,
  cc_num       BIGINT       NOT NULL,   -- card / account identifier
  merchantkey  INT          NOT NULL,   -- references merchant.m_merchantkey
  amount       INT          NOT NULL,   -- minor units (cents)
  txn_time     DATETIME(6)  NOT NULL,
  is_declined  TINYINT      NOT NULL,
  PRIMARY KEY USING HASH (txn_id),
  -- Ordered index: range-scan one card's recent activity cheaply.
  INDEX idx_card_time (cc_num, txn_time)
) ENGINE=NDB
  COMMENT='NDB_TABLE=TTL=604800@txn_time';  -- auto-expire rows after 7 days

-- Small dimension table: replaces a per-card Avro BLOB of merchant attributes.
CREATE TABLE merchant (
  m_merchantkey INT          NOT NULL,
  m_category    VARCHAR(16)  NOT NULL,
  m_risk_score  INT          NOT NULL,
  PRIMARY KEY USING HASH (m_merchantkey)
) ENGINE=NDB;

Step 1 — a fresh feature vector with a single scan

The simplest on-demand feature is a scalar aggregate over the card’s last hour
of transactions. No pre-computation, no BLOB — just an index range scan that
includes whatever was inserted milliseconds ago:

SELECT
  COUNT(*)                                          AS txns_1h,
  SUM(amount)                                       AS amount_1h,
  MAX(amount)                                       AS max_amount_1h,
  AVG(amount)                                       AS avg_amount_1h,
  SUM(CASE WHEN is_declined = 1 THEN 1 ELSE 0 END)  AS declines_1h
FROM txn
WHERE cc_num = 4716253018273645
  AND txn_time >= DATE_SUB('2026-06-29 14:30:00', INTERVAL 1 HOUR);

RonSQL turns the WHERE into an ordered-index range
scan
on idx_card_time — it touches only this card’s
last hour — and pushes the COUNT/SUM/MAX/AVG
and the CASE expression down to the data nodes, which aggregate in
parallel and return a single row.

Step 2 — combining fresh aggregation with a dimension join, using a CTE

Now suppose the model wants spend broken down by merchant category.
The category does not live on the transaction — it lives on the
merchant dimension. The classic Feature Store approach would
denormalise the category into a packed BLOB per card. With RonSQL we keep the
data normalised and join at query time:

WITH spend_by_merchant AS (
  SELECT merchantkey AS m,
         SUM(amount) AS spend,
         COUNT(*)    AS txns
  FROM txn
  WHERE cc_num = 4716253018273645
    AND txn_time >= DATE_SUB('2026-06-29 14:30:00', INTERVAL 1 HOUR)
  GROUP BY merchantkey
)
SELECT m.m_category                  AS category,
       SUM(spend_by_merchant.spend)  AS spend_last_hour,
       SUM(spend_by_merchant.txns)   AS txns_last_hour
FROM merchant AS m
JOIN spend_by_merchant ON spend_by_merchant.m = m.m_merchantkey
GROUP BY m.m_category;

This query is easy to reason about, top to bottom:

  1. The CTE spend_by_merchant runs an
    ordered-index range scan on idx_card_time, restricted to one card
    over the last hour — the only large table in play. The data nodes
    aggregate SUM(amount) and COUNT(*) grouped by
    merchantkey, returning just a handful of rows (one per merchant
    the card touched in that hour).
  2. The join attaches the merchant attributes.
    m_merchantkey is the primary key of merchant, so each
    row is resolved with a cheap primary-key lookup rather than another scan.
    merchant is a small dimension table.
  3. The outer query re-aggregates the joined result by
    m_category, producing one row per merchant category — a
    compact, model-ready feature vector.

Every stage is a pushdown, and stages such as the index scan and the lookups
run in parallel across the data nodes. We could even execute several CTEs in
parallel. Because RonSQL guarantees the whole thing pushes down, the latency is
bounded and predictable — which is exactly the contract a real-time
inference path needs.

Running a RonSQL query

RonSQL is reachable two ways:

  • REST (RDRS). The RonDB REST server exposes a RonSQL
    endpoint, which is the path used by online serving. It even keeps a built-in
    latency histogram so you can watch the predictable-latency promise hold in
    production. The rondb-cli shell sends a line straight to it with
    the RONSQL prefix.
  • ronsql_cli. A standalone client for scripting
    and experimentation. It reads a query from --execute,
    --execute-file, or stdin and can emit results as JSON
    (ideal for a feature vector) or TEXT.

Both paths support EXPLAIN. Prefixing a query with
EXPLAIN shows the chosen pushdown plan — which index drives
each scan, which joins become lookups, and where the aggregation happens —
so “will this be fast?” is a question you answer before you
ship, not after.

What RonSQL supports today

RonSQL is a read-only, aggregation-focused SQL subset designed so that
everything it accepts can be pushed down:

  • Statements: SELECT only (plus
    EXPLAIN). No DDL/DML.
  • CTEs: multiple, comma-separated WITH clauses
    (non-recursive); a CTE can be joined as a child or used as the driving
    table.
  • Joins: INNER JOIN,
    LEFT [OUTER] JOIN, self-joins, and comma cross-joins over scalar
    CTEs. Equi-join conditions, including composite keys
    (a.x = b.x AND a.y = b.y).
  • Filtering: rich WHERE —
    = <> < <= > >=, LIKE,
    IN (list), IS [NOT] NULL,
    AND/OR/XOR/NOT, arithmetic, bitwise ops, and
    CASE WHEN.
  • Subqueries: EXISTS,
    IN (subquery), and scalar subqueries.
  • Aggregates: COUNT(*), COUNT(expr),
    SUM, MIN, MAX, AVG.
  • Grouping & shaping: GROUP BY
    (multi-column, any table), HAVING,
    ORDER BY ASC/DESC, LIMIT.
  • Expressions: arithmetic, CASE WHEN,
    GREATEST/LEAST, and date/time functions
    DATE_ADD, DATE_SUB, EXTRACT,
    INTERVAL.
  • Index hints: FORCE INDEX,
    USE INDEX, IGNORE INDEX.

Why express features in SQL at all?

Because the Feature Store has to compute the same feature in two very
different settings. Batch training and batch inference run on
engines like Spark SQL and DuckDB — both
batch query engines, chosen for different characteristics (Spark scales the work
across a cluster for very large datasets; DuckDB runs embedded and is hard to
beat on a single node for moderate data). Online serving runs on
RonSQL, computing the feature fresh at inference time. When all
of them speak SQL, the same feature logic can be expressed as the same query text
on each engine, which eliminates a notorious source of
training/serving skew — features that subtly differ
between the model’s training data and what it sees live at inference.

Where RonSQL goes next

RonSQL is already useful, but there is a clear roadmap, much of it driven
directly by Feature Store needs:

  • Distinct-count features. COUNT(DISTINCT ...),
    and an approximate variant (HyperLogLog), to answer “how many distinct
    merchants / devices / countries in the last hour?” — a staple fraud
    signal. DISTINCT and OFFSET more generally.
  • More aggregate functions. STDDEV and
    VARIANCE (for z-score features), and
    GROUP_CONCAT.
  • Point-in-time correctness (“time travel”).
    As-of joins so the same RonSQL query can reconstruct a feature’s value
    at a historical timestamp for training, exactly matching what online serving
    would have returned — closing the skew gap completely.
  • Richer query shapes. Derived tables / subqueries in
    FROM, UNION, RIGHT/FULL OUTER
    JOIN
    , and recursive CTEs for hierarchy/graph features.
  • Vector / embedding pushdown. Top-K nearest-neighbour
    search pushed to the data nodes, as embeddings increasingly live alongside
    scalar features.
  • Cost-based join ordering. The planner currently joins
    left-to-right; reordering based on table/index statistics would make more
    queries fast by default.
  • Continuous / materialised features. Incrementally
    maintaining a CTE’s result as new rows arrive, blurring the line between
    on-demand and pre-computed features.

The core contribution stays the same: predictable low latency for
complex queries over fresh data
, expressed in portable SQL —
exactly what an online Feature Store needs to serve fresh, skew-free features to
an AI model.

Planet for the MySQL Community

Ford Rehires ‘Gray Beard’ Engineers After AI Falls Short

Ford executives said they’ve hired 350 veteran engineers — some of them former employees — after AI and automated systems failed to deliver the desired quality, reports TechCrunch:
Bloomberg reports the company’s chief operating officer Kumar Galhotra told journalists that Ford had been "relying more and more on automated quality systems" with disappointing results. So the company "brought back technical specialists," and those specialists "hunt for failure points before a part ever reaches the plant floor." Charles Poon, Ford’s vice president of vehicle hardware engineering, added, "Mistakenly we thought that by just introducing artificial intelligence and ingesting the design requirements that we had, that that would produce a high-quality product."
The article points out that Ford is using the rehired gray beard engineers to train younger staff — and, to reprogram its AI tools.


Read more of this story at Slashdot.

Slashdot