Python Dash: How to Build a Beautiful Dashboard in 3 Steps
https://ift.tt/2Kx8Arx
Data visualization is an important toolkit for a data scientist. Building beautiful dashboards is an important skill to acquire if you plan to show your insights to a C-Level executive. In this blog post you will get an introduction to a visualization framework in Python. You will learn how to build a dashboard from fetching the data to creating interactive widgets using Dash – a visualization framework in Python.
Introduction to Dash
The dash framework can be divided into two components
- Layouts: Layout is the UI element of your dashboard. You can use components like Button, Table, Radio buttons and define them in your layout.
- Callbacks: Callbacks provide the functionality to add reactivity to your dashboard. It works by using a decorator function to define the input and output entities.
In the next section you will learn how to build a simple dashboard to visualize the marathon performance from 1991 to 2018.
Importing the libraries
Let us first import all the import libraries
import dash
import dash_core_components as dcc
import dash_html_components as html
import dash_split_pane
import plotly.express as px
import pandas as pd
from datetime import datetime
We are importing the pandas library to load the data and the dash library to build the dashboard.
The plotly express library is built on top of ploty to provide some easy-to-use functionalities for data visualization.
First we will begin by downloading the data. The data can be accessed on Kaggle using the following link
Step 1: Initializing a Dash App
We start by initializing a dash app and using the command run_server to start the server.
external_stylesheets = ['https://codepen.io/chriddyp/pen/bWLwgP.css']

app = dash.Dash(__name__, external_stylesheets=external_stylesheets)


if __name__ == '__main__':
   app.run_server(debug=True)
Step 2: Building the Layout
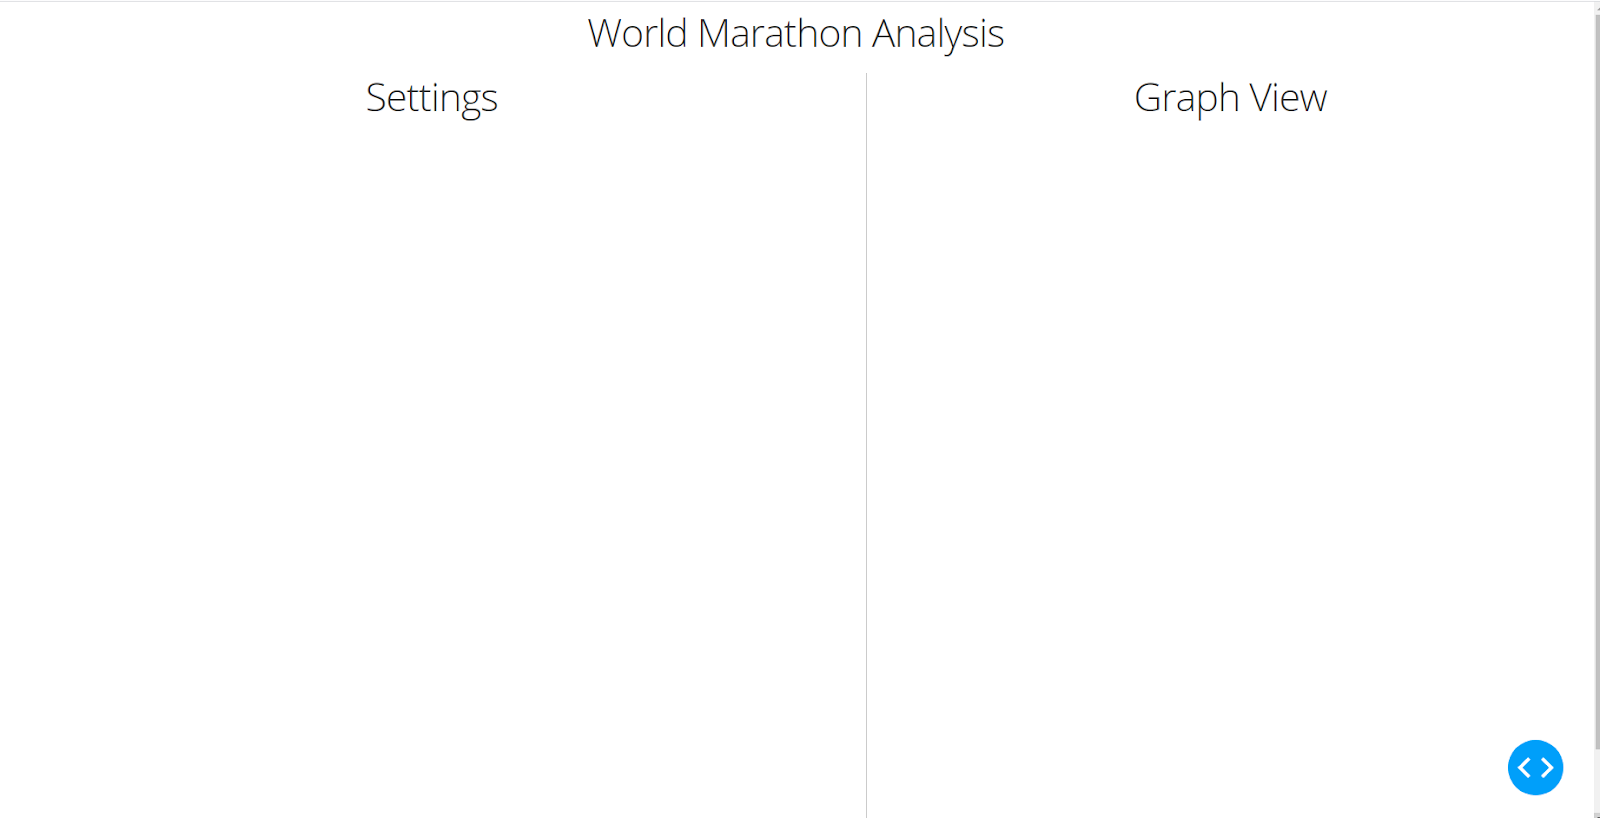
We will start by dividing our UI layer into two parts – the left pane will show the settings window which will include an option to select the year. The right pane will include a graphical window displaying a bar plot.
app.layout = html.Div(children=[
   html.H1(children='World Marathon Analysis',
    style={'textAlign': 'center'}),

   dash_split_pane.DashSplitPane(
   children=[

   html.Div(children=[
        html.H1(children='Settings', style={'textAlign': 'center'}),
           ], style={'margin-left': '50%', 'verticalAlign': 'middle'}),
   html.Div(children=[
        html.H1(children='Graph View', style={'textAlign': 'center'}),
            ])
   ],
   id="splitter",
   split="vertical",
   size=1000,
)

])
We construct two div elements- one for the left pane and the other for the right pane. To align the header elements to the center we use the style tag and using standard CSS syntax to position the HTML elements.
If you now start the server and go to your browser on localhost:8050, you will see the following window.
Step 3: Creating the Dropdown Widget and the Graphical Window
Once we have the basic layout setup we can continue with the remaining parts.
Loading the Data
We begin by loading the data using the pandas library
def convert_to_time(time_in_some_format):
   time_obj =  datetime.strptime(time_in_some_format, '%H:%M:%S').time()
   return time_obj

def get_data():
  df = pd.read_csv('world_marathon_majors.csv', engine="python")
  df['time'] = df['time'].apply(convert_to_time)
  return df
We create two functions to load the data and convert the time value to datetime object values.
The table below shows the first five rows of the dataset.
Every row consists of
- The Year the marathon took place
- The winner of the marathon in that year
- The gender of the winner
- The country the winner represents
- The time to finish the race
- The country in which the marathon took place.

Extending the Layout
The next step is to extend our layout layer by adding the dropdown widget and the graphical window.

app.layout = html.Div(children=[
   html.H1(children='World Marathon Analysis',
    style={'textAlign': 'center'}),

   dash_split_pane.DashSplitPane(
   children=[

   html.Div(children=[
        html.H1(children='Settings', style={'textAlign': 'center'}),
        dcc.Dropdown(id='dropdown-menu', options=[{'label':x, 'value': x} for x in range(df['year'].min(), df['year'].max()+1)],
         value=df['year'].max(),
         style={'width': '220px','font-size': '90%','height': '40px',}
        )
    ], style={'margin-left': '50%', 'verticalAlign': 'middle'}),
   html.Div(children=[
        html.H1(children='Graph View', style={'textAlign': 'center'}),
        dcc.Graph( id='input-graph',figure=get_default_data())
    ])
   ],
   id="splitter",
   split="vertical",
   size=1000,
)
])
We give the dropdown widget a unique id called dropdown-menu and the graphical window is given an id input-graph.
Callbacks
Callbacks are used to enable communication between two widgets.
We define a function called update_output_div which takes the year value whenever the dropdown menu is changed. On every change in the dropdown value the function update_output_div is executed and a bar plot is drawn to indicate the top countries which won the race.
@app.callback(
   dash.dependencies.Output('input-graph', 'figure'),
   [dash.dependencies.Input('dropdown-menu', 'value')]
)
def update_output_div(value):
   test_sample = df[df['year'] == value]
   test_sample = test_sample.groupby('country')['time'].min().reset_index()
   tt = test_sample.sort_values(by=['time'])
   fig = px.bar(tt, y='country', x='time', orientation='h', hover_data=["time"], )
   return fig
Live Demo
Let us now see the dashboard in action.


In this blog post you learned how to build a simple dashboard in Python. You can extend the above dashboard to include more widgets and displaying more graphs for further analysis.
The post Python Dash: How to Build a Beautiful Dashboard in 3 Steps first appeared on Finxter.
Python
via Finxter https://ift.tt/2HRc2LV
December 28, 2020 at 10:59AM