https://picperf.io/https://laravelnews.s3.amazonaws.com/featured-images/pulse.jpg
Laravel Pulse is a brand new free and open source performance monitoring and insights tool for Laravel applications. It was announced at Laracon AU 2023 by Jess Archer from the Laravel core team.
What is Laravel Pulse?
Laravel Pulse gives you an aggregate view of performance data for your Laravel app. It tracks metrics like:
- System stats (CPU, memory, storage usage)
- Application usage (requests, slow routes, jobs, etc)
- Queue throughput
- Slow jobs
- Slow queries
- Exceptions
- Cache hits/misses
- Outgoing request times
Pulse was designed specifically for Laravel and knows about all the core components like queues, events, mail, notifications, caching, and more.
It collects the minimal amount of data needed to display helpful insights. The data is saved locally so you maintain full control.
Laravel Pulse is self-hosted and works anywhere Laravel runs – VPS, Laravel Forge, Vapor, etc. It has a responsive UI with light and dark modes.
And best of all, it’s completely free and open source! Big thanks to Taylor Otwell for making this possible.
How Pulse Compares to Telescope
Some may be wondering how Pulse compares to Laravel Telescope, another debugging tool for Laravel.
Telescope is great for local development as it records extensive request data like all queries and events. But this high level of detail makes it less ideal for production.
Laravel Pulse provides high level aggregate data so it’s lean and production-ready. It won’t replace error trackers, but augments them nicely.
Interactive Live Demo

At Laracon AU, Jess Archer did an interactive live demo of Laravel Pulse using the audience’s phones!
The audience acted as flight admins for a fictional Acme Airlines app. They could perform actions like:
- Sell tickets
- Raise prices
- Delay flights
- Cancel flights
Meanwhile, Jess showed how Laravel Pulse tracked these actions in real-time on a dashboard.
Here’s a recap of some highlights:
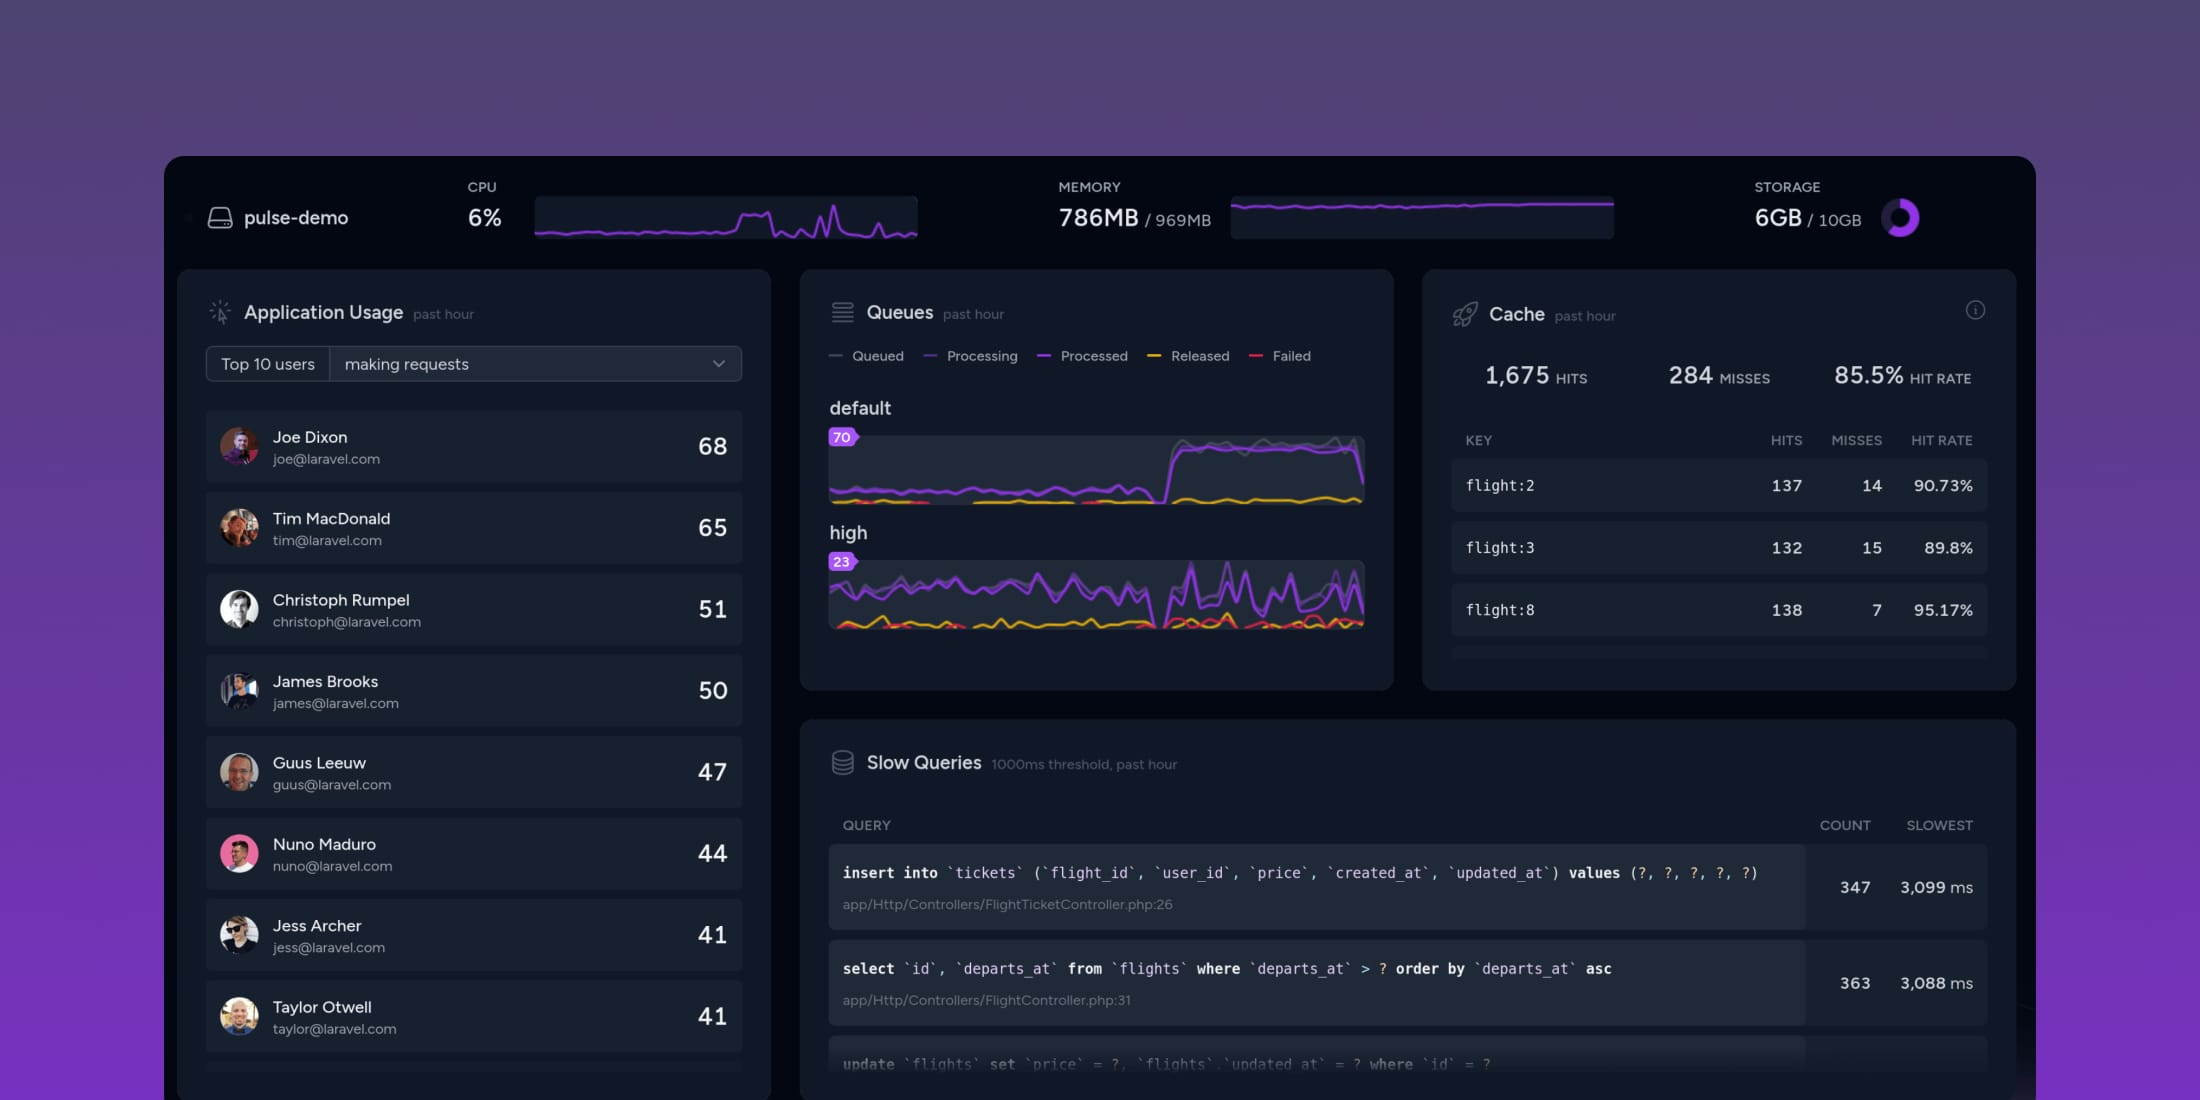
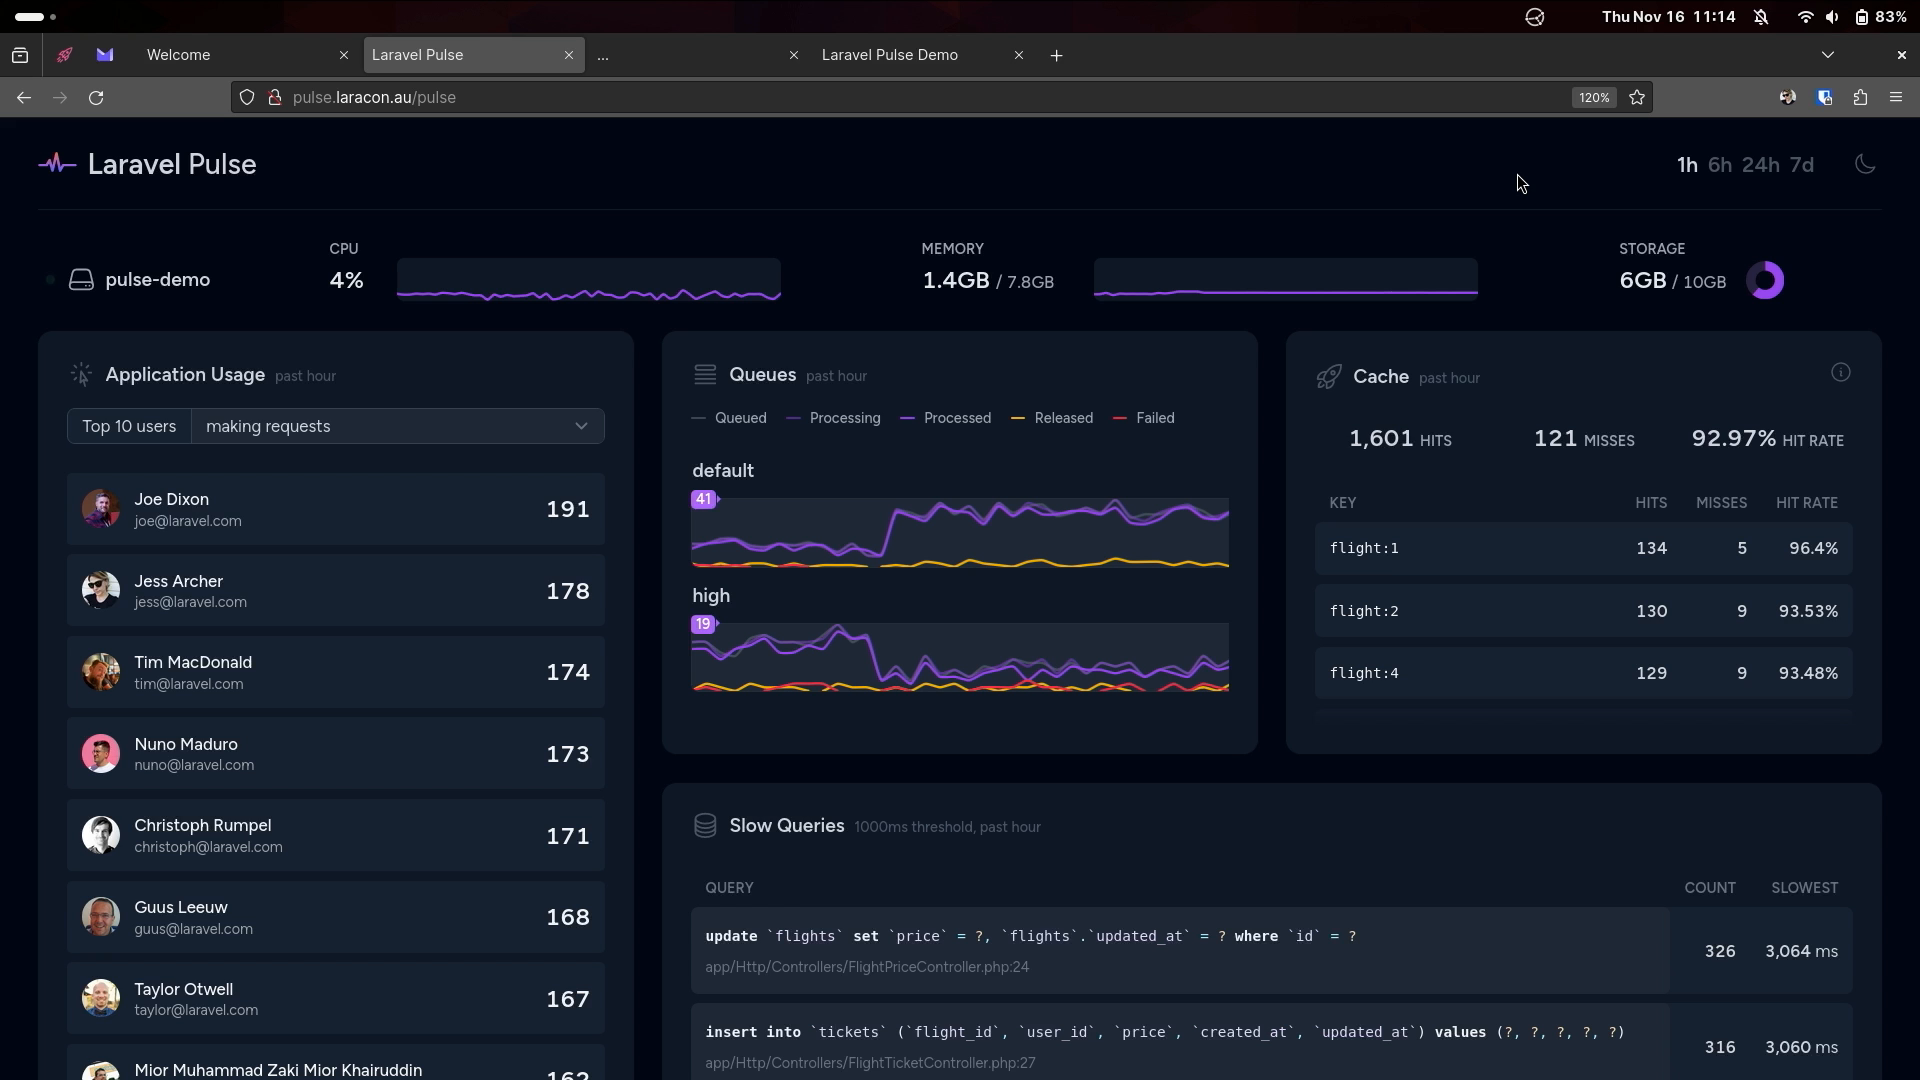
Application Usage

The Application Usage card shows:
- Top users by requests
- Top users by slow endpoints
- Top users queuing jobs
This gives insight into who is using your app and any performance issues they face.
Slow Routes

The Slow Routes card shows any application routes that exceed a configured threshold (1 second default).
It displays the route name and action method so you can pinpoint the slow code.
Slow Jobs

The Slow Jobs card is similar, displaying queued jobs exceeding a threshold. It shows the job class name and location.
Failed jobs that retry will increment the count each time so you can spot problem jobs.
Slow Queries

The Slow Queries card reveals queries over a threshold. It only shows the SQL without bindings so it:
- Obfuscates PII
- Aggregates identical queries into one result
- Shows file location the query occurred
You can optionally disable locations to further aggregate results.
Exceptions

The Exceptions card tracks exceptions thrown including location, count, and last occurrence.
You can also sort by most recent exceptions.
Cache

The Cache card tracks cache key usage, along with hits and misses to the cache.
It will make no assumptions about your keys, but allows regrouping and rolling-up of collected data if you need a more generalised view of the data.
Outgoing Requests

Laravel’s HTTP client usage is tracked in Outgoing Requests. You can see slow external requests your app makes.
The demo used a regex in the config file to condense unique URLs into a generalised domain name, similar toe cache data.
Customizing Your Dashboard
The Pulse blade file can be published and customized. For example, you can:
- Toggle full width mode
- Adjust number of columns
- Set card span and position
- Break cards into individual sections
You can also create your own custom cards to display business-specific metrics. The demo included a "Flights" card showing tickets sold, revenue, delays, and top sellers.
Performance Considerations
Pulse collects minimal data and can handle heavy production workloads. Larave Forge runs it for 2 million requests/day with no sampling needed.
By default, Pulse saves request data to your database after the response is sent. Some options to scale:
- Use a dedicated Pulse database
- Redis ingest to queue and saved outside request cycle
- Run Pulse on a separate server
- Enable sampling for high traffic
- Create custom data drivers
When Can We Use Pulse?
Laravel Pulse is expected to launch in the next week or so. It will be a composer require away. Stay tuned for the official release!
Conclusion
Laravel Pulse provides easy insights into your Laravel app’s performance and usage. Its customizability and minimal overhead makes it a great open source addition for any Laravel project.
Big thanks to the entire Laravel team for another amazing free tool for the community!
The post Announcing Laravel Pulse – A New Performance Monitoring Tool for Laravel Apps appeared first on Laravel News.
Join the Laravel Newsletter to get all the latest Laravel articles like this directly in your inbox.
Laravel News