https://files.realpython.com/media/ie-data-analysis-workflowv3.bfb835b95c5e.png
Data analysis is a broad term that covers a wide range of techniques that enable you to reveal any insights and relationships that may exist within raw data. As you might expect, Python lends itself readily to data analysis. Once Python has analyzed your data, you can then use your findings to make good business decisions, improve procedures, and even make informed predictions based on what youâve discovered.
In this tutorial, youâll:
- Understand the need for a sound data analysis workflow
- Understand the different stages of a data analysis workflow
- Learn how you can use Python for data analysis
Before you start, you should familiarize yourself with Jupyter Notebook, a popular tool for data analysis. Alternatively, JupyterLab will give you an enhanced notebook experience. You might also like to learn how a pandas DataFrame stores its data. Knowing the difference between a DataFrame and a pandas Series will also prove useful.
Get Your Code: Click here to download the free data files and sample code for your mission into data analysis with Python.
In this tutorial, youâll use a file named james_bond_data.csv. This is a doctored version of the free James Bond Movie Dataset. The james_bond_data.csv file contains a subset of the original data with some of the records altered to make them suitable for this tutorial. Youâll find it in the downloadable materials. Once you have your data file, youâre ready to begin your first mission into data analysis.
Understanding the Need for a Data Analysis Workflow
Data analysis is a very popular field and can involve performing many different tasks of varying complexity. Which specific analysis steps you perform will depend on which dataset youâre analyzing and what information you hope to glean. To overcome these scope and complexity issues, you need to take a strategic approach when performing your analysis. This is where a data analysis workflow can help you.
A data analysis workflow is a process that provides a set of steps for your analysis team to follow when analyzing data. The implementation of each of these steps will vary depending on the nature of your analysis, but following an agreed-upon workflow allows everyone involved to know what needs to happen and to see how the project is progressing.
Using a workflow also helps futureproof your analysis methodology. By following the defined set of steps, your efforts become systematic, which minimizes the possibility that youâll make mistakes or miss something. Furthermore, when you carefully document your work, you can reapply your procedures against future data as it becomes available. Data analysis workflows therefore also provide repeatability and scalability.
Thereâs no single data workflow process that suits every analysis, nor is there universal terminology for the procedures used within it. To provide a structure for the rest of this tutorial, the diagram below illustrates the stages that youâll commonly find in most workflows:
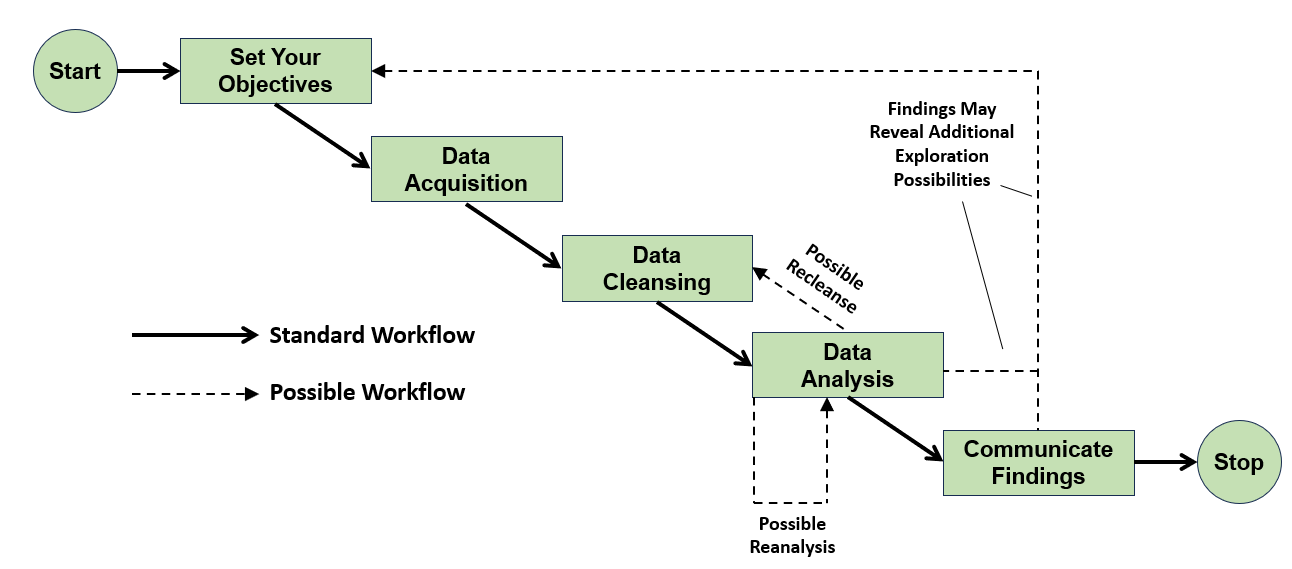 A Data Analysis Workflow
The solid arrows show the standard data analysis workflow that youâll work through to learn what happens at each stage. The dashed arrows indicate where you may need to carry out some of the individual steps several times depending upon the success of your analysis. Indeed, you may even have to repeat the entire process should your first analysis reveal something interesting that demands further attention.
Now that you have an understanding of the need for a data analysis workflow, youâll work through its steps and perform an analysis of movie data. The movies that youâll analyze all relate to the British secret agent Bond ⦠James Bond.
Setting Your Objectives
The very first workflow step in data analysis is to carefully but clearly define your objectives. Itâs vitally important for you and your analysis team to be clear on what exactly youâre all trying to achieve. This step doesnât involve any programming but is every bit as important because, without an understanding of where you want to go, youâre unlikely to ever get there.
The objectives of your data analysis will vary depending on what youâre analyzing. Your team leader may want to know why a new product hasnât sold, or perhaps your government wants information about a clinical test of a new medical drug. You may even be asked to make investment recommendations based on the past results of a particular financial instrument. Regardless, you must still be clear on your objectives. These define your scope.
In this tutorial, youâll gain experience in data analysis by having some fun with the James Bond movie dataset mentioned earlier. What are your objectives? Now pay attention, 007:
- Is there any relationship between the Rotten Tomatoes ratings and those from IMDb?
- Are there any insights to be gleaned from analyzing the lengths of the movies?
- Is there a relationship between the number of enemies James Bond has killed and the user ratings of the movie in which they were killed?
Now that youâve been briefed on your mission, itâs time to get out into the field and see what intelligence you can uncover.
Acquiring Your Data
Once youâve established your objectives, your next step is to think about what data youâll need to achieve them. Hopefully, this data will be readily available, but you may have to work hard to get it. You may need to extract it from the data storage systems within an organization or collect survey data. Regardless, youâll somehow need to get the data.
In this case, youâre in luck. When your bosses briefed you on your objectives, they also gave you the data in the james_bond_data.csv file. You must now spend some time becoming familiar with what you have in front of you. During the briefing, you made some notes on the content of this file:
| Heading | Meaning |
|---|---|
Release |
The release date of the movie |
Movie |
The title of the movie |
Bond |
The actor playing the title role |
Bond_Car_MFG |
The manufacturer of James Bondâs car |
US_Gross |
The movieâs gross US earnings |
World_Gross |
The movieâs gross worldwide earnings |
Budget ($ 000s) |
The movieâs budget, in thousands of US dollars |
Film_Length |
The running time of the movie |
Avg_User_IMDB |
The average user rating from IMDb |
Avg_User_Rtn_Tom |
The average user rating from Rotten Tomatoes |
Martinis |
The number of martinis that Bond drank in the movie |
As you can see, you have quite a variety of data. You wonât need all of it to meet your objectives, but you can think more about this later. For now, youâll concentrate on getting the data out of the file and into Python for cleansing and analysis.
Read the full article at https://realpython.com/python-for-data-analysis/ »
[ Improve Your Python With ð Python Tricks ð â Get a short & sweet Python Trick delivered to your inbox every couple of days. >> Click here to learn more and see examples ]
Planet Python