The year was 1998. Britney Spears topped the charts, Bill Clinton was impeached, and a couple of little websites called Google and Ars Technica came online. It was also the year Nintendo released The Legend of Zelda: Ocarina of Time on the Nintendo 64. Google, which has come to dominate the Internet (Ars is still working on that), is celebrating the imminent release of the Ocarina of Time remaster by temporarily transporting us back to that storied year with a search Easter egg.
To access the Google time machine, you just have to search for either "Zelda" or "Ocarina of Time." Google will load the standard 2026 results page, but you’ll see an animated Master Sword in the lower right corner. It appears on both mobile and desktop—just click the sword and enjoy the show.
After a little time-skipping animation and a Link shout (you know the one), you’ll swear it’s 1998 again. The search page is transformed into a simple list of blue links with retro Google branding. This is particularly apt given the time-shifting mechanics in Ocarina of Time.
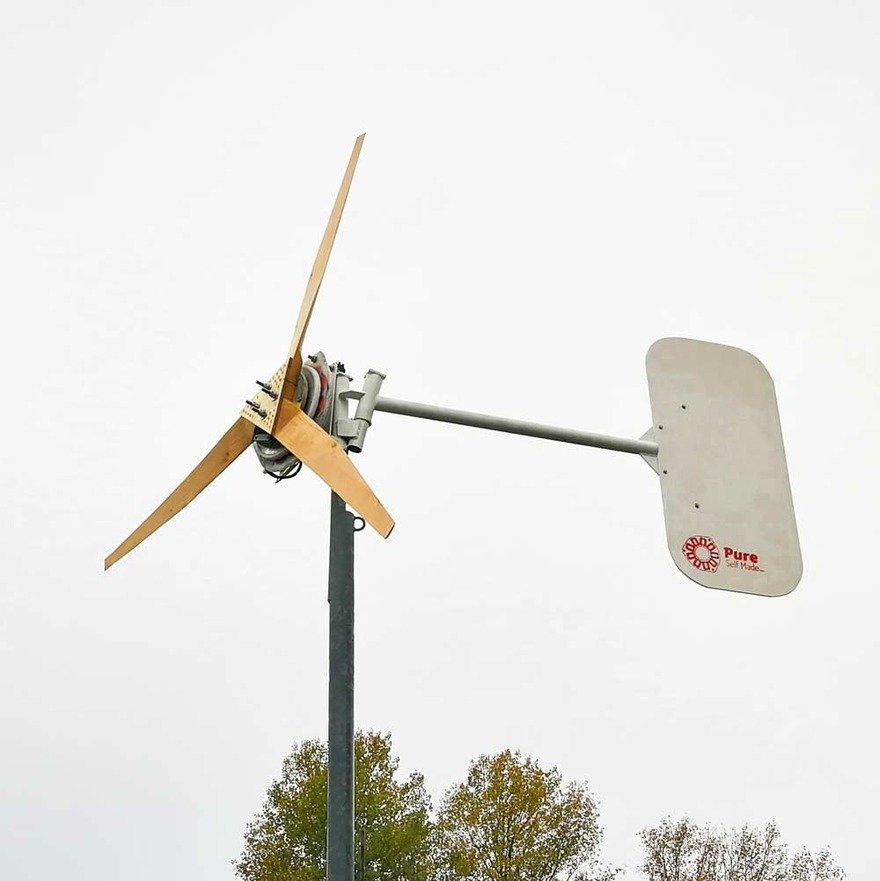
Since the 1970s, self-taught engineer Hugh Piggott has been building wind turbines from scratch in his native Scotland. In the 2000s, he started holding workshops showing participants how to build their own. Jonathan Schreiber, an Austrian renewable-energy practitioner, took Piggott’s course in 2012.
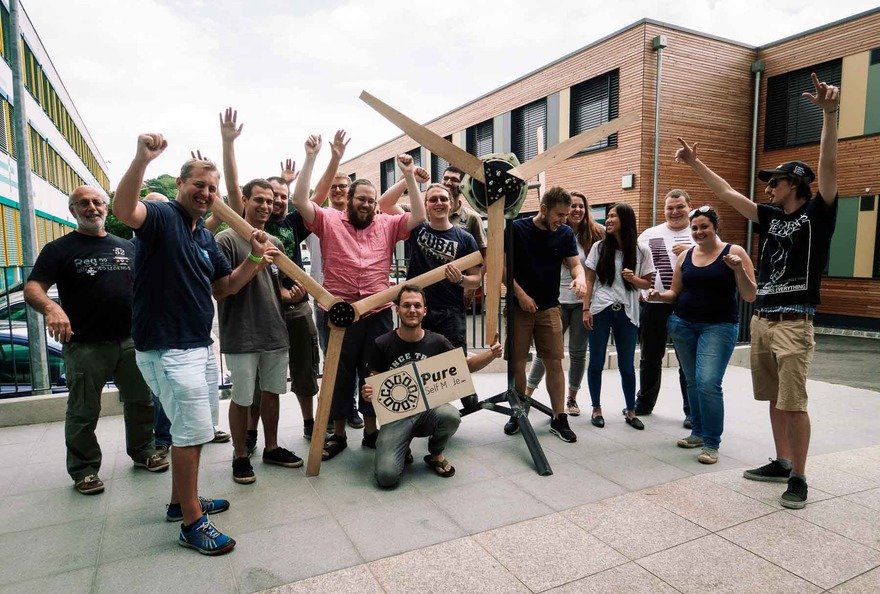
Piggott no longer teaches, but now Schreiber has picked up the mantle. He formed PureSelfMade, an independent-energy education project, and since 2013 has hosted workshops showing participants how to build Piggott’s design.
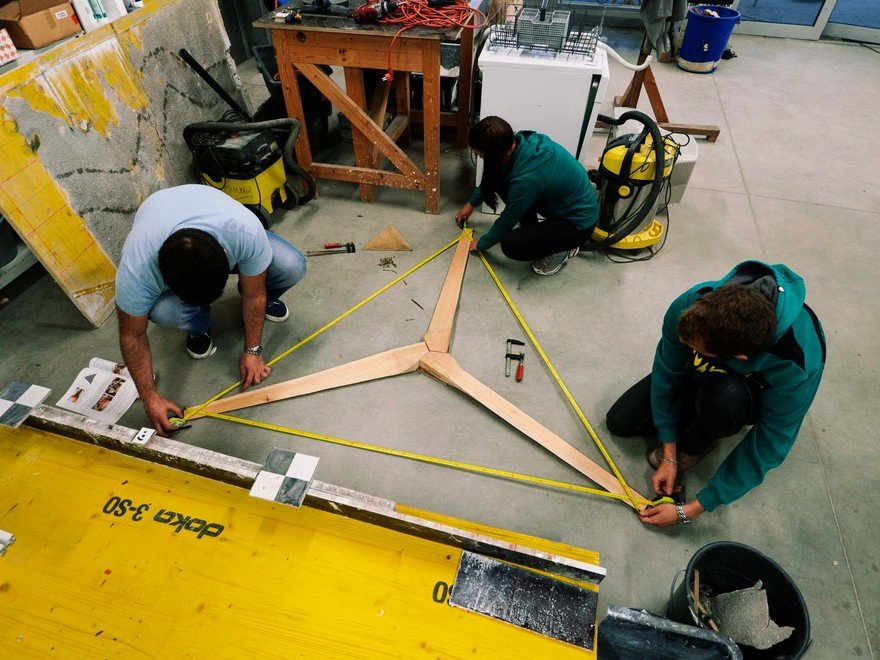
At these workshops, you do not assemble a wind turbine kit. Instead you literally build the entire thing, including the generator, from scratch. You learn to carve the blades, wind copper wire to make the coils, use an angle grinder to cut the steel, et cetera:
PureSelfMade’s upcoming wind turbine workshops are held in Germany and Austria, and conducted in German. They’re also working on setting up English-language workshops in the UK.
Short answer: $10,000 put into SPY on January 3, 2000 grew to $83,195 by October 30, 2026 with every dividend reinvested. Taking the dividends as cash left you with $59,123: $51,962 in shares plus $7,161 in collected dividends. That makes reinvesting worth $24,072, or 41% more money, on a fund that yields only about 1% a year.
This dividend reinvestment calculator doesn’t assume a smooth 7% return. It replays every real SPY, VYM, SCHD and QQQ dividend from Yahoo Finance, day by day, with and without reinvestment. The Python script is below, so you can run it on your own tickers.
TL;DR
$10,000 in SPY from Jan 2000: $83,195 with dividends reinvested vs $59,123 taking cash, a +$24,072 (41%) edge.
Since SPY’s 1993 launch: $314,411 vs $197,803, +59%. Edge scales with yield × years (QQQ +14%, VYM +43%).
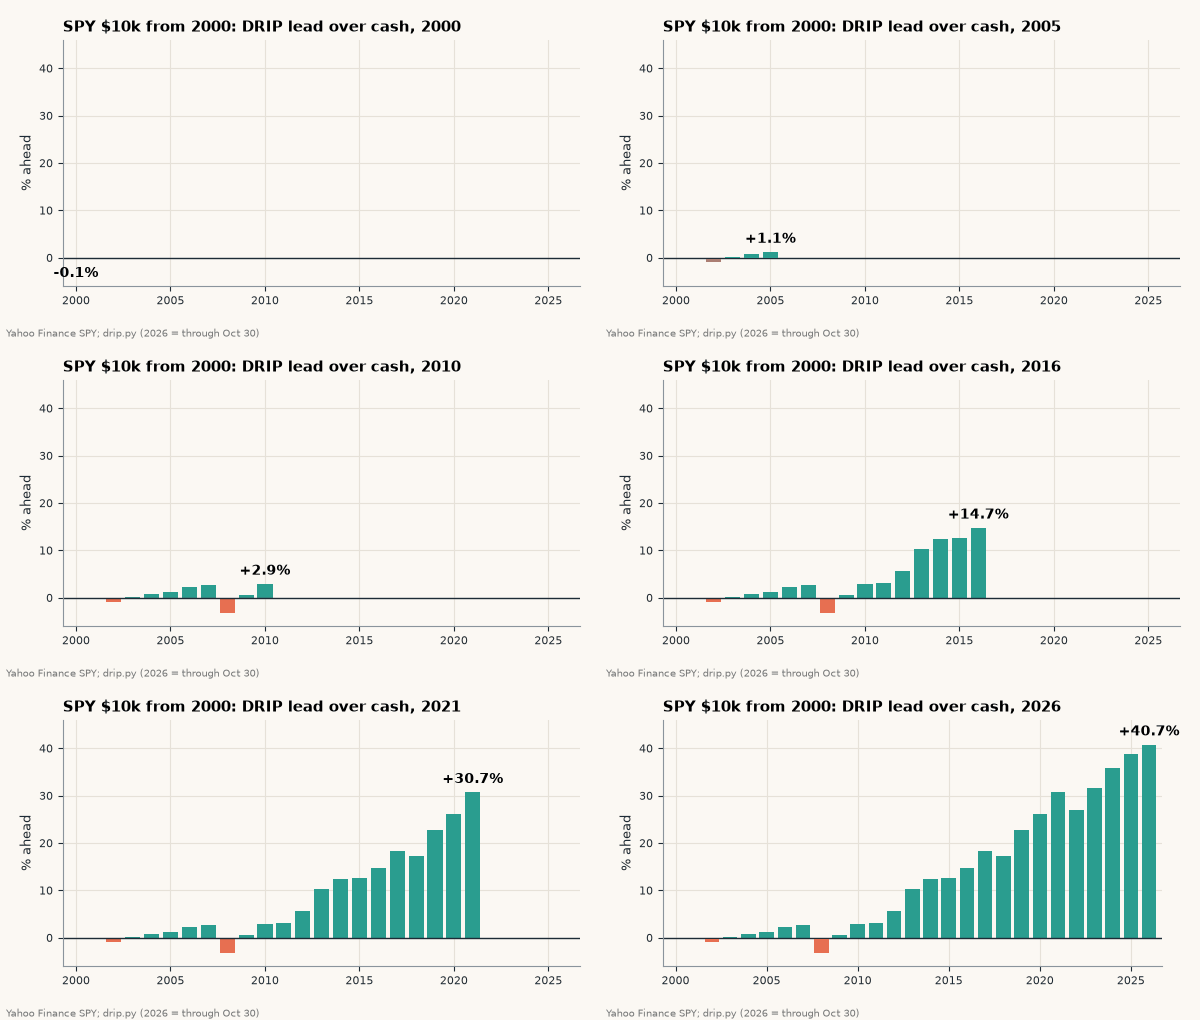
The DRIP account was behind in 2000–2002 and 2008, and ahead only 3.2% by 2011. The payoff came in the second decade.
With $500/month added: $1,049,823 vs $846,717, a $203,106 gap.
Reinvested dividends are still taxed in taxable accounts; a 15% rate cut the result to $77,535. Python script included.
How the calculator works (assumptions labeled)
The script, drip.py, does what a broker’s DRIP does, and labels its simplifications:
Data: daily closes plus per-share dividends from Yahoo Finance via yfinance, through October 30, 2026.
Assumption 1: each dividend is reinvested at the close on its ex-date. Real brokers buy on the payment date, a few days later. That’s a small difference over 27 years.
Assumption 2: in the “no DRIP” case the cash just sits there at 0%. This is the honest version of “I’ll spend it or leave it in the account”.
Assumption 3: no taxes or fees unless I say so. Taxes get their own section below.
As a sanity check, Yahoo’s dividend-adjusted price series turns the same $10,000 into $83,131. My day-by-day replay lands at $83,195, a 0.1% difference. So the replay matches total return.
The results: DRIP vs cash, five real histories
ETF
Start
Years
$10,000 with DRIP
$10,000, dividends as cash
DRIP edge
SPY
Jan 03, 2000
26.8
$83,195 (8.22%/yr)
$59,123 (6.85%/yr)
+$24,072 (+41%)
SPY
Jan 29, 1993
33.7
$314,411 (10.76%/yr)
$197,803 (9.25%/yr)
+$116,608 (+59%)
VYM
Nov 16, 2006
20.0
$59,485 (9.35%/yr)
$41,668 (7.41%/yr)
+$17,818 (+43%)
SCHD
Oct 20, 2011
15.0
$69,132 (13.73%/yr)
$54,081 (11.89%/yr)
+$15,050 (+28%)
QQQ
Jan 03, 2000
26.8
$86,575 (8.38%/yr)
$75,786 (7.84%/yr)
+$10,789 (+14%)
Yahoo Finance daily closes + dividends to Oct 30, 2026; cash case = shares + uninvested dividends at 0%; no taxes or fees. drip.py
The SPY row is the headline. Without reinvestment you still owned your original 68.8 shares. With it, quarterly dividends quietly bought another 41 shares, so you finish with 110.1 shares. Each of those shares is now worth about $756 and pays its own dividends.
Go back further and the gap widens. From SPY’s first trading day in January 1993, $10,000 grew to $314,411 with DRIP versus $197,803 without. That’s $116,608 (59%) more, and the only difference is what you did with a 1–2% yield.
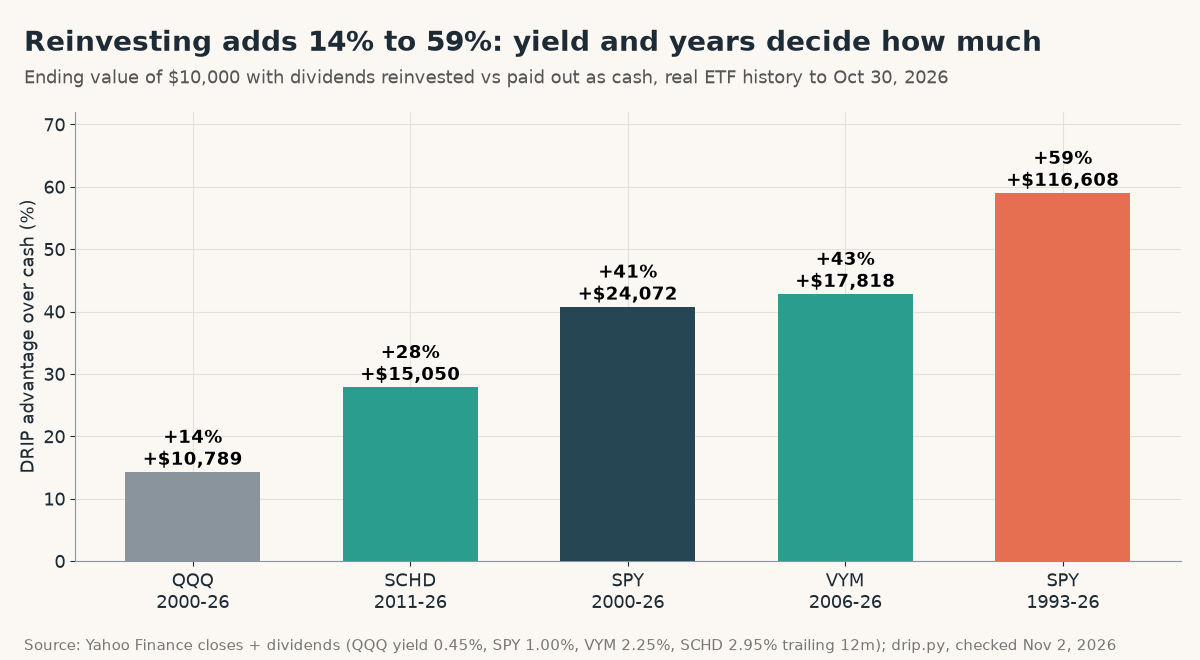
The DRIP edge scales with yield and years: from +14% for low-yield QQQ to +59% for SPY since 1993 (drip.py, Yahoo Finance data).
Two dials decide how much reinvesting adds:
Yield. QQQ paid only 0.45% over the last 12 months, so 27 years of reinvesting added just 14%. VYM, at 2.25%, added 43% in only 20 years.
Time. SCHD yields the most (2.95%), but its history only starts in October 2011. Fifteen years of reinvesting added 28% ($15,050). It simply hasn’t had SPY’s 33 years yet.
Napkin rule: the DRIP edge grows roughly with yield × years. A 1% yield over 27 years (SPY) and a 2.25% yield over 20 years (VYM) both landed near +41–43%.
The surprise: reinvesting barely mattered for 12 years
Here’s the part no compound-interest calculator shows you. Reinvesting doesn’t pull ahead in a straight line. In the SPY run that started in 2000, the DRIP account was behind the cash account at the end of 2000, 2001, 2002 and 2008.
Reinvesting barely mattered for 12 years (−3.2% in 2008), then compounding took the lead to 40.7%.
The reason is simple. Every dividend reinvested in 2000–2002 bought shares that then fell during the dot-com crash. The cash version held those dollars at full value. At the end of 2008 the DRIP account was 3.2% behind. Its lead was still only 3.2% at the end of 2011.
After that, compounding took over. The lead hit 10% in 2013, 26% in 2020, and 40.7% by October 30, 2026. If you check your DRIP after a few years and see nothing, that’s normal. The payoff comes in the second decade.
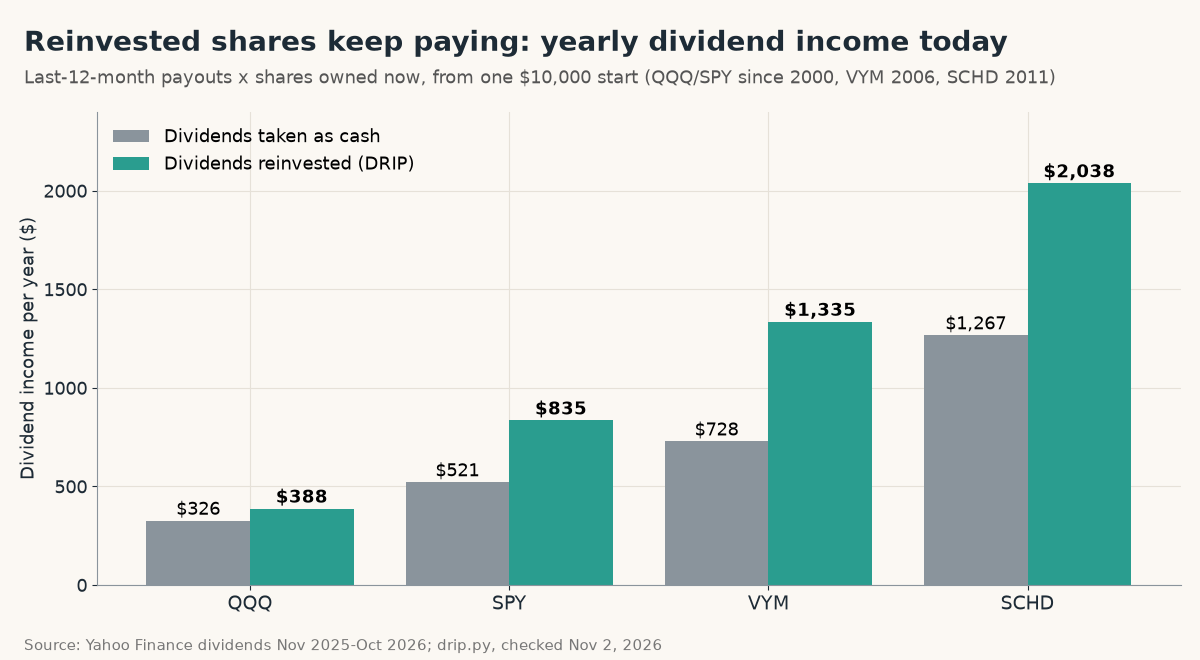
People rarely reinvest for the final balance alone. They want a larger dividend check later. So the calculator multiplies the last 12 months of per-share payouts by the shares you hold now:
Reinvested shares pay their own dividends: SPY income is 60% higher ($835 vs $521 a year).
From one $10,000 start, SPY now pays $835 a year to the DRIP investor versus $521 to the cash investor, 60% more income from the same original money. SCHD pays $2,038 versus $1,267. With reinvestment, each new share pays dividends too, so the income grows on its own.
With monthly contributions the gap reaches six figures
Most people don’t invest once and walk away. So I ran the calculator again with $10,000 up front plus $500 on the first trading day of every month into SPY from January 2000. That’s $170,500 contributed in total (the same approach as the monthly plan in my lump sum vs DCA on the S&P 500 backtest).
SPY scenario (Jan 2000–Oct 2026)
Contributed
With DRIP
Dividends as cash
Gap
$10,000 once
$10,000
$83,195
$59,123
+$24,072 (+41%)
$10,000 + $500/month
$170,500
$1,049,823
$846,717
+$203,106 (+24%)
$10,000 once, 15% tax on dividends (assumption)
$10,000
$77,535
n/a
−$5,660 vs untaxed DRIP
drip.py on Yahoo Finance data. Tax row is a labeled assumption, not advice.
With reinvestment the account crosses $1,049,823. Without it, it reaches $846,717. The difference is $203,106, more than the total amount contributed. Monthly money shrinks the gap in percentage terms (24% vs 41%), because fresh cash hasn’t had time to compound. In dollars, though, the gap grows a lot.
Taxes: reinvesting doesn’t dodge them
In a taxable US account, the IRS treats reinvested dividends exactly like cash dividends. Publication 550 says that if you use your dividends to buy more stock, “you must still report the dividends as income”. So DRIP isn’t a tax strategy. It’s a compounding strategy.
Qualified dividends are taxed at long-term capital gain rates (IRS Topic 404). For 2025 those rates are 0%, 15% or 20% depending on taxable income, and “no higher than 15% for most individuals” (IRS Topic 409).
Assumption: a flat 15% on every SPY dividend, with tax paid out of the dividend before reinvesting. The DRIP result falls from $83,195 to $77,535, a $5,660 drag over 27 years. In a tax-advantaged account like an IRA or 401(k), there’s no yearly drag and the untaxed numbers above apply.
Don’t double count: if you test DRIP yourself, replay dividends on the raw close, or use the adjusted close alone. Doing both counts every dividend twice and inflates the result.
The Python dividend reinvestment calculator
Install yfinance and pandas, then save the prices once (so reruns don’t hit Yahoo every time) and run the script:
import yfinance as yf, pandas as pd
d = {t: yf.Ticker(t).history(start="1993-01-01", end="2026-11-01", auto_adjust=False, actions=True)
     for t in ["SPY", "SCHD", "VYM", "QQQ"]}
pd.to_pickle(d, "src/prices.pkl")
auto_adjust=False keeps the raw (split-adjusted) close and the separate Dividends column. If you replayed dividends on top of the dividend-adjusted close, you’d count them twice.
"""Dividend reinvestment calculator: replay real ETF history (Yahoo Finance closes + dividends),
with vs without reinvesting dividends, optional monthly contributions and dividend tax."""
import pandas as pd

def load(path="src/prices.pkl"):
    d = pd.read_pickle(path)
    return {t: h[["Close", "Dividends"]].tz_localize(None).loc[:"2026-10-30"] for t, h in d.items()}

def drip(h, start, initial=10_000, monthly=0, reinvest=True, tax=0.0):
    """Daily replay. Dividends paid on the ex-date at that day's close (a common approximation)."""
    h = h.loc[start:]
    shares, cash, paid, invested, month, rows = 0.0, 0.0, 0.0, 0.0, None, []
    for day, (px, div) in h.iterrows():
        if month is None:
            shares, invested = initial / px, initial
        elif day.month != month and monthly:
            shares += monthly / px; invested += monthly
        month = day.month
        if div > 0:
            net = shares * div * (1 - tax); paid += net
            if reinvest: shares += net / px
            else: cash += net
        rows.append((day, shares * px + cash, shares * px, cash, invested, paid))
    return pd.DataFrame(rows, columns=["date", "total", "stock", "cash", "invested", "divs"]).set_index("date")

def cagr(s):
    yrs = (s.index[-1] - s.index[0]).days / 365.25
    return (s.iloc[-1] / s.iloc[0]) ** (1 / yrs) - 1

if __name__ == "__main__":
    P = load()
    for t, start in (("SPY", "2000-01-03"), ("SPY", "1993-01-29"), ("SCHD", "2011-10-20"), ("VYM", "2006-11-16"), ("QQQ", "2000-01-03")):
        a, b = drip(P[t], start), drip(P[t], start, reinvest=False)
        yrs = (a.index[-1] - a.index[0]).days / 365.25
        print(f"{t} {a.index[0]:%b %Y}-{a.index[-1]:%b %Y} ({yrs:.1f} yrs) $10k: DRIP ${a.total.iloc[-1]:,.0f} "
              f"(CAGR {cagr(a.total):.2%}) | no DRIP ${b.total.iloc[-1]:,.0f} = ${b.stock.iloc[-1]:,.0f} shares + ${b.cash.iloc[-1]:,.0f} cash "
              f"(CAGR {cagr(b.total):.2%}) | DRIP edge ${a.total.iloc[-1]-b.total.iloc[-1]:,.0f} ({a.total.iloc[-1]/b.total.iloc[-1]-1:.0%}) | "
              f"shares {a.stock.iloc[-1]/P[t].Close.iloc[-1]:.1f} vs {b.stock.iloc[-1]/P[t].Close.iloc[-1]:.1f}")
    a = drip(P["SPY"], "2000-01-03", monthly=500); b = drip(P["SPY"], "2000-01-03", monthly=500, reinvest=False)
    print(f"SPY 2000 $10k + $500/mo (invested ${a.invested.iloc[-1]:,.0f}): DRIP ${a.total.iloc[-1]:,.0f} | no DRIP ${b.total.iloc[-1]:,.0f}")
    t15 = drip(P["SPY"], "2000-01-03", tax=0.15)
    print(f"SPY 2000 $10k DRIP with 15% dividend tax: ${t15.total.iloc[-1]:,.0f}")
    # annual dividend income at the end (last 12 months of per-share payouts x shares held)
    for t, start in (("SPY", "2000-01-03"), ("VYM", "2006-11-16"), ("SCHD", "2011-10-20"), ("QQQ", "2000-01-03")):
        ttm = P[t].Dividends.loc["2025-10-31":].sum(); px = P[t].Close.iloc[-1]
        a, b = drip(P[t], start), drip(P[t], start, reinvest=False)
        print(f"{t} trailing-12m payout ${ttm:.3f}/share = {ttm/px:.2%} yield; yearly income DRIP ${ttm*a.stock.iloc[-1]/px:,.0f} vs no DRIP ${ttm*b.stock.iloc[-1]/px:,.0f}")
Output on October 30, 2026 data:
SPY Jan 2000-Oct 2026 (26.8 yrs) $10k: DRIP $83,195 (CAGR 8.22%) | no DRIP $59,123 = $51,962 shares + $7,161 cash (CAGR 6.85%) | DRIP edge $24,072 (41%) | shares 110.1 vs 68.8
SPY Jan 1993-Oct 2026 (33.7 yrs) $10k: DRIP $314,411 (CAGR 10.76%) | no DRIP $197,803 = $171,999 shares + $25,804 cash (CAGR 9.25%) | DRIP edge $116,608 (59%) | shares 416.0 vs 227.6
SCHD Oct 2011-Oct 2026 (15.0 yrs) $10k: DRIP $69,132 (CAGR 13.73%) | no DRIP $54,081 = $42,970 shares + $11,111 cash (CAGR 11.89%) | DRIP edge $15,050 (28%) | shares 1932.1 vs 1201.0
VYM Nov 2006-Oct 2026 (20.0 yrs) $10k: DRIP $59,485 (CAGR 9.35%) | no DRIP $41,668 = $32,449 shares + $9,218 cash (CAGR 7.41%) | DRIP edge $17,818 (43%) | shares 363.3 vs 198.2
QQQ Jan 2000-Oct 2026 (26.8 yrs) $10k: DRIP $86,575 (CAGR 8.38%) | no DRIP $75,786 = $72,875 shares + $2,911 cash (CAGR 7.84%) | DRIP edge $10,789 (14%) | shares 125.4 vs 105.5
SPY 2000 $10k + $500/mo (invested $170,500): DRIP $1,049,823 | no DRIP $846,717
SPY 2000 $10k DRIP with 15% dividend tax: $77,535
SPY trailing-12m payout $7.583/share = 1.00% yield; yearly income DRIP $835 vs no DRIP $521
VYM trailing-12m payout $3.676/share = 2.25% yield; yearly income DRIP $1,335 vs no DRIP $728
SCHD trailing-12m payout $1.055/share = 2.95% yield; yearly income DRIP $2,038 vs no DRIP $1,267
QQQ trailing-12m payout $3.091/share = 0.45% yield; yearly income DRIP $388 vs no DRIP $326
To use it for your own holdings, change the ticker, start, initial, monthly and tax. If you also want to see whether your picks beat the index after dividends, my guide to comparing your portfolio to the S&P 500 uses the same total-return logic.
What to do with this
Question
What the data says
What to do
How much is DRIP worth?
+14% (QQQ) to +59% (SPY since 1993) more ending value
Turn it on unless you need the income
When does it pay off?
SPY lead ≤3.2% through 2011, 40.7% by 2026
Judge it after a decade, not a year
Does it help income?
SPY: $835 vs $521 a year from the same $10k
Reinvest during accumulation, take cash later
Does it avoid tax?
No: reinvested dividends are still taxable (IRS Pub 550)
Prefer IRA/401(k) for high-yield funds
Is high yield better?
QQQ (0.45% yield) still ended at $86,575 vs SPY $83,195
Pick funds on total return, not yield
Sources: drip.py on Yahoo Finance data; IRS Publication 550, Topics 404 and 409. History, not a forecast.
Turn DRIP on in tax-advantaged accounts unless you need the income now. Across these five histories, that one setting was worth 14–59% more money.
In taxable accounts, reinvest anyway if you were going to reinvest by hand. The tax is the same either way. DRIP just stops cash from sitting idle.
Judge it after 10+ years, not 3. The SPY run was behind or within about 3% of the cash version for its first 12 years.
Don’t chase yield for the DRIP edge alone. QQQ’s tiny 0.45% yield still finished with a higher DRIP balance than SPY ($86,575 vs $83,195), because price growth did the work.
Limitations: ex-date reinvestment, 0% on idle cash, no fees, and one 15% tax assumption. SCHD and VYM have shorter histories. This is history, not a forecast, and not investment advice.
From calculator to finance ebook
If you’ve worked through numbers like these, you already have the outline of a short, useful ebook: “DRIP vs cash, with real data”. You could use it as a lead magnet for a finance newsletter or sell it on KDP. ImagineYourBook is an AI book-writing tool that turns a prompt or your notes into a complete draft with a designed cover and Word and EPUB downloads. It also has a Manuscript Rewrite feature for updating an existing book, for example when next year’s dividend data comes in.
Takeaway: reinvesting SPY’s roughly 1% yield turned $10,000 into $83,195 instead of $59,123. The edge was invisible for 12 years and worth 41% after 27. Run the script on your own tickers, keep DRIP on, and give it a decade.
If you want to package what you learned into a book, ImagineYourBook‘s trial is $0 today with a card required. It includes one 10,000-word Small Book, the first $29.99 charge comes after 7 days, and you can cancel any time before day 8. Treat the result as a draft: check every number before you publish.