https://blog.finxter.com/wp-content/uploads/2026/10/how-often-to-rebalance-portfolio-trades-vs-results.png
How often to rebalance a portfolio? Once a year is enough for most people. I backtested a 60/40 portfolio on real Vanguard fund data from December 1986 to September 2026. Rebalancing every December took 39 trades. Monthly rebalancing took 477. Both landed on the same Sharpe ratio (0.64 vs 0.63), and the yearly version actually had the smaller worst drawdown (−30.8% vs −32.5%).
Never rebalancing is the one choice that really changes the result. Leave a “60/40” alone for 40 years and it ends up 93.9% stocks. You get a higher return, but you’re also holding a much riskier portfolio than the one you picked.
Below you’ll find the numbers, the charts, and the full Python script, so you can rerun it on your own funds.
TL;DR
- Once a year is enough: 39 yearly rebalances matched 477 monthly ones on Sharpe ratio (0.64 vs 0.63) in a 60/40 VFINX/VBMFX backtest, Dec 1986 to Sep 2026.
- Yearly rebalancing even had the smaller worst drawdown: −30.8% vs −32.5% for monthly.
- A 5-point band (trade only when stocks leave 55-65%) needed just 26 trades for the best Sharpe (0.65).
- Never rebalancing earned more ($442,046 vs $312,520 for yearly, from $10,000) but drifted to 93.9% stocks and fell −38.7% in 2008-09.
- Across 358 rolling 10-year windows, monthly vs yearly differed by a median of only −0.11 points a year. Python script included.
The setup: two real funds, five rules
I wanted to test funds you could actually have owned, not idealized indexes:
- Stocks: VFINX (Vanguard 500 Index Fund, tracks the S&P 500)
- Bonds: VBMFX (Vanguard Total Bond Market Index Fund)
Both series are Yahoo Finance adjusted closes, so dividends and interest are reinvested and fund fees are already included. Each test starts with $10,000 at 60% stocks and 40% bonds on December 31, 1986, and runs on month-end data for 477 months through September 30, 2026. The 3-month T-bill rate from FRED is the cash rate for the Sharpe ratio.
The only thing that changes between tests is the rebalancing rule:
- Never (buy and hold)
- Monthly, back to 60/40 at every month-end
- Quarterly, every March, June, September and December
- Once a year, every December
- 5-point band: check every month, but only trade when stocks drift more than 5 percentage points from 60% (below 55% or above 65%)
Here is the script. It needs pip install yfinance pandas. If you’re new to time-series resampling, Finxter’s pandas DataFrame resample() guide explains the resample("ME").last() line that turns daily prices into month-end prices.
"""How often to rebalance a 60/40 portfolio? Backtest on real fund data, Dec 1986 to Sep 2026.
Stocks: VFINX (Vanguard 500 Index, S&P 500). Bonds: VBMFX (Vanguard Total Bond Market Index).
Yahoo Finance adjusted closes (dividends reinvested, fund fees included), month-ends.
Cash rate for Sharpe: FRED TB3MS (3-month T-bill).  pip install yfinance pandas"""
import pandas as pd

START, END, W = "1986-12-31", "2026-09-30", 0.60

def load():
    try:  # cached copies used for the article
        adj = pd.read_pickle("src/raw_yf.pkl")["Adj Close"][["VFINX", "VBMFX"]]
        tb = pd.read_csv("src/tb3ms.csv", parse_dates=[0], index_col=0).iloc[:, 0]
    except FileNotFoundError:
        import yfinance as yf
        adj = yf.download(["VFINX", "VBMFX"], start="1986-12-01", auto_adjust=False, progress=False)["Adj Close"]
        tb = pd.read_csv("https://fred.stlouisfed.org/graph/fredgraph.csv?id=TB3MS", parse_dates=[0], index_col=0).iloc[:, 0]
    px = adj.resample("ME").last().loc[START:END]
    tb.index = tb.index + pd.offsets.MonthEnd(0)
    rf = (tb / 100 / 12).reindex(px.index).ffill()
    return px.pct_change().dropna(), rf.iloc[1:]

def backtest(r, rule, w=W, band=0.05, start_value=10_000):
    """rule: 'never' | 'monthly' | 'quarterly' | 'annual' | 'band'. Rebalance at month-end after returns."""
    s, b = start_value * w, start_value * (1 - w)
    vals, wts, n_reb, turnover = [], [], 0, 0.0
    for d, (rs, rb) in r.iterrows():
        s *= 1 + rs; b *= 1 + rb; v = s + b; eq = s / v
        due = {"never": False, "monthly": True, "quarterly": d.month in (3, 6, 9, 12),
               "annual": d.month == 12, "band": abs(eq - w) > band}[rule]
        if due and abs(eq - w) > 1e-12:
            turnover += abs(eq - w) * v; n_reb += 1
            s, b = v * w, v * (1 - w); eq = w
        vals.append(v); wts.append(eq)
    return pd.DataFrame({"value": vals, "equity_w": wts}, index=r.index), n_reb, turnover

def stats(df, rf, n_reb, turnover):
    v = df.value; m = v.pct_change().fillna(v.iloc[0] / 10_000 - 1); yrs = len(v) / 12
    ex = m - rf.values
    return dict(end=v.iloc[-1], cagr=(v.iloc[-1] / 10_000) ** (1 / yrs) - 1, vol=m.std() * 12 ** 0.5,
                max_dd=(v / v.cummax() - 1).min(), dd_at=(v / v.cummax() - 1).idxmin(),
                sharpe=ex.mean() / m.std() * 12 ** 0.5, rebalances=n_reb,
                turnover_yr=turnover / v.mean() / yrs, max_eq=df.equity_w.max(), end_eq=df.equity_w.iloc[-1])

RULES = {"never": "Never (buy & hold)", "monthly": "Monthly", "quarterly": "Quarterly",
         "annual": "Once a year (Dec)", "band": "When off by 5 points"}

def run():
    r, rf = load()
    res = {k: backtest(r, k) for k in RULES}
    return r, rf, res, {k: stats(df, rf, n, t) for k, (df, n, t) in res.items()}

def rolling(r, rf, years=10):
    """CAGR and max drawdown of each rule in every rolling `years` window (monthly starts)."""
    n, rows = years * 12, []
    for i in range(0, len(r) - n + 1):
        sub = r.iloc[i:i + n]; row = {"start": sub.index[0]}
        for k in ("never", "monthly", "annual", "band"):
            v = backtest(sub, k)[0].value
            row[k] = (v.iloc[-1] / 10_000) ** (1 / years) - 1; row[k + "_dd"] = (v / v.cummax() - 1).min()
        rows.append(row)
    return pd.DataFrame(rows).set_index("start")

def napkin_cost(turnover_yr, cost=0.002, value=100_000):
    """ASSUMPTION: each dollar traded costs `cost` (spread, fees or tax drag). Annual drag in $ on `value`."""
    return turnover_yr * cost * value

if __name__ == "__main__":
    r, rf, res, S = run()
    print(f"60/40 VFINX/VBMFX, $10,000 on {START}, month-end data to {END} ({len(r)} months)")
    print(f"{'Rule':<22}{'End value':>11}{'CAGR':>7}{'Vol':>7}{'MaxDD':>8}{'Sharpe':>7}{'Trades':>7}{'Turn/yr':>8}{'Max stock%':>11}")
    for k, s in S.items():
        print(f"{RULES[k]:<22}{s['end']:>11,.0f}{s['cagr']:>7.2%}{s['vol']:>7.2%}{s['max_dd']:>8.1%}{s['sharpe']:>7.2f}"
              f"{s['rebalances']:>7}{s['turnover_yr']:>8.1%}{s['max_eq']:>11.1%}")
    w, a = res["never"][0].equity_w, res["annual"][0].equity_w
    print(f"\nBuy & hold ends at {S['never']['end_eq']:.1%} stocks; it entered the Oct 2007 peak at {w.loc['2007-10-31']:.1%} stocks.")
    print(f"Buy & hold first passed 70% stocks in {w[w > .7].index[0]:%b %Y} and 80% in {w[w > .8].index[0]:%b %Y}.")
    print(f"Annual rebalancing still drifted between {a.min():.1%} ({a.idxmin():%b %Y}) and {a.max():.1%} stocks between Decembers.")
    print(f"All five rules hit their worst drawdown in {S['never']['dd_at']:%b %Y}.")
    R = rolling(r, rf)
    print(f"\n{len(R)} rolling 10-year windows (starts {R.index[0]:%b %Y} to {R.index[-1]:%b %Y}):")
    for k in ("monthly", "band"):
        g = R[k] - R["annual"]
        print(f"  {RULES[k]} minus annual CAGR: median {g.median()*100:+.2f} pts, range {g.min()*100:+.2f} to {g.max()*100:+.2f}")
    g = R["never"] - R["annual"]; dd = R["never_dd"] - R["annual_dd"]
    print(f"  Never minus annual CAGR: median {g.median()*100:+.2f} pts; never had the deeper drawdown in {(dd < 0).mean():.0%} of windows")
    print(f"\nNapkin (assumption: 0.2% cost per dollar traded, $100,000 portfolio):")
    for k in ("monthly", "quarterly", "annual", "band"):
        print(f"  {RULES[k]:<22} {napkin_cost(S[k]['turnover_yr']):>6,.0f} $/yr")
The result: how often matters less than whether
Output of python3 rebalance.py:
60/40 VFINX/VBMFX, $10,000 on 1986-12-31, month-end data to 2026-09-30 (477 months)
Rule                    End value   CAGR    Vol   MaxDD Sharpe Trades Turn/yr Max stock%
Never (buy & hold)        442,046 10.00% 11.75%  -38.7%   0.61      0    0.0%      93.9%
Monthly                   304,242  8.97%  9.54%  -32.5%   0.63    477    9.2%      60.0%
Quarterly                 313,794  9.06%  9.50%  -32.0%   0.64    159    6.1%      63.6%
Once a year (Dec)         312,520  9.05%  9.53%  -30.8%   0.64     39    3.3%      67.9%
When off by 5 points      325,566  9.16%  9.62%  -31.9%   0.65     26    3.6%      65.0%

Buy & hold ends at 93.9% stocks; it entered the Oct 2007 peak at 78.6% stocks.
Buy & hold first passed 70% stocks in Nov 1995 and 80% in Dec 1998.
Annual rebalancing still drifted between 47.9% (Nov 2008) and 67.9% stocks between Decembers.
All five rules hit their worst drawdown in Feb 2009.

358 rolling 10-year windows (starts Jan 1987 to Oct 2016):
  Monthly minus annual CAGR: median -0.11 pts, range -0.38 to +0.12
  When off by 5 points minus annual CAGR: median +0.03 pts, range -0.35 to +0.31
  Never minus annual CAGR: median -0.09 pts; never had the deeper drawdown in 73% of windows

Napkin (assumption: 0.2% cost per dollar traded, $100,000 portfolio):
  Monthly                    18 $/yr
  Quarterly                  12 $/yr
  Once a year (Dec)           7 $/yr
  When off by 5 points        7 $/yr
| Rule | $10,000 became | CAGR | Volatility | Max drawdown | Sharpe | Trades | Max stock share |
|---|---|---|---|---|---|---|---|
| Never (buy & hold) | $442,046 | 10.00% | 11.75% | −38.7% | 0.61 | 0 | 93.9% |
| Monthly | $304,242 | 8.97% | 9.54% | −32.5% | 0.63 | 477 | 60.0% |
| Quarterly | $313,794 | 9.06% | 9.50% | −32.0% | 0.64 | 159 | 63.6% |
| Once a year (Dec) | $312,520 | 9.05% | 9.53% | −30.8% | 0.64 | 39 | 67.9% |
| When off by 5 points | $325,566 | 9.16% | 9.62% | −31.9% | 0.65 | 26 | 65.0% |
The three calendar rules are almost identical: 8.97% to 9.06% a year, about 9.5% volatility, and Sharpe ratios of 0.63 to 0.64. Rebalancing 12 times more often bought you nothing. Monthly came out a hair behind because it held exactly 60% stocks all the time. The yearly portfolio averaged 60.6% stocks because it drifted a little between Decembers, and in a market where stocks win, that small extra share earns a bit more.

The 5-point band came out slightly ahead, with the highest end value ($325,566), the best Sharpe (0.65) and the fewest trades (26). That edge is small and depends on the period. The steadier way to say it: a band rule gets you yearly-level risk control with even fewer trades.
This matches Vanguard’s much longer study (1926 to 2009). Its monthly-rebalanced 60/40 needed 1,008 rebalancing events and its annual one 83, with average returns of 8.5% and 8.6%. Vanguard’s conclusion was that annual or semiannual monitoring, with rebalancing at 5% thresholds, is a reasonable balance for most broadly diversified stock and bond portfolios.
The real choice: rebalance or let it drift
The never-rebalanced portfolio ended with $442,046, about $116,500 more than the best rebalanced one. So why rebalance at all?
Because by the end it wasn’t a 60/40 portfolio anymore. Stocks grow faster than bonds, so with no rebalancing the stock share keeps climbing:
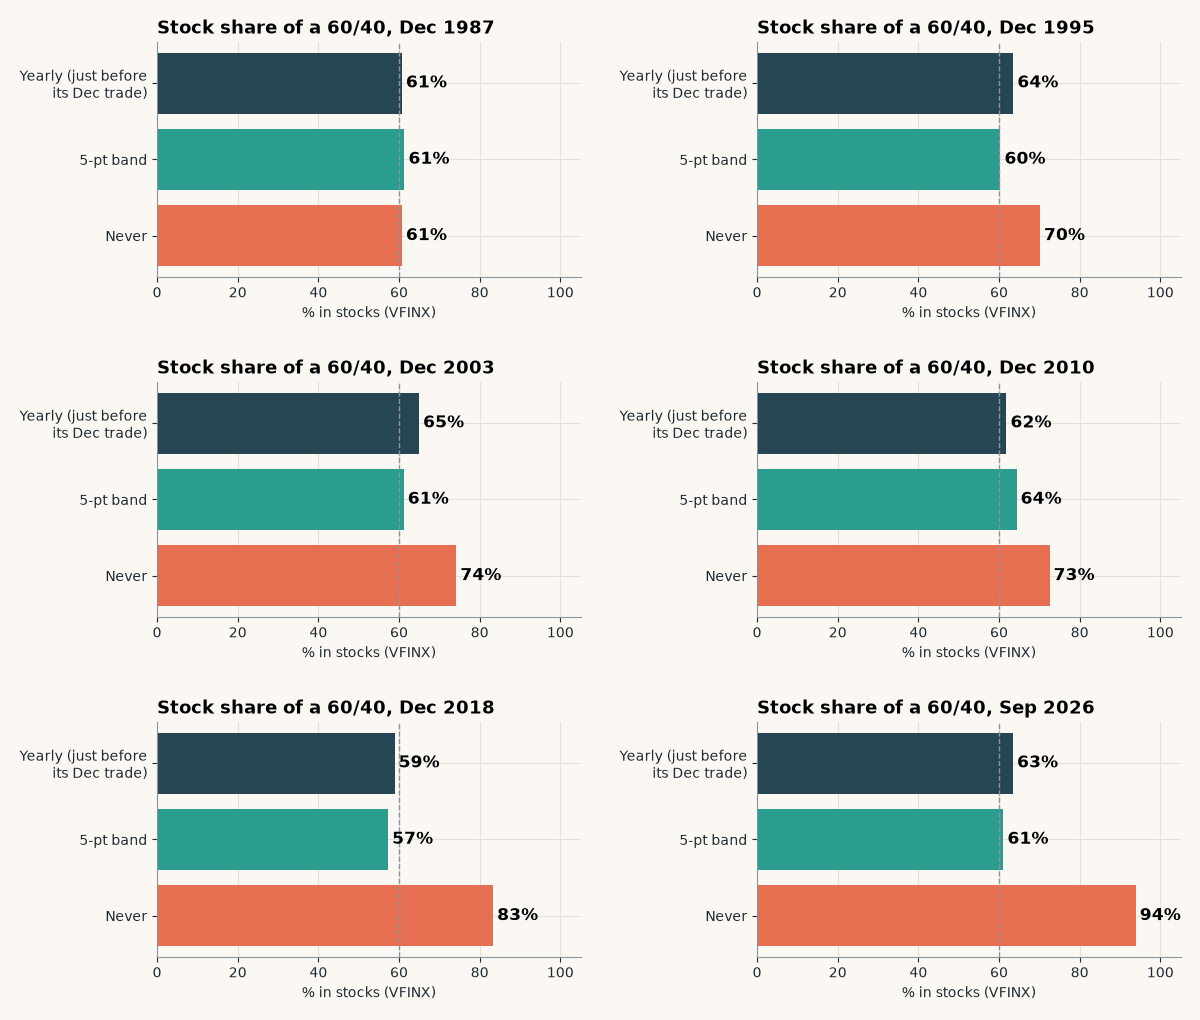
It passed 70% stocks in November 1995 and 80% in December 1998. It went into the October 2007 market peak at 78.6% stocks, so the 2008 crash hit far harder than a 60/40 should. The worst drawdown was −38.7%, against −30.8% for the yearly rebalancer. Volatility was 11.75% vs 9.53%. On a risk-adjusted basis buy and hold came last (Sharpe 0.61).
Vanguard found the same pattern over 1926 to 2009. Its never-rebalanced 60/40 drifted to a maximum of about 99% stocks and earned a higher average return (9.1% vs 8.5% for monthly), with more risk (14.4% vs 12.1% standard deviation). The extra return is mostly payment for holding more stock than you signed up for.
Rule: rebalancing isn’t about squeezing out return; it keeps the portfolio’s risk at the level you chose. If you never rebalance, your 60/40 quietly turns into a stock portfolio, right before a crash shows you the difference.
Rolling 10-year windows: no lucky period
One 40-year run could just be luck, so the script also tests every rolling 10-year window: 358 of them, starting each month from January 1987 to October 2016.
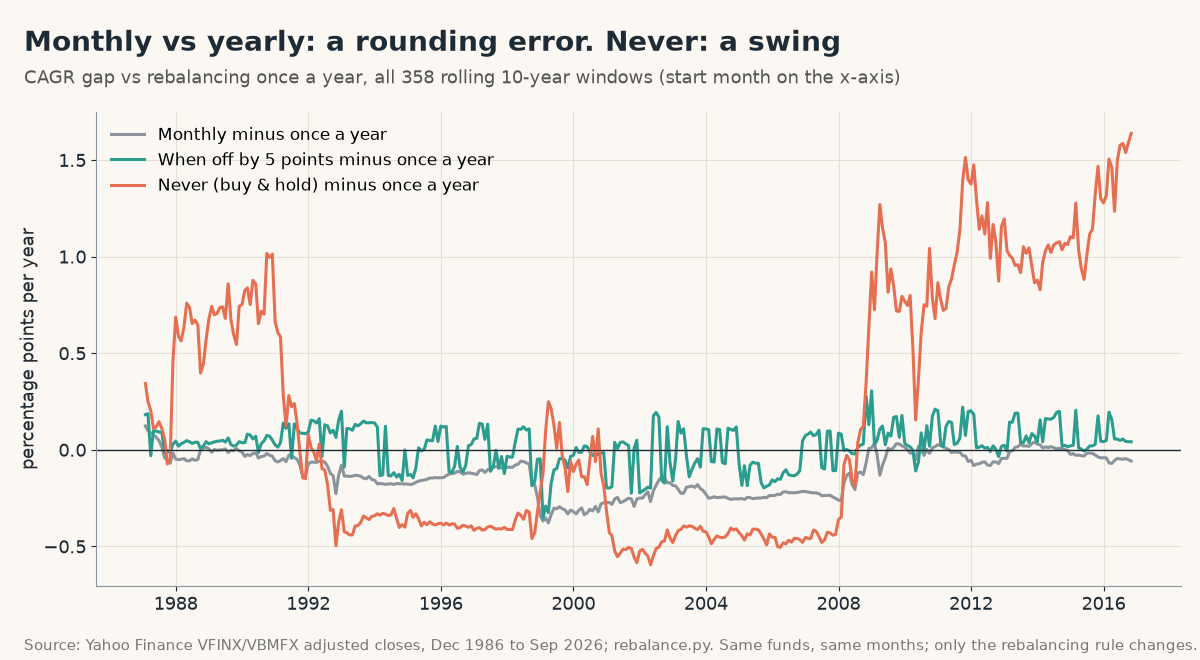
- Monthly minus yearly: median −0.11 percentage points a year, never more than +0.12 better. Monthly almost never wins, and when it does, it wins by a rounding error.
- 5-point band minus yearly: median +0.03 points, range −0.35 to +0.31. That’s a coin flip.
- Never minus yearly: median −0.09 points, with swings from about −0.6 to +1.6. Buy and hold also had the deeper drawdown in 73% of the windows.
So over a typical decade, never rebalancing didn’t even reliably earn more. It took more risk for an uncertain reward. The 40-year advantage comes from the drift compounding over a very long bull run in stocks.
What about trading costs?
At these frequencies, the cost of trades is small. Annual rebalancing traded about 3.3% of the portfolio per year, and monthly about 9.2%. The napkin math below rests on a labeled assumption that each traded dollar costs 0.2% (spread, commissions or tax drag). Then a $100,000 portfolio pays about $18 a year for monthly rebalancing and $7 for yearly.
Taxes are the cost that actually matters. In a taxable account, every rebalance sells winners and can trigger capital gains, which is why Vanguard says annual rebalancing is likely preferred when taxes or substantial costs are involved. Three practical fixes:
- Rebalance with cash flows. Put new contributions, dividends and interest into whichever side is underweight. Vanguard specifically recommends this to cut costs.
- Rebalance inside tax-advantaged accounts (401(k), IRA or your country’s equivalent) where selling doesn’t create a tax bill.
- Use the 5-point band so you only trade when the drift is big enough to matter.
A simple rebalancing routine
- Pick a date you’ll remember, for example your birthday or the first weekend of January.
- Check your current weights. If you track holdings by hand, PortfolioTracker24 is a free browser tracker that keeps your data on your machine (no account, no broker connection), shows allocation by value, and exports Excel backups.
- If stocks are more than 5 points off target, rebalance, starting with new cash and then tax-advantaged accounts.
- If they’re inside the band, do nothing. That’s the rule working, not you being lazy.
To check whether your mix is really beating the index, see how to compare your portfolio to the S&P 500 (with Python). If you’re about to put a lump sum to work before your first rebalance, the backtest in lump sum vs DCA on the S&P 500 is the companion read.
Turn your backtest into something you can share
Once you’ve run this on your own funds, you have original analysis: real numbers, charts and a clear rule. That’s good material for a short guide, a newsletter lead magnet, or a small ebook. ImagineYourBook is an AI book-writing tool that turns a prompt or your notes into a complete ~10,000-word draft with its own cover, with Word and EPUB export on paid plans. Paste in your results table and rules, then edit the draft so every number matches your script. If you plan to sell it on Kindle, run the price through Finxter’s KDP royalty calculator in Python first.
| Question | What 40 years of data says | Do this |
|---|---|---|
| Monthly or quarterly? | Same Sharpe as yearly (0.63-0.64), 4-12x the trades | Skip it |
| Once a year? | 39 trades, Sharpe 0.64, smallest drawdown (−30.8%) | Default choice: one fixed date |
| Threshold band? | 26 trades, Sharpe 0.65, but needs monitoring | Check monthly or yearly, trade only past ±5 points |
| Never? | Higher return, but 93.9% stocks and −38.7% drawdown | Only if you really want a stock-heavy portfolio |
| Taxable account? | Selling winners can trigger capital gains | Rebalance with new cash and inside tax-advantaged accounts |
Limitations
- One stock fund, one bond fund, US only. International stocks, small caps or other bond types will drift at different speeds.
- Month-end data. A band rule checked daily would trade at slightly different points. Vanguard notes that threshold-only rules need daily monitoring.
- No taxes or trading costs in the backtest itself; the cost section above is assumption-based napkin math.
- The past isn’t a forecast. Stocks returned much more than bonds over 1987 to 2026. In a period where bonds keep up, the drift (and the gap from never rebalancing) would be smaller. Not investment advice.
The takeaway
How often to rebalance a portfolio: once a year, or whenever an asset class drifts more than 5 points off target. Monthly and quarterly rebalancing only added trades in 40 years of real fund data. Never rebalancing turned a 60/40 into a 94/6 portfolio and gave it the deepest crash. Set one date a year and use new cash first. And if your backtest turns into a guide worth sharing, ImagineYourBook can turn your notes into a first draft: the $0 trial includes one 10,000-word book, requires a card, and becomes $29.99 a month unless you cancel before day 8.
Sources (checked October 27, 2026): Yahoo Finance: VFINX historical data (via yfinance) · Yahoo Finance: VBMFX historical data (via yfinance) · Yahoo Help: adjusted close · FRED: 3-Month Treasury Bill rate (TB3MS) · Vanguard: Best practices for portfolio rebalancing (PDF) · AAII Journal: Best practices for portfolio rebalancing (Vanguard summary) · yfinance on GitHub · PortfolioTracker24 (features checked on its site) · ImagineYourBook pricing and trial terms. Script: rebalance.py (shown above). Napkin math is labeled as assumptions. Not investment advice.
Be on the Right Side of Change