https://www.noupe.com/wp-content/uploads/2022/01/mark-konig-Tl8mDaue_II-unsplash-1-1024×576.jpg

Being an entrepreneur means you must keep a lot of things under control. You have to always know what is going on in sales, marketing, finance, inventory, and other aspects of your business.
Moreover, you probably use a myriad of tools to run them. Switching between a CRM, marketing automation software, Google Analytics, Accounting System and your eCommerce back-end won’t provide a clear picture of how your business is doing.
Wouldn’t it be great to have one screen showing the most important information about your business? eCommerce dashboards are here to give you this opportunity.
What is a dashboard and why do you need it?
eCommerce dashboard is a visual representation of up-to-date data (metrics and KPIs) important for the business. It helps to analyze the main indicators to improve the results. Dashboards are different from other analytics tools because they give insights on the most vital data. Thanks to dashboards you can check the vitals of your business any time you want and not just during your monthly reports.
This becomes possible because they accumulate real-time (or near real-time) data. With the help of a well-tuned dashboard, you can quickly spot and fix problems and see if your company is effective or not. It takes less time and effort to check a dashboard than to dig into monthly reports and collect info manually.
Dashboards provide statistics on different areas of your online store, including, but not limited to monthly sales, website traffic, and marketing campaigns. You can compare data by any period of time: days, months, or even years.
Let’s look at the most popular examples of dashboards for eCommerce.
5 eCommerce dashboards examples
We’ve prepared five examples of dashboards that will help you run your store. Keep in mind that there are no universal solutions that can fit everyone. The best solution for you depends on the complexity and scale of your business: are you going to create a marketplace or a small online store? How many product categories and markets are you going to cover? All of this will impact the types and number of KPIs you will have to track.
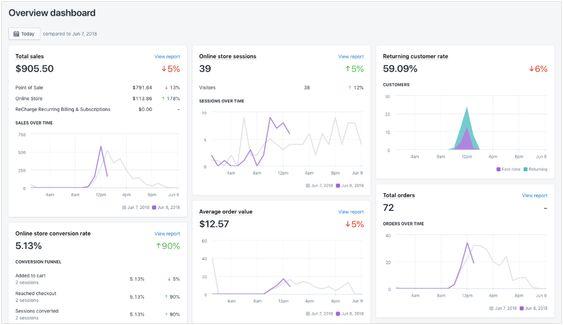
Store overview
The overview dashboard shows the performance of the store across all major areas of the business like sales, marketing, inventory, and others. This type of dashboards enables you to see the most important metrics of your business on one screen.
Goal: to get a snapshot of your store performance.
KPI examples:
- Total sales
- Sales by product, marketing channel, geography, etc.
- Traffic
- Average order value
- Conversion rate
- Repeat customer rate
- Customer Lifetime Value
Dashboard Example:
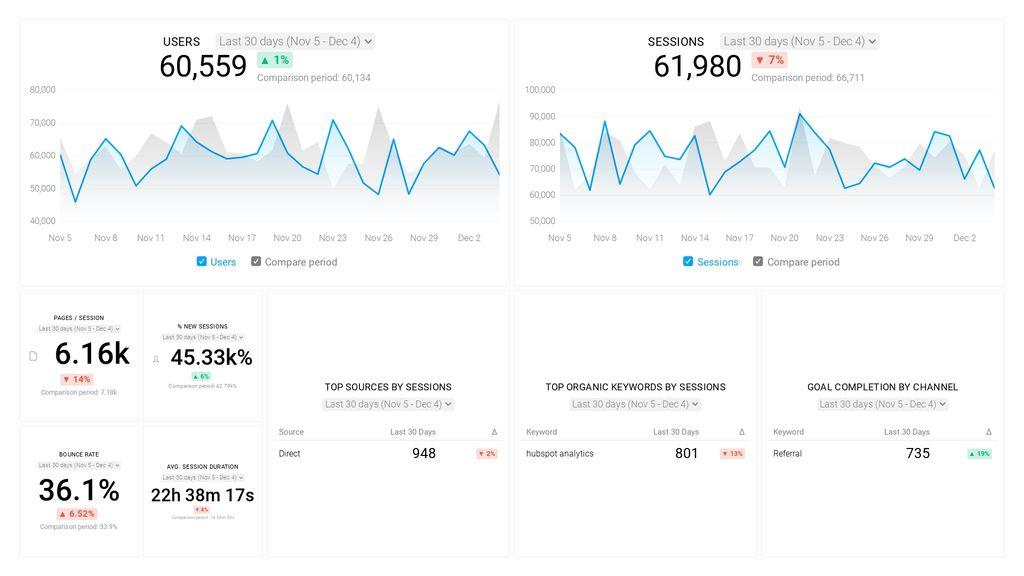
Google Analytics for eCommerce
Google Analytics is the number one tool for analyzing website traffic. It also provides a lot of information which makes it difficult to digest. That is why you need a Google Analytics eCommerce dashboard that will show only the most meaningful data for your online store.
Goal: to check your website’s most current statistics.
KPI examples:
- Unique visitors
- Average session duration
- Bounce rate
- Time on site
- Goal completions
- Traffic sources
- Top pages
- Top keywords
Dashboard Example:
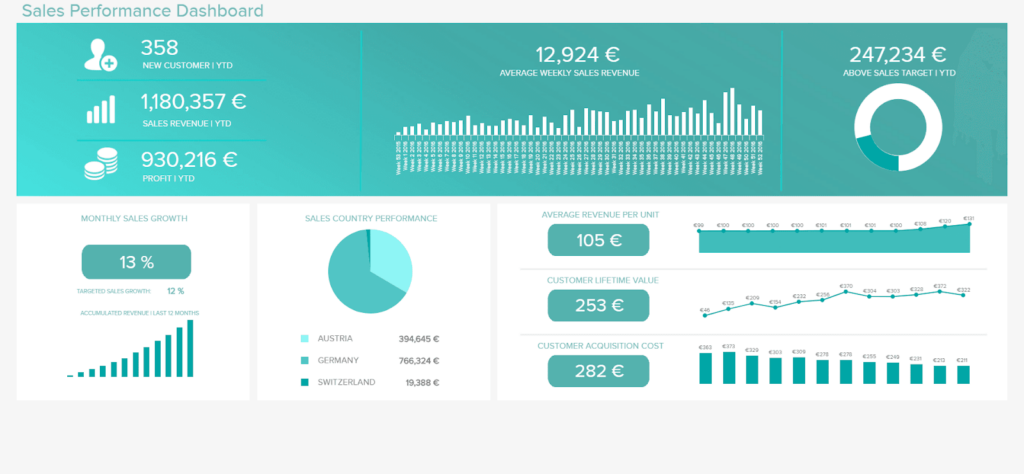
Sales
eCommerce sales dashboard shows KPIs like total sales, as well as sales by product, marketing channel, location etc. This is a functional strategic tool that allows getting an instant overview of your sales to pinpoint any problem as soon as it occurs. It organizes the most precise and recent data related to commercial success.
Goal: to see current sales performance and compare it to your sales target.
KPI examples:
- Total sales
- Sales target
- Average order value
- Lead conversion rate
- Up-sell and cross-sell rates
- Profit margin per product
Dashboard Example:
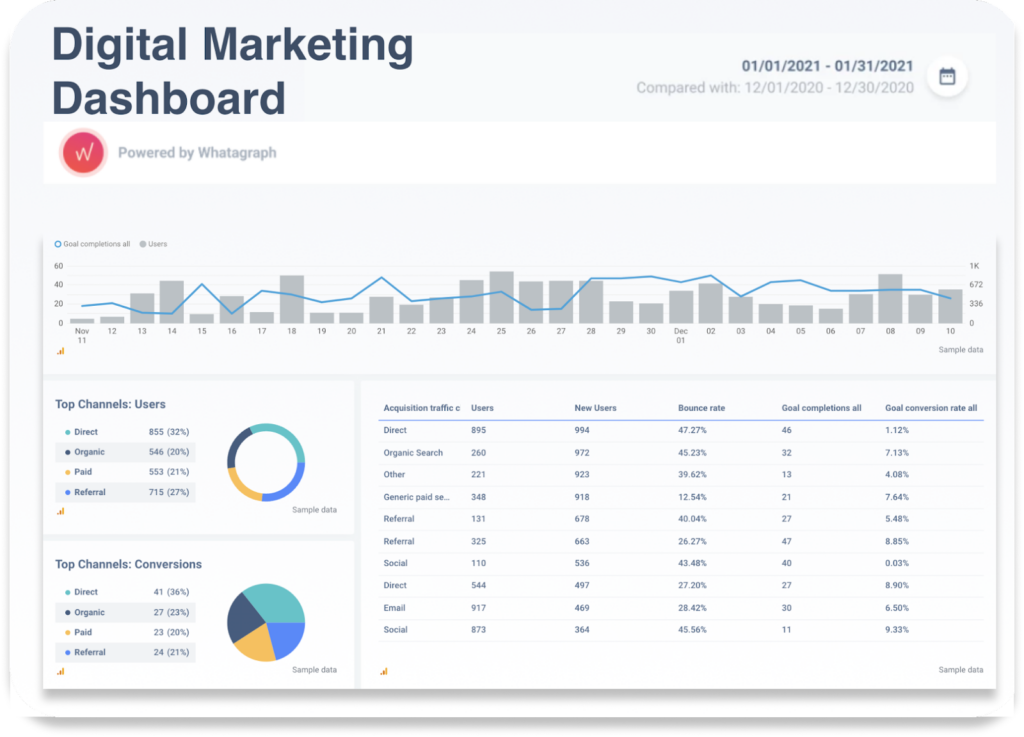
Marketing
eCommerce marketing dashboards present vital KPIs in digital marketing to track channel and campaign results in real-time. These KPIs include traffic sources, macro and micro conversions, leads, ROI of marketing channels and campaigns, etc. The information is collected from such channels: Google Analytics, email marketing tools, CRM, social media, and others.
Goal: to see how effective your marketing is in real-time.
KPI examples:
- Traffic
- Leads
- Sales
- Conversion rate
- Conversions by channel
- Customer acquisition cost (total and by channel)
Dashboard Example:
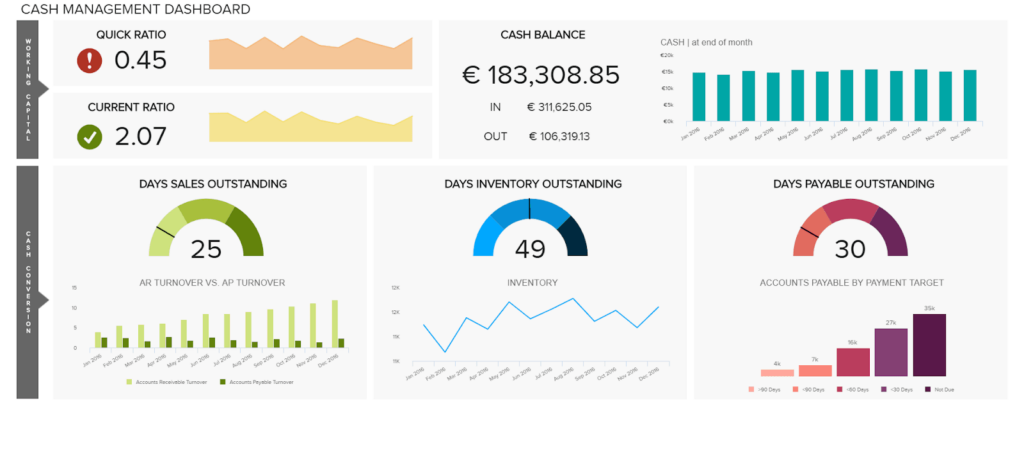
Finance
This dashboard focuses on your budget and analyzes existing assets, profit and expenses, cash flow, income, and other financial indicators. It allows you to see the current figures and financial details to get helpful insights and increase the cost-efficiency of your business.
Goal: to see the current financial state and overall profitability of the business.
KPI examples:
- Revenue
- Net profit
- Gross / Net profit margin
- Cash balance
- Working capital
- Cost of goods sold
Dashboard Example:
Wrapping up
To sum up, eCommerce metrics dashboards are useful tools that help track your business performance on a daily basis. They can either provide an overview of the entire business or may cover different areas from SEO to finances.
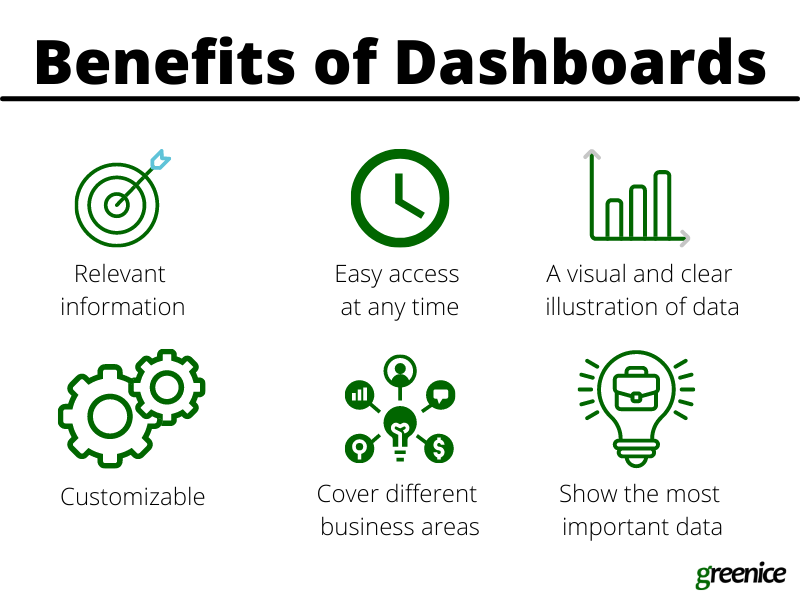
The fundamental advantage is that you can check your KPIs any time, not just once a month when you prepare your reports. This will help to detect and fix problems almost on the spot. Another advantage is that dashboards are visual tools that allow you to digest information easily. Additionally, they are customizable and can show the indicators which you need the most.
In this article, we shed some light on what dashboards are and why they matter. We also gave examples of dashboards that might be helpful for your eCommerce business. Give these tools a try and get a clearer picture of how your store is doing.
The post 5 best examples of eCommerce dashboards to help you take control of your business appeared first on noupe.
noupe