https://media.notthebee.com/articles/6a08f3a813b946a08f3a813b95.jpg
Some good news for Americans planning a summer road trip:
Not the Bee
Just another WordPress site
https://media.notthebee.com/articles/6a08f3a813b946a08f3a813b95.jpg
Some good news for Americans planning a summer road trip:
Not the Bee
https://d2908q01vomqb2.cloudfront.net/887309d048beef83ad3eabf2a79a64a389ab1c9f/2026/05/14/DB5315.png
Upgrading a production MySQL database across major versions is one of the most high-stakes operations a database team faces. Compatibility breaks, unexpected downtime, and the risk of no easy rollback can stall upgrade plans for months. Amazon Relational Database Service (Amazon RDS) for MySQL 8.0 standard support ends on July 31, 2026, and Amazon RDS for MySQL now supports long-term support (LTS) version 8.4. Teams running MySQL 8.0 workloads need a reliable, low-risk path to MySQL 8.4. However, upgrading from 8.0 to 8.4 involves significant compatibility changes that you must evaluate and test before proceeding. In this post, you learn how to build a complete upgrade workflow for RDS for MySQL 8.0 to 8.4, covering pre-upgrade compatibility checks, Amazon RDS Blue/Green Deployments for minimal downtime, and a rollback strategy for added protection.
If you need to stay on MySQL 8.0 beyond that date, check the latest updates on RDS Extended Support. For a detailed breakdown of Extended Support costs, see Upgrade strategies for Amazon RDS for MySQL 8.0 to 8.4. You can also consider Amazon Aurora MySQL-Compatible Edition, which provides its own release calendar and still supports MySQL 8.0 without having to use extended support at least until 30 April 2028.
This post is part of a two-part series on upgrading RDS for MySQL 8.0 to 8.4. Here, we focus on the step-by-step implementation, covering pre-upgrade compatibility checks, Blue/Green Deployments, and rollback preparation. For an overview of upgrade strategies, Extended Support costs, and key considerations, see Upgrade strategies for Amazon RDS for MySQL 8.0 to 8.4.
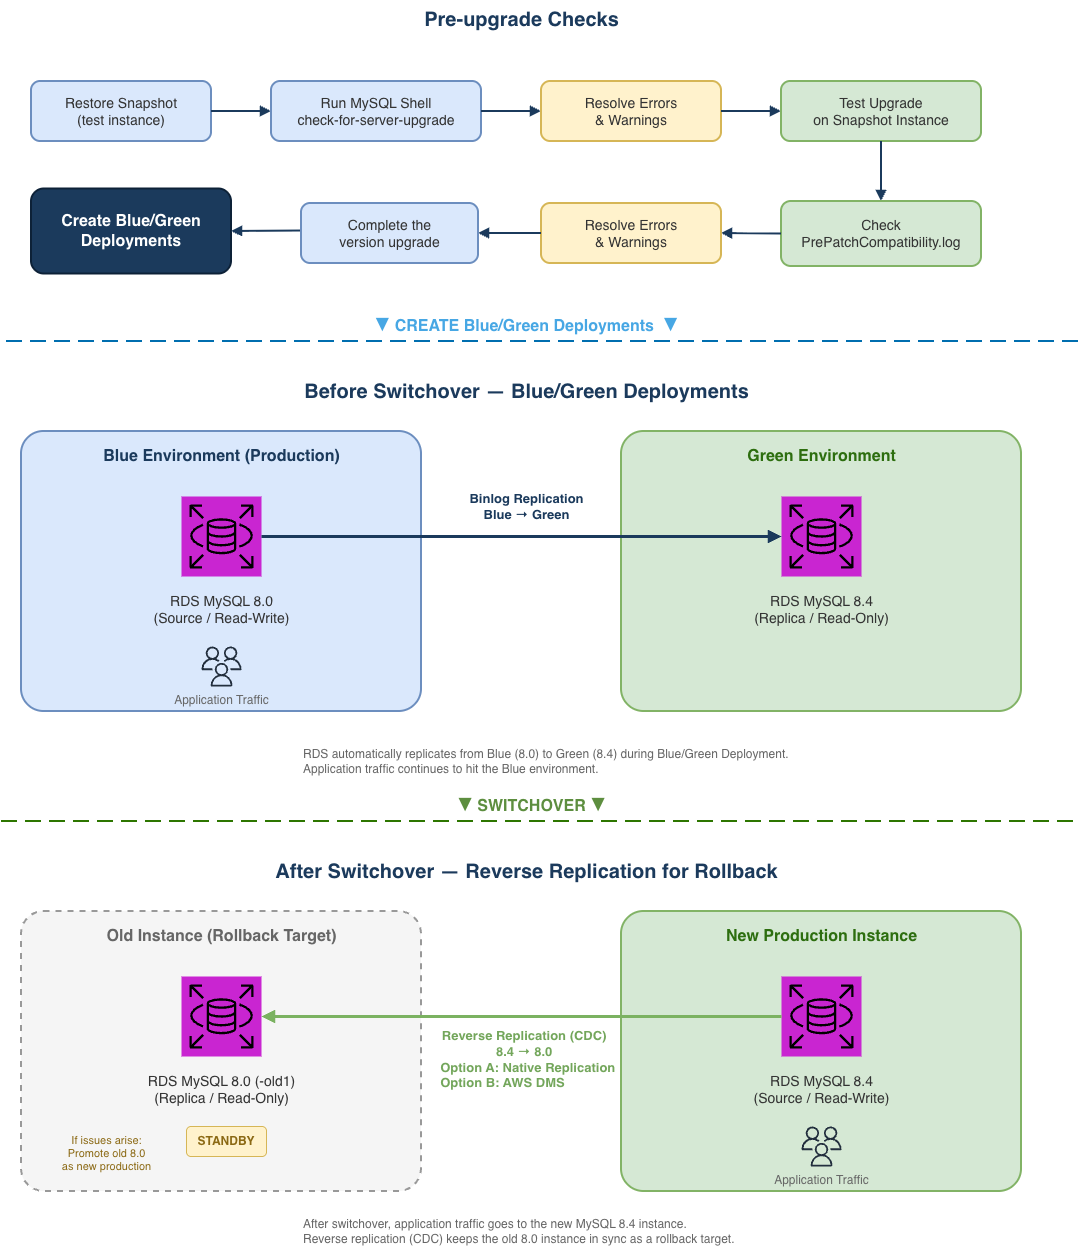
In this post, we walk you through a complete upgrade workflow covering three tightly coupled phases:
These phases are not independent: pre-check results determine whether the green environment can upgrade successfully, the binlog position from Blue/Green Deployments creation feeds into the rollback setup, and you need to make sure the rollback solution is ready before you switchover. The following architecture diagram illustrates the complete workflow, helping you understand how each phase interacts with the others.
Blue/Green Deployments and RDS for MySQL 8.4 are available in all AWS Regions. Before you begin, make sure you have the following resources in place:
Before upgrading, use the MySQL Shell check-for-server-upgrade utility to identify incompatibilities. Because the utility performs intensive metadata scans across all databases, we recommend running it against a snapshot-restored instance rather than your production database to avoid impacting workload performance. If you are working in a dev/test environment, you can skip the snapshot restore and run the check directly.
To run the pre-upgrade check:
The utility categorizes findings into three severity levels:
Whether an RDS for MySQL instance can successfully upgrade from 8.0 to 8.4 is ultimately determined by the RDS pre-upgrade validation. Therefore, this section focuses on the intersection of MySQL Shell’s check-for-server-upgrade findings and the RDS built-in pre-upgrade checks, providing a practical reference for planning your upgrade (detailed in the following section).
The MySQL Shell upgrade checker and the RDS built-in pre-upgrade validation have slightly different default check items. The following table provides the main differences between the two. For detailed explanations and resolution steps for each check item, please see the “Understanding and resolving pre-upgrade check errors” section.
Items with a Source of Shell Only are not enforced by the RDS upgrade validation, so their Severity is marked as -.
| Check item | Source | Severity | Notes |
| Removed system variables | Shell Only | – | Can be ignored. RDS upgrade validation does not enforce this item |
| System variables with new default values | Both | Warning | This check lists parameters whose default values have changed in MySQL 8.4. If you have customized any of these in your MySQL 8.0 parameter group. |
| Issues reported by ‘check table x for upgrade’ command | Both | Varies | Severity depends on the storage engine; handle based on actual precheck output. Typically, if the result shows “Corrupt”, the upgrade checker treats it as an Error item. |
| Checks for foreign keys not referencing a full unique index | Both | Warning | MySQL 8.4 may forbid foreign keys to partial indexes, this check identifies such cases to warn the user. |
| Check for deprecated or invalid user authentication methods. | Both | Warning | MySQL 8.4 may deprecate or remove some authentication methods, this check identifies users still using them. |
| Check for deprecated or removed plugin usage. | Both | Error | RDS does not support these plugins (authentication_fido, keyring_file, keyring_encrypted_file, keyring_oci), so this check is unlikely to be triggered on RDS. If flagged, please verify and remove the plugin. |
| Check for deprecated or invalid default authentication methods in system | Shell Only | – | Can be ignored, RDS upgrade checks ignore this item |
| Check for deprecated or invalid authentication methods in use by MySQL | Shell Only | – | Can be ignored, RDS upgrade checks ignore this item |
| Checks for errors in column definitions | Both | Error | Identifies column definitions that MySQL 8.4 may no longer support. |
| Check for allowed values in System Variables. | Both | Error | Checks whether system variables use values that MySQL 8.4 no longer allows. |
| Checks for user privileges that will be removed | Both | Notice | Informational only. Verifies users with grants that the upgrade process will remove. |
| Checks for partitions by key using columns with prefix key indexes | Both | Error | MySQL 8.4 no longer supports indexes on column prefixes for key partitioning. The partition function ignores these indexes, so MySQL 8.4 no longer allows them. |
| Use of AUTO_INCREMENT for DOUBLE and FLOAT data types | RDS Only | Error | MySQL 8.4 deprecates AUTO_INCREMENT for DOUBLE and FLOAT data types. |
| RDS checked for the use of non-inclusive language in SQL statements. | RDS Only | Error | MySQL 8.4 no longer allows non-inclusive language in SQL statements. |
| memcached plugin needs to be uninstalled before upgrade | RDS Only | Error | MySQL 8.3 no longer supports the InnoDB memcached plugin |
| DB instance must have enough free disk space | RDS Only | Error | Make sure the instance has at least 2 GiB of free storage space. |
| Detect system objects created as tables in sys schema | RDS Only | Error | Remove any user-created tables in the sys schema before upgrading. |
The RDS built-in pre-upgrade validation only runs when you initiate an actual upgrade. If the validation finds blocking issues at that point, the upgrade fails and you need to resolve them and reschedule another maintenance window. Running the MySQL Shell upgrade checker beforehand helps you identify and resolve these issues in advance.
The recommended approach:
PrePatchCompatibility.log.To show you the pre-upgrade check process and the Error items that block upgrades, we reproduced several Error items on our test environment. In the following sections, we walk you through the actual precheck output and the suggested resolution for each item, so you can interpret and resolve precheck errors in practice.
Runs CHECK TABLE … FOR UPGRADE against each tables. Depending on the scope of impact, the severity varies. The following are examples of both Error and Warning types.
|
Check item |
Issues reported by ‘check table x for upgrade’ command
|
|
Description |
The View references a table, column, or function that no longer exists, or the definer/invoker lacks the required privileges. The “Corrupt” status indicates this is an Error-level finding that blocks the upgrade. |
|
Remediation |
Identify the invalid references and remove or fix them:
|
|
Check item |
Issues reported by ‘check table x for upgrade’ command
|
|
Description |
The table uses COMPACT or REDUNDANT row format, where each BLOB/TEXT column stores a 768-byte prefix inline. With many such columns, the total row size exceeds InnoDB’s 8126-byte page limit. |
|
Remediation |
Changing some columns to TEXT or BLOB or using ROW_FORMAT=DYNAMIC or ROW_FORMAT=COMPRESSED may help. This is a Warning item and does not block the upgrade, but INSERT or UPDATE operations that exceed the row size limit may fail after the upgrade. |
|
Check item |
Check for deprecated or removed plugin usage.
|
|
Description |
RDS for MySQL does not support installing the plugins that the precheck scans for (authentication_fido, keyring_file, keyring_encrypted_file, keyring_oci), so this item cannot be reproduced. If detected, remove the reported plugin(s) and retry the upgrade. |
|
Remediation |
Uninstall the plugin(s) if found. |
|
Check item |
Checks for errors in column definitions. Identifies column definitions that may not be supported in future versions of MySQL.
|
|
Description |
Using DOUBLE or FLOAT with AUTO_INCREMENT is no longer allowed in MySQL 8.4. This check and “Use of AUTO_INCREMENT for DOUBLE and FLOAT data types” point to the same affected tables. |
|
Remediation |
Change the column type to an integer type (for example: BIGINT). |
|
Check item |
Check for allowed values in system variables. The following system variables are using values that are not allowed.
|
|
Description |
Checks whether system variables use values that are no longer allowed in MySQL 8.4. |
|
Remediation |
Find non-default system variables and change the value(s). |
|
Check item |
Checks for partitions by key using columns with prefix key indexes. Indexes on column prefixes are not supported for key partitioning, they are ignored by the partition function and so they are not allowed as of 8.4.0. This check identifies tables with partitions defined this way, they should be fixed before upgrading to 8.4.0. More information: Partitioning limitations
|
|
Description |
Tables partitioned by key using columns with prefix key indexes are no longer compatible in MySQL 8.4. |
|
Remediation |
If the partition key column uses a prefix index (for example: KEY(col(10))), remove the prefix and use the full column, or redesign the partition strategy (for example: switch to RANGE or HASH). |
|
Check item |
Use of AUTO_INCREMENT for DOUBLE and FLOAT data types. Starting with MySQL version 8.4.0, the use of AUTO_INCREMENT is deprecated for DOUBLE and FLOAT data types.
|
|
Description |
This is the RDS-specific check for the same issue as “Checks for errors in column definitions”. Both checks point to the same affected tables. |
|
Remediation |
Same as “Checks for errors in column definitions” — change the column type to an integer type. |
|
Check item |
RDS checked for the use of non-inclusive language in SQL statements. Starting with MySQL version 8.4.0, the use of non-inclusive language in SQL statements isn’t allowed.
|
|
Description |
Starting with MySQL 8.4.0, non-inclusive language (for example: MASTER, SLAVE) in SQL statements is no longer allowed. |
|
Remediation |
Replace non-inclusive keywords:
|
|
Check item |
memcached plugin needs to be uninstalled before upgrade. Starting with MySQL version 8.3.0, the InnoDB memcached plugin is no longer supported.
|
|
Description |
The InnoDB memcached plugin is no longer supported starting with MySQL 8.3.0. Remove it before upgrading. |
|
Remediation |
Remove the MEMCACHED option from the Option Group associated with the DB instance. |
|
Check item |
DB instance must have enough free disk space. The DB instance must have at least 2 GiB free space for an upgrade to MySQL 8.0.30 and above.
|
|
Description |
The DB instance must have at least 2 GiB of free disk space for upgrades to MySQL 8.0.30 and above. |
|
Remediation |
Scale up the storage so that the instance has more than 2 GiB of free storage space (FreeStorageSpace). |
|
Check item |
Detect system objects created as tables in sys schema.
|
|
Description |
Detects whether system objects in the sys schema have been created as regular tables. These objects can conflict during the upgrade process. |
|
Remediation |
If results are returned: |
The following changes most commonly affect RDS for MySQL upgrades:
mysql_native_password deprecation: MySQL 8.4 defaults to caching_sha2_password. Existing users with mysql_native_password continue to work after the upgrade, but newly created users will use caching_sha2_password. To change the default authentication plugin, modify the authentication_policy parameter in your DB parameter group. If you do not plan to keep using mysql_native_password, consider switching affected users to caching_sha2_password on your MySQL 8.0 instance and validating application connectivity before proceeding with the upgrade.
Applications using older client drivers that do not support caching_sha2_password will fail to connect with the error: Authentication plugin ‘caching_sha2_password’ cannot be loaded. The following minimum driver versions are required:
Query affected users:
restrict_fk_on_non_standard_key: New parameter in MySQL 8.4 (default ON) that blocks CREATE TABLE and ALTER TABLE statements from creating foreign keys on non-unique or partial keys. This does not affect existing foreign keys or the upgrade itself. It only applies to data definition language (DDL) operations after the upgrade. If your application creates or modifies foreign keys at runtime, set this parameter to OFF in your MySQL 8.4 parameter group, or adjust your DDL statements accordingly.
memcached plugin removal: If enabled in your option group, disable it before upgrading (the RDS pre-upgrade validation can also flag this as an Error).
Beyond the compatibility changes above, MySQL 8.4 also changes the default values for several system variables. If you have explicitly set some of these in your MySQL 8.0 parameter group, verify whether your values need to carry over to the MySQL 8.4 parameter group. If you are using the engine defaults, be aware of the new behavior. The following table only includes parameters that are modifiable in the RDS for MySQL 8.4 parameter group.
| Parameter | 8.0 default | 8.4 default |
| group_replication_consistency | EVENTUAL | BEFORE_ON_PRIMARY_FAILOVER |
| group_replication_exit_state_action | READ_ONLY | OFFLINE_MODE |
| innodb_adaptive_hash_index | ON | OFF |
| innodb_buffer_pool_instances | 8 (or 1 if innodb_buffer_pool_size < 1 GB) | MAX(1, #vcpu/4) |
| innodb_change_buffering | all | none |
| innodb_io_capacity | 200 | 10000 |
| innodb_io_capacity_max | 200 | 2 × innodb_io_capacity |
| innodb_numa_interleave | OFF | ON |
| innodb_page_cleaners | 4 | innodb_buffer_pool_instances |
| innodb_parallel_read_threads | 4 | MAX(#vcpu/8, 4) |
| innodb_read_io_threads | 4 | MAX(#vcpu/2, 4) |
You can check which parameters have been explicitly modified in your current parameter group:
For the complete list of changes, see Amazon RDS for MySQL LTS version 8.4 is now generally available.
Before proceeding to Phase 2, confirm:
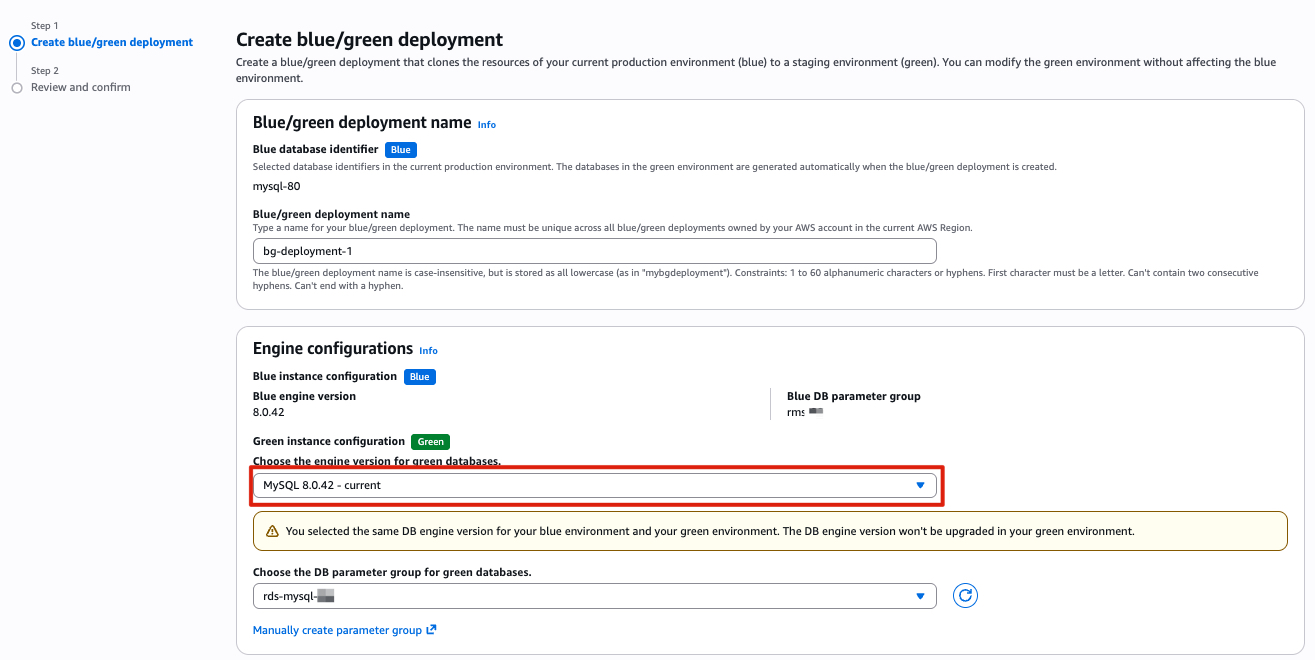
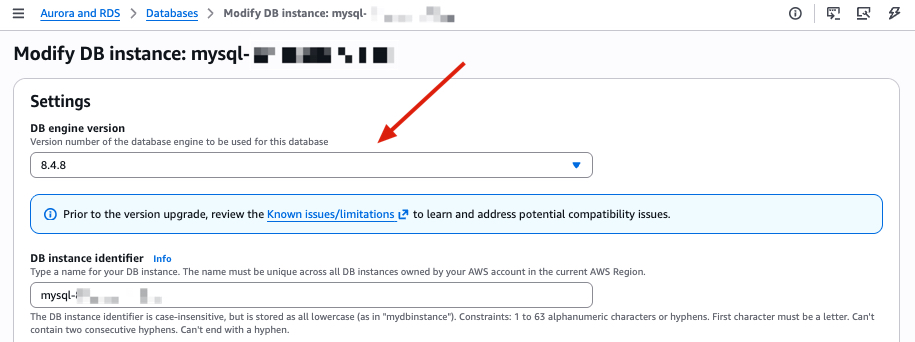
Amazon RDS Blue/Green Deployments lets you upgrade the major engine version, without affecting production. When you’re ready, you promote the staging environment to become the new production database with downtime typically five seconds or lower for single-Region configurations. This makes Blue/Green Deployments a practical choice for major version upgrades with minimal disruption. The following sections walk you through creating Blue/Green Deployments, upgrading the green environment to MySQL 8.4, and performing the switchover.
Before creating the deployment, confirm:
PrePatchCompatibility.log and Recent events for details. Resolve the issues and retry.Before switching over:
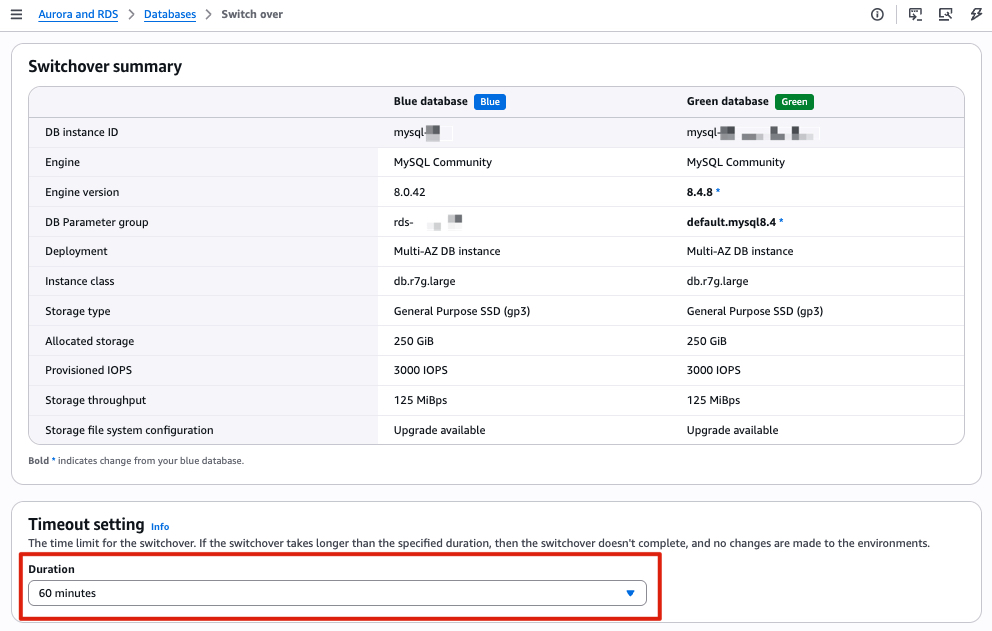
ReplicaLag on the green instance is near zero.SHOW PROCESSLIST).Set the switchover timeout to your acceptable downtime window (maximum 60 minutes). During switchover, existing connections are dropped.
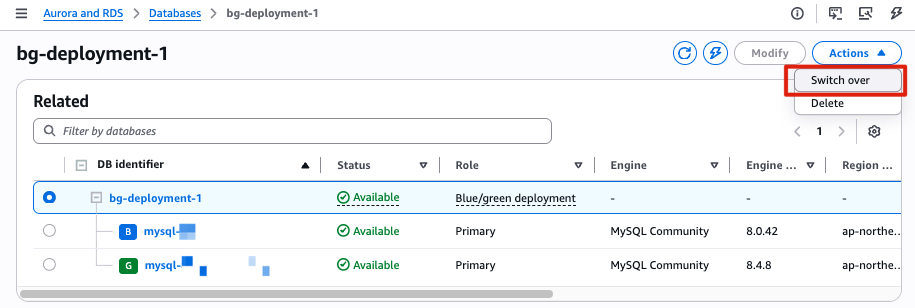
After a successful switchover, RDS renames the old instance with a -old1 suffix and sets it to read-only. The new MySQL 8.4 instance takes the original name and endpoint. RDS automatically disconnects replication at this point. Blue/Green Deployments is a one-time operation. You can delete the Blue/Green Deployments at your convenience; doing so does not delete the old instance. If you do not need a rollback path, the upgrade is complete at this point.
Important: Note the binlog position recorded after switchover completed, you will need it for the rollback setup in Phase 3. Following these steps to find the binlog position after switchover:
mysql-bin-changelog.000129 and position 1116.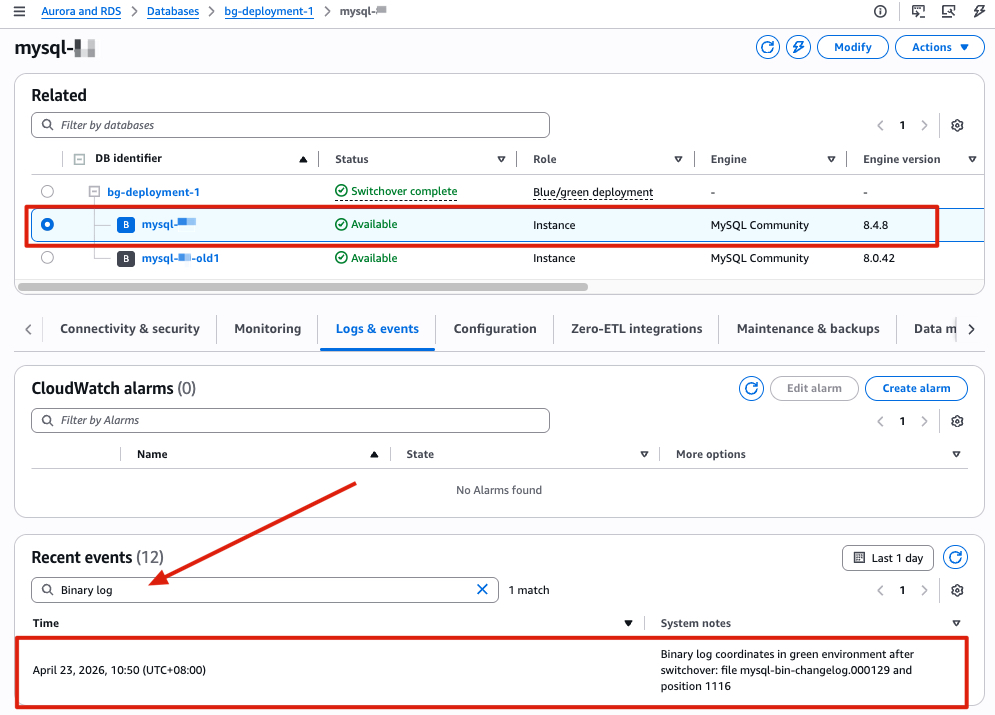
Set up reverse replication from the new MySQL 8.4 instance to the old MySQL 8.0 instance after switchover, so you have a working rollback path if issues arise post-upgrade. This approach uses change data capture (CDC) to synchronize only incremental changes. The key input is the binlog position recorded in the switchover event (Logs & events → Recent events on the new MySQL 8.4 instance). Use this position to establish reverse replication back to the old 8.0 instance.
The following table provides a brief comparison between Option A (native replication) and Option B (AWS DMS) to help you choose the approach that best fits your environment:
| Criteria | Native Replication | AWS DMS |
| Setup complexity | Lower | Higher |
| Additional cost | None | DMS instance cost |
| LOB handling | Automatic | Requires DMS task configuration |
| When to use | Direct network connectivity available | Complex environments or when native replication isn’t feasible |
Migration between RDS for MySQL instances is a homogeneous data migration. We recommend native replication as the preferred approach, because native database migration tools generally provide better performance and accuracy compared to AWS DMS.
After switchover, you do not need to change the read_only parameter to 0 on the MySQL 8.0 -old1 instance. In replication setups, it can be useful to enable read_only on replica servers to make sure that replicas accept updates only from the source server and not from clients.
-old1 instance, configure replication using the binlog position from step 1: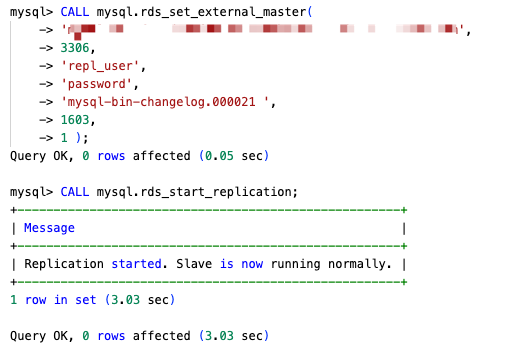
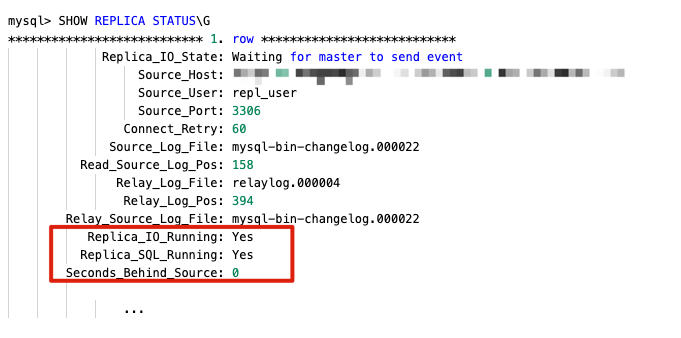
SHOW REPLICA STATUS\G and confirm the following:
If native replication is not suitable for your environment, you can use AWS DMS as an alternative to set up the rollback path.
Because the MySQL 8.0 -old instance is set to read-only after switchover, change the read_only parameter to 0 in its parameter group before creating the task.
-old1 instance endpoint% to include every database and exclude system databases (mysql, sys, information_schema, performance_schema).Once you have validated that the new RDS for MySQL 8.4 environment is working as expected, you can stop the DMS replication task and delete the old RDS for MySQL 8.0 instance.
After completing the upgrade and confirming your application is running normally on MySQL 8.4, you should remove the resources created during this process to avoid incurring additional charges. Follow these steps in the AWS Management Console or the AWS Command Line Interface (AWS CLI):
-old1 instance (after you confirm rollback is no longer needed). For more AWS CLI options, see Deleting a DB instance.
In this post, we walked through a three-phase approach for upgrading Amazon RDS for MySQL 8.0 to 8.4: interpreting pre-upgrade compatibility checks, performing the upgrade with minimal downtime using Amazon RDS Blue/Green Deployments, and setting up a rollback path with reverse replication. These phases give you a tested, reversible upgrade path with minimal downtime, reducing the risk that typically stalls major version upgrades. With MySQL 8.0 standard support ending on July 31, 2026, we encourage you to start planning your upgrade and validating your workloads against MySQL 8.4’s new features and performance improvements. If you need to continue using MySQL 8.0 beyond the standard support end date, see the breakdown of Extended Support costs in Upgrade strategies for Amazon RDS for MySQL 8.0 to 8.4.
To learn more, see Upgrading a MySQL DB instance engine version and Using Amazon RDS Blue/Green Deployments. If you have questions or feedback, leave a comment on this post.
Planet for the MySQL Community
https://d2908q01vomqb2.cloudfront.net/887309d048beef83ad3eabf2a79a64a389ab1c9f/2026/05/14/DB5369.png
Amazon Relational Database Service (Amazon RDS) for MySQL 8.0 is planned to reach end of standard support on July 31, 2026. To keep your databases up to date with bug fixes, security enhancements and the latest features, upgrade to MySQL version 8.4 before the current version reaches end of standard support. This is a major engine version upgrade.
When a new version is released for RDS for MySQL, you can choose how and when to upgrade your DB instances. However, major engine version upgrades can be complex and risky, introducing changes that might not work with existing applications and raising concerns about downtime and compatibility.
This post is part of a two-part series on upgrading RDS for MySQL 8.0 to 8.4. Here, we cover the end of standard support timeline, extended support costs, upgrade methods, and key best practices. For a step-by-step implementation guide, see Best practices for upgrading RDS for MySQL 8.0 to 8.4 with prechecks, Blue/Green, and rollback.
It is important to note that individual minor versions within MySQL 8.0 have their own end of support dates that might occur before the July 31, 2026 deadline. For example, minor version 8.0.28 reached its end of standard support on March 28, 2024. Always verify the support status of your specific minor version to avoid running on an unsupported version before the major version deadline. See the RDS for MySQL release calendar to stay up to date on end of standard support dates for various minor versions within a major version.
You can use the describe-db-engine-versions AWS Command Line Interface (AWS CLI) command to check available versions and their upgrade paths:
To check the available upgrade paths for your specific current version, run:
Excerpt from output:
This command helps you identify valid upgrade targets from your current version, so you can proactively plan your upgrade before end-of-support deadlines approach.
In September 2023, AWS announced Amazon RDS Extended Support, a paid offering that provides critical security and bug fixes for Amazon Aurora MySQL or Amazon RDS for MySQL major versions for up to three years after the end of standard support date. If you plan to upgrade at a later date, extended support gives you additional time to plan, test and execute major version upgrades without being rushed into an emergency migration.
Extended Support provides flexibility to upgrade on your timeline while maintaining full AWS support for security patches and critical bug fixes. It activates automatically after a major version’s end of standard support date and continues until you upgrade to a supported version, ensuring your databases remain secure and stable during your transition period. Extended Support charges are calculated on a per vCPU per hour basis. See Hardware specifications for DB instance classes to check the vCPUs corresponding to your DB instance class. The charges vary by AWS Region, with pricing structured based on how long a major version remains past its end of standard support date.
For a Multi-AZ deployment, both the primary and the standby instance are billed independently, because each runs the same instance class and carries the same vCPU count. This effectively doubles your Extended Support cost compared to a Single-AZ deployment. See the following example cost table for us-east-1 Region.
| Deployment Type | Instance class | vCPUs count | Year 1-2 | Year 3 |
| Single-AZ (SAZ) | db.r5.xlarge | 4 | $292/month | $584/month |
| Multi-AZ (MAZ) | db.r5.xlarge | 8 | $576/month | $1,152/month |
| MAZ primary with a SAZ read replica | db.r5.xlarge | 12 | $864/month | $1,728/month |
| MAZ primary with a MAZ read replica | db.r5.xlarge | 16 | $1,168/ month | $2,336/month |
For accurate, Region-specific pricing, refer to Amazon RDS Extended Support costs in RDS for MySQL pricing. You can also use the AWS Pricing Calculator to model your specific fleet.
As with any major version upgrade, there are important changes you should be aware of before upgrading so you can test your database and applications accordingly. MySQL 8.4 introduces meaningful behavioral and configuration changes from 8.0 that require thorough validation before migration. We call out a few important changes in this post. Refer to Changes in MySQL 8.4 as your primary reference for the complete list of changes.
In MySQL 8.0 (on RDS), the default authentication plugin was mysql_native_password. In MySQL 8.4, mysql_native_password is disabled by default, and caching_sha2_password is now the default authentication plugin for RDS for MySQL 8.4. For more information, see MySQL default authentication plugin. You can audit your database users to identify any accounts still using mysql_native_password and update them as needed. Verify that your application drivers and connectors support caching_sha2_password.
MySQL 8.4 has also fully transitioned to SOURCE/REPLICA terminology, replacing the legacy MASTER and SLAVE keywords. As a result, review and update any scripts, automation, or documentation that references the old terminology. In addition, there is an updated list of reserved keywords. See MySQL 8.4 Keywords and Reserved Words for the complete list. If any reserved keywords are present in your workload, they will also be flagged in the upgrade precheck log file discussed in the following section.
Lastly, MySQL 8.4 changed the default values for several InnoDB server system variables. These changes can impact performance and behavior, especially if you are relying on the previous defaults. For example, innodb_adaptive_hash_index changed from ON (MySQL 8.0 default) to OFF (MySQL 8.4 default). For a complete list, see MySQL 8.4 Changed Server Defaults. If you have custom parameter group values set for any of these parameters, evaluate whether those are compatible with the new default settings.
For a comprehensive view of all features added, changed, and deprecated in MySQL 8.4 compared to MySQL 8.0, refer to What Is New in MySQL 8.4 since MySQL 8.0.
When you initiate an upgrade from RDS for MySQL 8.0 to 8.4 from the AWS Management Console or AWS Command Line Interface (AWS CLI), RDS runs mandatory prechecks automatically in the background to detect any incompatibilities. These prechecks run before the DB instance is stopped for the upgrade, with no downtime during the validation phase.
If prechecks detect incompatibilities, RDS automatically cancels the upgrade and generates an event notification. Your original MySQL 8.0 instance remains unchanged with no downtime. To identify the specific incompatibilities that blocked the upgrade, review the PrePatchCompatibility.log file available in the Logs and events section of the Amazon RDS console. This log provides detailed information about each incompatibility, allowing you to address the issues before reattempting the upgrade. You can also retrieve the log file using the AWS CLI with the describe-db-log-files and download-db-log-file-portion commands.
As a best practice, test the upgrade process before upgrading in production. You can either use snapshot restore or RDS Blue/ Green Deployments to test the upgrade. Alternatively, you can also use RDS read replica and perform the upgrade first on the replica instance to test for changes and then upgrade the primary. Performing these tests not only provides you with upgrade incompatibilities (if any) using the RDS prechecks log file, but also provides you with an estimate of how long it takes for the prechecks to run and the complete the upgrade. The duration of the upgrade varies depending on the workload and number of database objects. Lastly, these prechecks identify incompatibilities in the database objects, such as reserved words in a procedure definition. They do not validate any application-side logic. Therefore, verify how any reserved keywords or unsupported syntax can impact your application. For detailed information regarding all RDS prechecks, refer to Best practices for upgrading Amazon RDS for MySQL 8.0 to 8.4 with prechecks, Blue/Green, and rollback.
You can also review any incompatibilities by running the MySQL community upgrade checker utility.
In this section, we cover the available upgrade options in order of complexity and downtime impact. Upgrading an RDS instance requires downtime for the duration of the upgrade.
The in-place upgrade is the most straightforward path. RDS upgrades the engine version on the existing instance without creating a new one, preserving the same endpoint, resource ID, and storage volume. Before RDS begins the upgrade, it automatically takes a pre-upgrade snapshot that you can use in case of any issues. An in-place upgrade cannot be canceled once started. For Multi-AZ DB instance deployments, RDS upgrades both the primary and standby instances simultaneously during major version upgrades. If the upgrade fails, RDS attempts an automatic rollback. If you do not have automated backups enabled on your RDS instance, take a manual snapshot as a rollback option before starting the upgrade. Verify that your custom parameter groups and option groups are compatible with the target MySQL version, as deprecated or renamed parameters between versions can cause unexpected behavior post-upgrade. For complete steps, refer to upgrading the MySQL DB engine.
For production environments where minimizing downtime is the top priority, Amazon RDS blue/green deployments are the right choice. Amazon RDS creates the green environment from a snapshot of the blue environment. The feature requires automated backups to be enabled and runs your current production instance (blue) and a fully upgraded staging instance (green) side by side, keeping them synchronized via MySQL binary log replication until you’re ready to switchover. As the storage blocks are being loaded from Amazon Simple Storage Service (Amazon S3), the green environment experiences lazy loading effects. Switchover times have been reduced to under five seconds, delivering near-instantaneous cutover with minimal application impact. For switchover, RDS drops existing connections and blocks new connections, performs a final sync, and automatically renames the green endpoints to match the blue endpoints. This eliminates any application configuration changes. If issues surface after the switchover, you can manually switch back to the blue environment, because the original instance remains running and available throughout. The additional infrastructure cost during the deployment window is the primary trade-off, but for risk-averse production upgrades, the near-zero downtime and immediate rollback capability make blue/green the strongest option available.
Snapshot restore is a fully manual process best suited for dev/test environments or scenarios where complete isolation between the old and new versions is required. You take a manual snapshot of the source instance, restore from it while selecting the target MySQL 8.4 version, and the upgrade runs as part of the restore operation. The original instance remains untouched throughout, giving you a clean rollback path. To roll back, redirect traffic back to the original endpoint if the upgraded instance has issues. The downside is that the new restored instance gets a different endpoint, requiring application configuration updates, and read replicas must be manually recreated. Restore and upgrade time for large databases can range from minutes to hours, making this approach impractical for production cutover windows but valuable for pre-production validation.
For an in-place upgrade you can restore the pre-upgrade snapshot taken by RDS in case of any issues. Perform additional validation to verify that there is no data loss for any transactions committed after the snapshot was taken. Blue/green deployments offer the strongest rollback: the blue environment stays live throughout, and switching back takes seconds making it the right choice for any production upgrade where immediate recovery is a hard requirement. Additionally, you can also set up manual binlog replication from the green environment to the blue environment to minimize data loss after switchover. Snapshot restore sits in the middle: the original instance is unchanged and available, but you’re managing two separate endpoints and must redirect traffic manually. For a detailed breakdown of rollback behavior across all three methods, refer to the AWS documentation on rollback after failure to upgrade. In all three cases, test and practice your rollback procedure in a non-production environment before the production upgrade window. Check detailed rollback steps in this post.
The following table summarizes the upgrade options available for Amazon RDS for MySQL:
| Method | Downtime | Rollback Capability | Best for |
| In-place upgrade | Minutes to hours (varies by deployment type and DB size) | Limited. Automatic rollback might be possible in some cases; snapshot restore is required | Environments with an acceptable downtime window |
| RDS Blue/Green Deployment | Typically, under 5 seconds (switchover) | Excellent. Immediate switchback to blue environment with no data loss | Production upgrades requiring minimal downtime and fast rollback |
| Snapshot restore | Hours (restore + upgrade time) | Good — original instance unchanged; endpoint change required for rollback | Dev/test validation; isolated upgrade testing before production cutover |
For Multi-AZ deployments, RDS upgrades both the primary and standby instances simultaneously during the maintenance window, resulting in downtime for the duration of the upgrade process. Blue/green deployments replicate the Multi-AZ configuration in the green environment automatically. If your DB instance uses in-Region or cross-Region read replicas, then you must upgrade all the read replicas before upgrading the source instance. In all cases, review your custom parameter groups against the target MySQL version before initiating the upgrade. Deprecated parameters are a common source of post-upgrade surprises that are easier to catch before the upgrade window than after it.
When a major version upgrade is invoked on the console or via the AWS CLI or Amazon RDS API, Amazon RDS automation completes the following steps:
PrePatchCompatibility.log file.A major version upgrade cannot be rolled back automatically once it has completed successfully. This is why testing the upgrade on a non-production copy (using a read replica, a snapshot restore, or a point-in-time restore) is strongly recommended before upgrading your production instance.
The following key best practices will help you plan and execute a smooth upgrade from RDS for MySQL 8.0 to 8.4. This is not an exhaustive list.
mysql_native_password authentication plugin being disabled by default, the removal of legacy MASTER/SLAVE terminology, and InnoDB server variable default changes.mysql8.4. Create and configure your new parameter group before the upgrade window, comparing your existing values against the new defaults. Pay particular attention to InnoDB parameters such as innodb_adaptive_hash_index. See Working with parameter groups.PrePatchCompatibility.log file. A non-zero errorCount means the upgrade did not proceed. Resolve all flagged issues before your production window. For more information, refer to RDS prechecks for upgrades.In this post we reviewed the MySQL 8.0 end of standard support timelines, extended support charges and the options available to perform an upgrade. Upgrade your RDS for MySQL instances to the latest minor version in MySQL 8.4 before July 31, 2026 to avoid extended support costs. For critical workloads with minimal downtime requirements, use the Amazon RDS Blue/ Green Deployments with a detailed implementation guide (Best practices for upgrading RDS for MySQL 8.0 to 8.4 with prechecks, Blue/Green, and rollback). We recommend that you start by testing the upgrade, reviewing your precheck log, and building familiarity with MySQL 8.4 before performing the upgrade on your production environments.
Planet for the MySQL Community
https://media.notthebee.com/articles/6a05c6aae56926a05c6aae5693.jpg
Y’all know that the autism-vaccine debate is one of the most live-wire, hot-button issues right now. People come to blows over it, figuratively and probably sometimes literally. It’s a fraught question.
Not the Bee
https://media.notthebee.com/articles/6a04dc6fb64dc6a04dc6fb64dd.jpg
I know everyone is an expert on Iran – and the Middle East in general – these days, so obviously college graduates are able to point out Iran on a map, right?
Not the Bee
https://reliadb.com/images/og-default.png
The system is running. ProxySQL in front of Aurora, query rules routing reads to replicas, the two-node cluster syncing config in ~600ms, TLS on the backend leg. Four parts to reach this point. The question shifts now: how do you know it’s still working correctly at 3am on a Sunday — and when it isn’t, where do you look?
This part covers the operational layer. The same Lima lab topology from Parts 1–4 runs throughout: dbdeployer MySQL 8.0.41 sandbox (master on port 25001, two replicas on 25002 and 25003), ProxySQL 2.7.3 on proxysql-1 and proxysql-2, backends in HG 10 (writer) and HG 20 (readers). No AWS resources — Part 5 is fully local. The Aurora-specific captures referenced in Section 2 are reused from Parts 2 and 4, cited explicitly.
Part 1 made the placement decision. Part 2 wired ProxySQL to Aurora’s native topology discovery — mysql_aws_aurora_hostgroups, REPLICA_HOST_STATUS, 2 errors across 1,485 queries through a live failover. Part 3 built the query routing layer: mysql_query_rules, the ordering rule for SELECT ... FOR UPDATE, transaction_persistent, and the exact conditions that break multiplexing. Part 4 tested the full HA stack under pressure — Aurora at T0+15s, RDS Multi-AZ at T0+64s, TLS footguns in auto-discovery, and NLB health check timing that says 90 seconds in the docs but measured 110 in the lab.
Part 5 adds three things those parts explicitly deferred: the monitoring layer you query to know the system is healthy, the tuning decisions now grounded in observed behavior, and the recovery path for the most common non-obvious production failure mode.
Three tables cover health at different granularities. Together they answer: is my proxy routing correctly, how loaded is my backend pool, and did my Aurora topology discovery run cleanly?
stats_mysql_query_digest: Workload Shape and Latency Baselines-- Tested on Lima VMs, MySQL 8.0.41 via dbdeployer, ProxySQL 2.7.3, 2026-05-10
stats_mysql_query_digest accumulates per-digest statistics for every query ProxySQL routes. The primary uses are identifying slow queries by total time spent and reading the shape of your workload — which hostgroups are receiving traffic and in what proportions.
The two captures below show the same ProxySQL instance under two workload patterns. Both are correct behavior. The point is that monitoring tells you which shape you have; your job is to verify it matches what you expect.
Shape A — Transactional workload with transaction_persistent=1 (Part 5 lab, 20 sysbench threads, 300s oltp_read_write):
-- stats_mysql_query_digest on proxysql-1 — top 5 by sum_time, 300s oltp_read_write load
-- Note: all queries land in HG 10 — see analysis below
hostgroup  schemaname  digest_text                                count_star  avg_time_us
10         lab_test    SELECT c FROM sbtest1 WHERE id=?           193270      1936
10         lab_test    SELECT c FROM sbtest2 WHERE id=?           193150      1929
10         lab_test    SELECT c FROM sbtest4 WHERE id=?           191770      1940
10         lab_test    SELECT c FROM sbtest3 WHERE id=?           192110      1927
10         lab_test    COMMIT                                      77046      4280
Every query — including the SELECT statements — landed in HG 10 (the writer). HG 20 (readers) received 644 total executions against 247,593 for HG 10. This is not a routing misconfiguration. The oltp_read_write workload wraps every statement inside BEGIN … COMMIT. With transaction_persistent=1 set on the app user, ProxySQL pins all queries in a detected transaction to the same hostgroup — the writer, where the transaction opened. The reads never had an opportunity to fan out to replicas because the transaction boundary kept them anchored.
The corresponding connection pool snapshot confirms this:
-- stats_mysql_connection_pool on proxysql-1 (mid-load, 20 sysbench threads)
hostgroup  srv_host       srv_port  status  ConnUsed  ConnFree  ConnOK  Latency_us
10         192.168.105.6  25001     ONLINE  20        0         20      2489
20         192.168.105.6  25002     ONLINE   0        12        12      2556
20         192.168.105.6  25003     ONLINE   0         9         9      2445
ConnUsed=20 on HG 10 — one backend connection per sysbench thread, held for the duration of each active transaction. ConnUsed=0 on both replicas — they’re healthy and connected, but receiving no queries.
Shape B — Idle multiplexing baseline (from the Part 3 lab, 100 Python threads, SELECT 1, no session state — reused for comparison):
-- stats_mysql_connection_pool on proxysql-1 (T0+10s, 100 idle frontends, no session state)
-- Source: Part 3 A.5 capture — reused for baseline comparison
hostgroup  srv_host       srv_port  ConnUsed  ConnFree
10         192.168.105.6  25001     0         100
20         192.168.105.6  25002     0          42
20         192.168.105.6  25003     0          61
One hundred frontend sessions open. Zero backend connections pinned to any of them. After SELECT 1 completed, ProxySQL returned all connections to the free pool — the frontends are connected, they just don’t hold a MySQL thread on the other side.
The diagnostic question these two shapes answer: if you expect reads to distribute across replicas but HG 20 shows ConnUsed=0 and stats_mysql_query_digest shows all executions in HG 10, check transaction_persistent first, then check whether your ORM or application wraps reads inside explicit transactions. Both shapes above represent correct behavior for their respective workloads. The monitoring tells you which one you’re looking at.
The two queries to run routinely:
-- Top 10 queries by total time spent — identifies slow-query candidates
SELECT hostgroup, schemaname, username, digest_text,
       count_star,
       ROUND(sum_time / count_star) AS avg_time_us,
       max_time
FROM stats_mysql_query_digest
ORDER BY sum_time DESC
LIMIT 10;

-- Per-hostgroup execution distribution — reveals workload shape
SELECT hostgroup,
       COUNT(DISTINCT digest)    AS unique_queries,
       SUM(count_star)           AS total_executions
FROM stats_mysql_query_digest
GROUP BY hostgroup
ORDER BY hostgroup;
Rising avg_time_us on a digest that was previously stable is the early slow-query signal. Unexpected hostgroup skew — all traffic in HG 10 when you expect a 70/30 read split — tells you to check transaction_persistent or your query rules before blaming the backends.
mysql_server_aws_aurora_log: Topology Detection and Gap Alertingmonitor.mysql_server_aws_aurora_log is the only table that shows Aurora topology discovery in real time. ProxySQL writes a row every check_interval_ms for each backend it polls. It’s the authoritative record of whether ProxySQL is successfully reading INFORMATION_SCHEMA.REPLICA_HOST_STATUS — and how long each poll took.
-- monitor.mysql_server_aws_aurora_log — healthy polling pattern (3-row excerpt)
-- Source: Part 2 live Aurora lab capture, 2026-05-08 (reused — no AWS resources in Part 5)
SELECT check_utc, hostname, is_writer_per_replica_host_status AS writer_detected, lag_ms
FROM monitor.mysql_server_aws_aurora_log
ORDER BY check_utc DESC
LIMIT 3;
check_utc               hostname (polled)                           writer_detected              lag_ms
2026-05-08 10:53:16     proxysql-aurora-EXAMPLE-writer.EXAMPLE...  proxysql-aurora-EXAMPLE-writer   0
2026-05-08 10:53:14     proxysql-aurora-EXAMPLE-reader.EXAMPLE...  proxysql-aurora-EXAMPLE-writer   0
2026-05-08 10:53:12     proxysql-aurora-EXAMPLE-reader.EXAMPLE...  proxysql-aurora-EXAMPLE-writer   0
A healthy pattern: rows appear at roughly check_interval_ms intervals, writer_detected is consistent across all rows in a given window, and lag_ms stays low or zero. The 6-second detection gap from the Part 2 and Part 4 failover captures appeared in this table exactly: ProxySQL polled on schedule throughout, but Aurora’s backends were unreachable mid-promotion, so no rows appear between 10:53:10 and 10:53:16. Section 3 covers how to size check_interval_ms against that observed promotion floor.
Detection gap alerting rule: alert when no successful poll row appears for more than 2×check_interval_ms. At check_interval_ms=2000, that’s a 4-second silence. Any gap longer than that means ProxySQL either can’t reach the backend or Aurora’s control plane is mid-promotion. This is the right threshold to wire into your monitoring system — not a static time value, but a function of your configured polling interval.
SCHEMA NOTE: mysql_server_aws_aurora_log lives in the monitor schema, not in main or stats. Use SELECT ... FROM monitor.mysql_server_aws_aurora_log. The table main.mysql_server_aurora_log does not exist in ProxySQL 2.7.3. This footgun was documented in Part 2 during the auto-discovery setup.
stats_mysql_connection_pool and stats_mysql_processlist: Pool Headroomstats_mysql_connection_pool answers the connection budget question: how close am I to exhausting the backend pool? The ConnUsed / (ConnUsed + ConnFree) ratio is the headroom metric. The mid-load capture from the Part 5 lab shows the pattern for a transactional workload:
-- stats_mysql_connection_pool on proxysql-1 (mid-load, 20 threads, oltp_read_write)
-- Tested on Lima VMs, MySQL 8.0.41 via dbdeployer, ProxySQL 2.7.3, 2026-05-10
hostgroup  srv_host       srv_port  status  ConnUsed  ConnFree  ConnOK  ConnERR  Queries   Latency_us
10         192.168.105.6  25001     ONLINE  20        0         20      0        181493    2489
20         192.168.105.6  25002     ONLINE   0        12        12      2280     116       2556
20         192.168.105.6  25003     ONLINE   0         9         9      2230     83        2445
A few readings worth calling out. ConnERR of 2,280 and 2,230 on the replicas are artifacts of earlier lab sessions, not live failures — verify by watching whether they increment during active load. If ConnERR climbs alongside a ConnUsed spike, that’s a backend connectivity problem. If it’s static, it’s historical noise.
Latency_us is the proxy-measured round-trip for health checks to each backend. Rising latency on one backend before rising ConnERR is the early warning signal: the backend is struggling before it starts failing checks. At 2,489µs on the master and ~2,500µs on the replicas, latency is healthy and symmetric in this capture.
Pool headroom alert threshold: flag when ConnUsed / (ConnUsed + ConnFree) > 0.8 sustained for more than 30 seconds on any hostgroup. Below 0.5 at steady state is healthy. Above 0.8 means you’re approaching the connection ceiling — either raise max_connections in mysql_servers, add a backend, or reduce transaction_persistent scope if the workload allows it.
stats_mysql_processlist gives the live per-session view — which hostgroup each frontend session is currently assigned to and what command it’s running:
-- stats_mysql_processlist on proxysql-1 (mid-load snapshot)
SELECT SessionID, user, db, hostgroup, command, time_ms, info
FROM stats_mysql_processlist
ORDER BY time_ms DESC
LIMIT 10;
During the Part 5 sustained load, all 20 sessions showed hostgroup=10 with a mix of Execute and Sleep states. A session in Sleep with time_ms climbing means it’s holding an open backend connection without issuing queries — the cost of transaction_persistent=1 in a slow-consumer application. Use processlist during incidents to see exactly which sessions are holding pool resources and which queries are actively executing.
The right values for these variables don’t come from the ProxySQL docs. They come from your own observed promotion time and workload shape. Here’s how to derive them from the data Parts 2–4 already captured.
check_interval_ms: Sizing Against the Promotion FloorThe detection latency formula from Part 2’s detection math section:
detection latency = Aurora internal promotion time (~6s, opaque to ProxySQL)
                  + at most one check_interval_ms cycle
Aurora’s internal promotion time is the floor — ProxySQL was polling on schedule throughout both the Part 2 and Part 4 failovers, but the backends were simply unreachable while Aurora was mid-promotion. Lowering check_interval_ms below 1000ms adds polling load on Aurora’s INFORMATION_SCHEMA without meaningfully reducing detection latency — the floor is Aurora’s promotion time, and that’s set by instance class and cross-AZ replication state, not polling frequency.
check_interval_ms controls the worst-case additional lag on top of that floor:
check_interval_ms |
Worst-case detection | Typical use case |
|---|---|---|
| 2000ms (2s) | ~8s | Most production workloads — low overhead, tight detection |
| 5000ms (5s) | ~11s | Cost-sensitive setups; 3s of additional lag vs. 2000ms is acceptable for many apps |
| 10000ms (10s) | ~16s | Background or batch Aurora clusters where sub-15s detection isn’t required |
The Part 2 lab used check_interval_ms=2000; Part 4 used 5000. Both labs produced identical detection floors because the constraint was Aurora’s ~6-second internal promotion, not polling frequency. Choose based on the detection window your application’s connection pool and retry logic can tolerate — not on the assumption that faster polling reduces the floor. check_timeout_ms must also remain below check_interval_ms and at or below 3000ms (ProxySQL 2.7.3 enforces this with a CHECK constraint; a silent INSERT failure is the symptom if you exceed it, as documented in Part 4).
max_replication_lag vs max_lag_msThese are two different columns in two different tables with different units. Conflating them produces a config that looks correct but either does nothing or clips reads far more aggressively than intended.
| Column | Table | Unit | Scope | What it controls |
|---|---|---|---|---|
max_replication_lag |
mysql_servers |
seconds | Standard MySQL replication | SHUNNED when Seconds_Behind_Source > max_replication_lag |
max_lag_ms |
mysql_aws_aurora_hostgroups |
milliseconds | Aurora only (REPLICA_HOST_STATUS) |
Excludes reader from HG when replica_lag_in_milliseconds > max_lag_ms |
The footgun: max_lag_ms=600000 in mysql_aws_aurora_hostgroups means 600000 milliseconds (= 600 s = 10 minutes of acceptable Aurora replica lag) — a generous lab default from Part 2; the column name carries the _ms unit. The sibling knob mysql_servers.max_replication_lag is in whole seconds for standard replication lag. Copying the numeric literal 600000 from max_lag_ms into max_replication_lag does not mean “10 minutes”; it means 600000 seconds (about 7 days). Your replicas would have to lag roughly a week before ProxySQL excluded them from routing.
Lab result for max_replication_lag: with max_replication_lag=2 set on replica2 (port 25003) and the replica’s SQL thread stopped, Seconds_Behind_Source returns NULL. ProxySQL treats NULL as 60 seconds of lag by default — so a stopped SQL thread suddenly looks like a 60-second-lagging replica even though the underlying data is fine. The variable mysql-monitor_slave_lag_when_null=60 controls this; size it based on how tolerant your application is of reads from a replica whose SQL thread is stopped.
With slave_lag_when_null=60 and max_replication_lag=2, replica2 transitioned to SHUNNED within one monitor_replication_lag_interval cycle (10 seconds) after the SQL thread was stopped. The status was SHUNNED, not OFFLINE_SOFT — that’s the actual ProxySQL 2.7.3 behavior for lag-threshold violations. Reads stopped routing to replica2 immediately; replica1 absorbed them cleanly.
Recovery after START REPLICA SQL_THREAD: replica2 returned to ONLINE in approximately 72 seconds — about 7× the 10-second monitor_replication_lag_interval, as the lag counter drained across multiple polling cycles before ProxySQL confirmed it was clear. Recovery time is bounded by monitor_replication_lag_interval × monitor_replication_lag_count polling cycles, not by a fixed timeout.
transaction_persistent and Multiplexing VariablesThe Part 5 sysbench capture (all traffic in HG 10) makes the transaction_persistent tradeoff concrete. With transaction_persistent=1, queries inside an open transaction stay on the writer. This is correct for application accounts that hold real transactions — the alternative, allowing in-transaction reads to jump to a replica, would route a SELECT to a server that doesn’t yet have the transaction’s uncommitted writes visible, which produces inconsistent reads without any error. Don’t set transaction_persistent=0 for application accounts that use explicit transactions or that issue DML.
Set transaction_persistent=0 for analytics or reporting accounts that connect, run a read, and disconnect — no open transactions, no consistency hazard. This is the same analytics user pattern from Part 3.
Two monitor variables worth knowing for the lag and health check rhythm:
mysql-monitor_ping_interval=10000 (10s default): how often ProxySQL sends COM_PING to each backend on existing connections. With mysql-monitor_ping_max_failures=3, three consecutive ping failures trigger SHUNNED — a 30-second window of consistently-failing pings before a backend is excluded.mysql-wait_timeout=28800000 (8 hours): how long ProxySQL keeps backend connections alive. This means a credential change on the MySQL side doesn’t immediately invalidate existing ProxySQL connections — they continue using the cached auth until the connections cycle out or a new connection attempt fails. Section 5 covers exactly what this looks like when it’s the monitor user whose credentials change.LAB NOTE: ProxySQL 2.7.3 was the latest available 2.7.x package in our apt repository at time of writing — there was no newer minor version to upgrade to. The runbook below is the canonical drain/upgrade/restore procedure for any binary upgrade; only the apt-get install proxysql=2.7.X version string changes. We executed the full cycle on both nodes to verify timing and zero-error behavior on a properly-configured client.
ZERO ERRORS, ~25 SECONDS PER NODE: A Linux MySQL 8.0 client running queries against both ProxySQL nodes throughout the upgrade window saw 0 errors across 40 requests during post-upgrade verification. Per-node cycle from drain to restored: ~26 seconds on node 1, ~20 seconds on node 2. The surviving node handled all traffic seamlessly during each drain window.
Note: a macOS MySQL 9.5 client in the test harness produced ERROR 2059 (HY000): Authentication plugin 'mysql_native_password' cannot be loaded errors — the mysql_native_password.so plugin was removed from MySQL 9.x. These are client-side errors unrelated to ProxySQL behavior, confirmed by parallel testing from the Linux client which saw 0 errors.
Step 1 — Capture pre-upgrade baseline. Record the version and connection pool state on both nodes before touching anything. If something goes wrong during the upgrade, this snapshot is your reference point.
-- Pre-upgrade version baseline on both nodes (proxysql-1 shown)
-- Tested on Lima VMs, ProxySQL 2.7.3, 2026-05-10
SELECT @@version;
-- 2.7.3-12-g50b7f85

SELECT hostgroup, srv_host, srv_port, status, ConnUsed, ConnFree
FROM stats_mysql_connection_pool
ORDER BY hostgroup, srv_port;
Step 2 — Start background traffic. Run a SELECT loop from your client against both ProxySQL nodes simultaneously. Log every response with a timestamp — this is the evidence trail that quantifies the upgrade’s error window. In production, your application’s existing traffic serves this purpose; in a maintenance window, an explicit probe script gives you a clean record.
Step 3 — Drain proxysql-1. In production: deregister proxysql-1 from the NLB target group first (NLB default connection draining: 30 seconds). Wait for in-flight connections to finish, then stop the service. The NLB routes all new connections to proxysql-2 from the moment the target is deregistered. In the lab, where there’s no NLB, stopping the service directly simulates this:
# Drain proxysql-1 (lab simulation of NLB target deregistration + service stop)
# Production: deregister from NLB first, wait for connection draining, then stop
sudo systemctl stop proxysql
Verify proxysql-1 is unreachable on port 6033 and proxysql-2 is serving normally before proceeding. Part 4’s NLB section covers the 110-second real-world detection window versus the theoretical 90-second threshold — size your drain window accordingly.
Step 4 — Upgrade the binary.
# Upgrade ProxySQL binary (replace 2.7.X with your target version)
sudo apt-get install proxysql=2.7.X
Step 5 — Start the service and verify cluster sync. After systemctl start proxysql, the restarted node bootstraps from its peer automatically — given a populated proxysql_servers table and matching cluster credentials, it fetches the current runtime config from proxysql-2 within the cluster’s check_interval_ms window (~600ms in our lab from Part 4).
# Start ProxySQL after upgrade; cluster sync bootstraps from peer automatically
sudo systemctl start proxysql
-- Verify cluster sync on the restarted node: runtime_mysql_servers should match proxysql-2
SELECT hostgroup_id, hostname, port, status
FROM runtime_mysql_servers
ORDER BY hostgroup_id, port;
If runtime_mysql_servers shows the master (port 25001) in both HG 10 and HG 20 after restart, that’s expected: mysql-monitor_writer_is_also_reader=true places the master in both the writer and reader hostgroups. It’s not a routing anomaly — it reflects the ProxySQL default that allows reads to land on the writer when both replicas are lagging or SHUNNED.
If mysql_servers doesn’t arrive on the restarted node, check whether admin-cluster_mysql_servers_sync_algorithm=1 (delta mode) is set and the node has no sync baseline — the bootstrap footgun from Part 4. Set it to 0 temporarily to force a full pull, then restore 1.
Step 6 — Re-register with NLB (production step) and spot-check traffic through the upgraded node.
Step 7 — Repeat for proxysql-2.
Lab timing for both nodes:
| Step | proxysql-1 | proxysql-2 |
|---|---|---|
| Service stopped | 21:01:27Z | 21:02:56Z |
| Service back online | 21:01:53Z | 21:03:16Z |
| Total cycle | ~26s | ~20s |
The per-node time includes the apt-get install step. In a real upgrade where the package download is already cached, the binary swap itself takes under 5 seconds — the remaining time is service start, monitor thread initialization, and cluster sync confirmation.
The most common non-obvious production failure with ProxySQL follows a specific pattern: backends appear SHUNNED or errors start climbing, the instinct is to check Aurora or the MySQL backends directly, but the actual cause lives in a ProxySQL internal table that most DBAs don’t check first. Here’s the diagnostic sequence that surfaces it quickly.
The worked example is monitor user credential revocation. ProxySQL connects to each backend using the monitor user (set via mysql-monitor_username and mysql-monitor_password) to run health checks — COM_PING, SHOW REPLICA STATUS for replication lag, SHOW GLOBAL VARIABLES LIKE 'read_only' for writer detection. If those credentials break — password rotation without updating ProxySQL, a permission change by someone who didn’t know the monitor user was load-bearing — every health check against every backend starts failing simultaneously.
The troubleshooting flowchart:
Symptom: rising errors or SHUNNED backends in runtime_mysql_servers
                │
                ▼
   Step 1: Check runtime_mysql_servers
   ──────────────────────────────────────────────────────
   All ONLINE?
     YES → backend health is fine → check query rules
           and stats_mysql_query_digest for routing anomalies
     NO (SHUNNED present) → continue ↓
   ──────────────────────────────────────────────────────
                │
                ▼
   Step 2: Check mysql_server_connect_log
   ──────────────────────────────────────────────────────
   SELECT hostname, port, time_start_us,
          connect_success_time_us, connect_error
   FROM monitor.mysql_server_connect_log
   ORDER BY time_start_us DESC LIMIT 20;

   connect_error = NULL?
     YES → connect checks are clean → go to ping_log
     "Access denied for user 'monitor'" → FOUND IT
   ──────────────────────────────────────────────────────
                │
                ▼
   Step 3: Confirm with mysql_server_ping_log
   ──────────────────────────────────────────────────────
   SELECT hostname, port, time_start_us,
          ping_success_time_us, ping_error
   FROM monitor.mysql_server_ping_log
   ORDER BY time_start_us DESC LIMIT 20;

   Same "Access denied" pattern? → confirms monitor credentials
   "Gone away" / timeout? → backend connectivity problem
   ──────────────────────────────────────────────────────
                │
                ▼
   Step 4: Verify the monitor user directly on the backend
   ──────────────────────────────────────────────────────
   mysql -h <backend-host> -P <port> -u monitor -p'<pass>' \
     -e "SHOW REPLICA STATUS\G"

   Access denied → confirm which grant is missing
   ──────────────────────────────────────────────────────
                │
                ▼
   Step 5: Restore
   ──────────────────────────────────────────────────────
   On the MySQL backend (run on master; replicated to replicas):
     GRANT REPLICATION CLIENT ON *.* TO 'monitor'@'%';
     GRANT SELECT ON sys.* TO 'monitor'@'%';
     FLUSH PRIVILEGES;

   If the password changed on the MySQL side, also update ProxySQL:
     SET mysql-monitor_password='<new-pass>';
     LOAD MYSQL VARIABLES TO RUNTIME;
     SAVE MYSQL VARIABLES TO DISK;
   ──────────────────────────────────────────────────────
MONITOR-USER REVOCATION: DIAGNOSTIC ORDER
runtime_mysql_servers for SHUNNED backends — this is the symptom, not the cause.monitor.mysql_server_connect_log ordered by time_start_us DESC. Look at connect_error. "Access denied for user ‘monitor’" on every recent row is the smoking gun.monitor.mysql_server_ping_log — the same "Access denied" pattern appears here once existing cached backend connections cycle out.mysql -h <backend> -u monitor -p'<pass>' -e "SHOW REPLICA STATUS\G" — confirms which specific privilege is missing.GRANT the missing privilege on the MySQL backend, FLUSH PRIVILEGES, and if the password changed on the MySQL side, update mysql-monitor_password in ProxySQL global_variables and LOAD MYSQL VARIABLES TO RUNTIME.What the lab capture shows. After changing the monitor user’s password to an incorrect value on the MySQL backend, monitor.mysql_server_connect_log filled with this pattern on the next connect-check cycle:
-- monitor.mysql_server_connect_log — credential failure in progress
-- connect_interval=60s; errors appear once per cycle on each backend
hostname       port   time_start_us       connect_success_time_us  connect_error
192.168.105.6  25001  1778361407360863    0   Access denied for user 'monitor'@'proxysql-1' (using password: YES)
192.168.105.6  25002  1778361406680516    0   Access denied for user 'monitor'@'proxysql-1' (using password: YES)
192.168.105.6  25003  1778361408042762    0   Access denied for user 'monitor'@'proxysql-1' (using password: YES)
All three backends, same error, every connect-check cycle. That pattern — not one backend, not an intermittent error, but every backend on every cycle — points directly at the monitor credentials, not at backend connectivity.
Auth failures don’t trigger SHUNNED instantly. The connect check fires every mysql-monitor_connect_interval (default 60s), and ProxySQL needs mysql-monitor_ping_max_failures consecutive ping failures before it formally SHUNs a backend. What you see first is the connect log filling with "Access denied" entries — one per polling cycle per backend. That window, from first error to formal SHUNNED, is your diagnostic opportunity. The signal is clear and early; the cascade is gradual by design. A credential problem that would cause a full SHUNNED state on all backends gives you several minutes of warning in mysql_server_connect_log before client traffic starts seeing widespread errors.
Recovery is equally bounded by the polling cycle. After restoring the correct credentials on the MySQL backend, the connect log showed a clean entry 11 seconds after the GRANT was restored — that’s wherever in the 60-second polling cycle the next connect check happened to fire. The range is 0 to mysql-monitor_connect_interval (60s default); expect recovery on the next monitor poll after the fix is applied.
The monitoring layer takes minutes to query and hours to interpret if you don’t know what healthy looks like. If you’re seeing SHUNNED backends, rising ConnERR, or Aurora detection gaps you can’t explain, a 30-minute call usually narrows it to one root cause.
Three topics adjacent to this series are real and important. Each deserves its own treatment.
Sharding. ProxySQL supports basic query-level sharding — routing by schema boundary or by a rule that hashes a user ID into a destination hostgroup. For simple cases this works. For production sharding at scale, with consistent cross-shard transactions and managed schema migrations, this is Vitess territory. ProxySQL’s sharding support is a routing primitive, not a sharding framework.
Multi-region Aurora + ProxySQL. Aurora Global Database places a writer in one region and reader clusters in others, with sub-second replication lag. ProxySQL in front of a Global Database deployment is a different configuration: mysql_aws_aurora_hostgroups scoped per-region, topology discovery that stays local while the primary region is healthy, and failover coordination when a secondary region is promoted to writer. This series covers single-region Aurora only.
PostgreSQL ProxySQL HA. ProxySQL speaks MySQL wire protocol. For PostgreSQL, the equivalent stack is different: see the ProxySQL PostgreSQL HA series which covers the same placement-to-operations arc for PostgreSQL backends.
Across five parts, you’ve built and operated a production-representative ProxySQL + Aurora MySQL topology: decided where the proxy layer goes and why, wired it to Aurora’s native topology discovery, tuned query routing and multiplexing against real workload patterns, tested HA under a live failover with a measured error count, and now have the monitoring queries and runbooks to operate it day-to-day.
Three things adjacent to this series worth exploring from here: the Aurora Performance Insights layer for correlating ProxySQL digest data with query execution inside the database engine itself; the ProxySQL Prometheus exporter for time-series dashboards that alert on ConnUsed headroom and detection gaps without manual polling; and slow query log parsing to match ProxySQL’s stats_mysql_query_digest patterns against Aurora’s slow log and identify the same queries from both sides of the proxy.
If you’re standing up ProxySQL in front of RDS or Aurora MySQL and want a second pair of eyes before production traffic, book a free assessment.
M
ReliaDB is a specialist DBA team for PostgreSQL and MySQL performance, high availability, and cloud database optimization. More about ReliaDB →
Planet for the MySQL Community
https://reliadb.com/images/og-default.png
Two API calls, same region, same lab session. Aurora writer failover: ProxySQL marked the writer SHUNNED at T0+8.7 seconds. Topology fully inverted at T0+15 seconds. Three errors across 2,020 queries through two ProxySQL nodes — the same order of magnitude as Part 2‘s 2-in-1,485 result from a single node. RDS Multi-AZ failover: 64 seconds from the same API trigger to AWS "completed." No ProxySQL topology change required, because there’s no topology to change — the standby isn’t readable, and the endpoint is DNS-based.
The 4× gap between 15 seconds and 64 seconds isn’t a sizing difference or an artifact of how the failover was triggered. It’s structural. Aurora’s ProxySQL integration reads INFORMATION_SCHEMA.REPLICA_HOST_STATUS directly, on its own polling schedule, independent of the AWS control plane. RDS Multi-AZ failover goes through DNS — and DNS propagation through resolver caches takes as long as it takes, regardless of what ProxySQL is doing.
Parts 1–3 built to this point: the placement decision, the Aurora wiring, and the query routing layer. This part is where the HA system is tested under pressure. ProxySQL Cluster sync timing and footguns, NLB health check reality versus the theoretical window, Aurora dual-node failover, RDS Multi-AZ as the baseline comparison, backend TLS with a footgun hiding in auto-discovery, and query mirroring’s measured latency impact. Everything here comes from a live AWS lab session.
Lab provenance: Tested live on Aurora MySQL 3.12.0 / MySQL 8.0.44 and RDS MySQL 8.0.40 (Multi-AZ), ProxySQL 2.7.3 in us-east-1 on 2026-05-09. All AWS resources destroyed post-capture. Estimated cost: ~$0.65.
The ProxySQL Cluster propagates configuration automatically between peers — it’s the mechanism that lets you apply a query rule change to one node and have it arrive on the other without a manual push. But the sync model has specific failure modes under fresh nodes and concurrent edits that are worth understanding before you rely on it during an incident.
Three variables control sync cadence: admin-cluster_check_interval_ms sets how often each node polls its peers for config checksums; admin-cluster_mysql_query_rules_diffs_before_sync (and the equivalent for mysql_servers, mysql_users, and global_variables) sets how many consecutive checksum differences must be detected before sync fires. With check_interval_ms=200 and diffs_before_sync=3, the minimum propagation window is 3 × 200ms = 600ms.
Lab measurements, inserting a new query rule on proxysql-1 and polling proxysql-2 for arrival:
| Config type | Measured latency | Notes |
|---|---|---|
mysql_query_rules |
614ms | |
mysql_servers |
620ms | |
global variable (mysql-monitor_ping_interval) |
597ms | |
mysql_users |
~600ms | see note |
The mysql_users row warrants a note. runtime_mysql_users stores every user twice — one frontend row (for client authentication against ProxySQL) and one backend row (for ProxySQL’s own authentication against MySQL backends). A correctness check expecting COUNT(*)=1 after sync would always fail, because the synced state is COUNT(*)=2. That’s the correct count, not a sync failure. Verify sync by comparing the count on the peer against the count on the source node — they should match.
Disk persistence works per-node. Each node writes its runtime state to its own sqlite3 database when SAVE ... TO DISK is called. Cluster sync operates at the runtime layer only — it doesn’t sync disk state between nodes. If proxysql-2’s sqlite3 is wiped and proxysql-2 restarts, it comes back with an empty config regardless of what proxysql-1’s disk contains.
admin-cluster_mysql_servers_sync_algorithm=1 is the right setting for steady-state operation. It propagates only deltas — the diff between the current table state and the last state recorded from each peer. Efficient, low-overhead, and correct under normal conditions.
The failure mode is specific: a fresh node that has never seen any state has no baseline. There are no deltas to compute against nothing. The sync mechanism produces nothing, and the fresh node stays empty indefinitely.
Lab result: wiped proxysql-2’s sqlite3 while keeping proxysql_servers intact so the cluster could still communicate. With algorithm=1, mysql_query_rules synced at 592ms — the cluster had tracked that table across prior sessions and had a baseline to diff against. mysql_servers never arrived on proxysql-2, even after 60+ seconds of polling. ProxySQL’s diff engine had no previous state to compare against for mysql_servers on the fresh node, so it computed no changes and pushed nothing.
Fix: set admin-cluster_mysql_servers_sync_algorithm=0 on both nodes and reload. Full-pull mode disregards the diff baseline and copies the complete table from the peer with the highest epoch. Proxysql-2 had a populated mysql_servers within 3 seconds. Once you verify runtime_mysql_servers is correct on the bootstrapped node, restore algorithm=1.
-- Tested: ProxySQL 2.7.3, Lima VMs, 2026-05-09
-- Temporary fix for bootstrapping a fresh or wiped node
SET admin-cluster_mysql_servers_sync_algorithm=0;
LOAD ADMIN VARIABLES TO RUNTIME;

-- After confirming the fresh node has synced (check runtime_mysql_servers):
SET admin-cluster_mysql_servers_sync_algorithm=1;
LOAD ADMIN VARIABLES TO RUNTIME;
SAVE ADMIN VARIABLES TO DISK;
algorithm=0 for initial bootstrap; algorithm=1 for steady-state. Not both at once, not neither.
The cluster’s conflict resolution model is last-epoch-wins: each config change increments the epoch counter on the node that made it, and peers adopt the config from whichever peer reports the highest epoch. For changes separated in time — the normal case — this works without issue.
What happens when two changes hit different nodes within the same check_interval window? Lab result: changed the same query rule row simultaneously on proxysql-1 (destination_hostgroup=10 at T0+50ms) and proxysql-2 (destination_hostgroup=20 at T0+102ms). Both changes fell inside a single 200ms polling cycle. After 5 seconds, neither node had adopted the other’s value. Config checksums had diverged and stayed diverged — proxysql-1 at 0x82176C666CE36C22, proxysql-2 at 0x23250DE02EC63EED.
The root issue: when both nodes increment their epochs within the same check cycle, neither sees the other as definitively higher before committing its own change. The split-brain persisted well past the "a few hundred milliseconds" convergence that the docs describe for normal propagation.
The operational fix is architectural, not a tuning parameter. Pick one ProxySQL node as the exclusive target for all config changes. Apply changes there, let cluster sync carry them to the peer, and confirm arrival before proceeding. Never write conflicting changes to both nodes simultaneously and rely on sync to reconcile the result.
An NLB in front of the ProxySQL pair routes around a failed node once its health checks reach the unhealthy_threshold. Standard configuration for this topology: TCP target group on port 6033, unhealthy_threshold=3, interval=30s. The theoretical detection window: 3 × 30s = 90 seconds.
The measured result was 110 seconds. The extra 20 seconds isn’t NLB slowness — it’s EC2 shutdown time. When an EC2 instance stops, there’s a graceful shutdown sequence before the OS releases the network stack and the TCP port becomes unreachable. The NLB’s health check timer starts only once connections are actively refused — it can’t detect "instance is shutting down," only "TCP connection failed." The additional 20-second gap between "shutdown initiated" and "connections refused" doesn’t shorten regardless of how you tune the health check thresholds.
Budget 110–120 seconds in your runbooks and alert thresholds, not 90. If your application has connect timeouts shorter than the actual detection window, you’ll see errors before the NLB reroutes. If they’re longer, the reroute happens first and the error disappears silently. The 110-second real-world number is the right one to design against.
Once the NLB marks a target unhealthy, all new TCP connections route to the surviving ProxySQL node. That node needs no configuration change — it already holds its share of backend connections and continues routing normally. Applications using connection pools with retry logic reconnect within one cycle. The surviving node handles the increased load without any config intervention.
| Scenario | ProxySQL detection | Full resolution | AWS “completed” event | Traffic errors |
|---|---|---|---|---|
| Aurora + dual ProxySQL | T0+8.7s (SHUNNED) | T0+15s (topology flip) | T0+22s | ~3 / 2,020 queries |
| RDS Multi-AZ (single ProxySQL HG) | n/a — DNS-based | T0+64s | T0+64s | not captured † |
† AWS event timestamps drive the RDS comparison. Per-second client error counts for the RDS leg require manual inspection of the raw traffic log — the automated analysis script did not extract them. The 64-second figure comes directly from AWS event timestamps and is the reliable number.
Aurora resolves approximately 4× faster — 15 seconds versus 64 seconds — and without touching DNS. ProxySQL reads INFORMATION_SCHEMA.REPLICA_HOST_STATUS directly and reroutes at the TCP connection level. There’s no resolver cache between ProxySQL and the Aurora instance endpoints.
The mysql_aws_aurora_hostgroups configuration adds a dedicated HG pair (200/201) for Aurora alongside the existing Lima MySQL hostgroups (HG 10/20). The key values and their constraints:
-- Tested: ProxySQL 2.7.3, Aurora MySQL 3.12.0 / MySQL 8.0.44, us-east-1, 2026-05-09
INSERT INTO mysql_aws_aurora_hostgroups (
  writer_hostgroup, reader_hostgroup, active,
  aurora_port, domain_name,
  max_lag_ms, check_interval_ms, check_timeout_ms,
  writer_is_also_reader, new_reader_weight,
  comment
) VALUES (
  200, 201, 1,
  3306, '.CLUSTER-EXAMPLE.us-east-1.rds.amazonaws.com',
  60000, 5000, 3000,
  1, 100,
  'part4-aurora'
);
Two values are worth flagging from experience. check_timeout_ms=3000 is the enforced upper bound — ProxySQL 2.7.3 has a CHECK constraint requiring 80 <= check_timeout_ms <= 3000. Exceeding it produces a silent failure: the INSERT returns success but the row isn’t accepted and the Aurora monitor thread never starts. If discovery isn’t happening, verify your check_timeout_ms first. Second: domain_name must start with a dot (.CLUSTER-EXAMPLE..., not CLUSTER-EXAMPLE...). The same constraint enforces this; INSERT without the leading dot fails with a constraint error.
After LOAD MYSQL SERVERS TO RUNTIME, the monitor thread polls the seed endpoint and auto-discovers the writer and reader within two polling cycles:
-- runtime_mysql_servers on proxysql-1 (~10s after LOAD TO RUNTIME)
hostgroup_id  hostname                                              port  status
200           mysql-ha-test-aurora-writer.CLUSTER-EXAMPLE...  3306  ONLINE
200           mysql-ha-test-aurora.cluster-CLUSTER-EXAMPLE... 3306  ONLINE  ← seed
201           mysql-ha-test-aurora-reader.CLUSTER-EXAMPLE...  3306  ONLINE
Both proxysql-1 and proxysql-2 show identical topology within seconds of configuration. The reason isn’t what you might expect.
CLUSTER SYNC ISN’T WHAT MAKES BOTH NODES CONVERGE. Both ProxySQL nodes reached identical Aurora topology at T0+15s. That looks like cluster sync working. It isn’t. Each ProxySQL node runs its own independent Aurora monitor thread that queries INFORMATION_SCHEMA.REPLICA_HOST_STATUS on its own polling schedule. Both threads read the same Aurora metadata — the same SESSION_ID=MASTER_SESSION_ID flip — and independently update their own runtime_mysql_servers. No config change was propagated between nodes during the failover. The convergence is emergent from two monitors reading the same source of truth, not from ProxySQL cluster propagation.
This matters in production: Aurora topology detection works correctly even when cluster sync is degraded or lagging behind. The Aurora monitor subsystem and the ProxySQL Cluster sync subsystem are orthogonal — they share no state and don’t depend on each other. Design your monitoring with that distinction in mind.
Triggered with a single AWS CLI command. T0 is the moment the API accepted the request:
# -- Trigger Aurora cross-AZ failover -- T0 = API accepted (15:32:07 CEST)
aws rds failover-db-cluster --db-cluster-identifier mysql-ha-test-aurora
Marker   Elapsed   Event
------   -------   -----
T0       +0.0s     failover-db-cluster API accepted
         +3.1s     Aurora: "Started cross AZ failover to aurora-reader"
         +8.7s     Writer endpoints SHUNNED on both proxysql-1 and proxysql-2
         +15.0s    Topology flip: aurora-reader → HG 200 ONLINE, old writer → HG 201
         +22.2s    Aurora: "Completed customer initiated failover to aurora-reader"
Two milestones, not one. ProxySQL marked the old writer SHUNNED at T0+8.7s — it knew the writer was unreachable. The full topology flip — old writer demoted to HG 201, new writer promoted to HG 200 — landed at T0+15s, on the next successful poll of REPLICA_HOST_STATUS after Aurora completed the internal promotion. SHUNNED means "I can’t reach this backend right now." The topology flip means "I’ve confirmed, from Aurora’s own metadata, who the new writer is." The gap between them is Aurora’s internal promotion time — the same floor discussed in Part 2’s detection math section. ProxySQL was polling on schedule throughout; the backends were simply unreachable while Aurora was mid-promotion.
The SHUNNED state explains why errors appeared at ~T0+6s, before SHUNNED was recorded at T0+8.7s. ProxySQL routes a query to a backend before detecting its failure — the SHUNNED state is set after a health check fails, not preemptively. Queries that attempted new handshakes in the window between when the writer became unreachable and when ProxySQL formally recorded it got the handshake failure directly.
Two load generators ran simultaneously — one through proxysql-1:6033, one through proxysql-2:6033 — at 5 SELECTs/second each throughout the failover window.
Proxysql-1: 1 error. Proxysql-2: 2 errors. All three were ERROR 2013 (HY000): Lost connection to server at 'handshake: reading initial communication packet' — new connection attempts during the SHUNNED window that hit an Aurora backend mid-promotion. Queries running on existing multiplexed backend connections continued without error. ProxySQL’s connection multiplexing kept those backend connections alive through the SHUNNED window; only new handshakes failed.
The comparison to Part 2: that run used a single ProxySQL node and recorded 2 errors in 1,485 queries (~0.13% error rate). This run used two nodes and recorded ~3 errors across 2,020 queries (~0.15% error rate). Adding a second ProxySQL node didn’t change the error ratio in any meaningful way. The bottleneck isn’t the proxy layer — it’s Aurora’s internal promotion window, which is identical regardless of how many ProxySQL nodes are in front of it.
The RDS Multi-AZ configuration in ProxySQL is simpler than Aurora’s: one hostgroup (HG 300), one server row, no topology discovery table. The endpoint DNS is the failover mechanism — after the standby promotes, the same DNS name resolves to the new primary. ProxySQL doesn’t need to change anything.
-- HG 300 for RDS Multi-AZ — single endpoint, no topology discovery needed
INSERT INTO mysql_servers (hostgroup_id, hostname, port, comment)
VALUES (
  300,
  'mysql-ha-test-rds-multiaz.CLUSTER-EXAMPLE.us-east-1.rds.amazonaws.com',
  3306,
  'rds-multiaz'
);
LOAD MYSQL SERVERS TO RUNTIME; SAVE MYSQL SERVERS TO DISK;
Failover triggered via reboot-db-instance --force-failover. T0 is the moment the API accepted:
Marker   Elapsed   Event
------   -------   -----
T0       +0s       reboot-db-instance --force-failover (15:37:16 CEST)
         +10s      AWS: "Multi-AZ failover started"
         +25s      AWS: "DB instance restarted"
         +64s      AWS: "Multi-AZ instance failover completed"
Post-failover, runtime_mysql_servers shows HG 300 ONLINE again with the same hostname and port. From ProxySQL’s perspective, the backend went unavailable and came back. No hostgroup changes, no topology flip, no epoch updates required.
Two limitations worth naming explicitly. First, the standby isn’t readable during normal operation. You pay for a full second instance — same CPU, memory, and storage class — and receive zero read capacity in return. ProxySQL can distribute reads across Aurora reader instances; it can’t read from an RDS Multi-AZ standby because Aurora’s architecture makes it deliberately inaccessible. Second, the 64-second resolution window goes through DNS — ProxySQL isn’t aware of the topology change until the DNS TTL expires and the endpoint resolves to the new primary. The 4× failover gap and the zero read capacity are the two concrete reasons to prefer Aurora when active read scaling and fast application-visible failover both matter.
Aurora MySQL 3 supports TLS and most clients negotiate it automatically — the default cipher from the Lima VMs was TLSv1.3 / TLS_AES_256_GCM_SHA384. But "supports by default" is not "enforces by default." In this lab cluster, require_secure_transport=OFF is the factory setting, and a connection opened with --ssl-mode=DISABLED succeeded with an empty Ssl_cipher. Enforcement requires require_secure_transport=ON set explicitly at the cluster parameter group level. Don’t assume Aurora encrypts backend connections without checking the parameter group.
Two ProxySQL settings control proxy-to-server TLS. mysql-have_ssl=true enables TLS capability on backend connections where TLS can be negotiated. mysql-ssl_p2s_ca provides the CA bundle ProxySQL uses to verify the server certificate. Together they give you encrypted, certificate-verified backend connections.
Aurora provides a CA bundle containing all AWS certificate authorities. Download it and copy it to the ProxySQL VM:
# Download the AWS RDS global CA bundle (162KB, 108 CAs as of May 2026)
curl -o /tmp/aurora-global-bundle.pem \
  https://truststore.pki.rds.amazonaws.com/global/global-bundle.pem

sudo mkdir -p /etc/proxysql/certs
sudo cp /tmp/aurora-global-bundle.pem /etc/proxysql/certs/
-- Configure backend TLS on proxysql-1 (cluster sync carries it to proxysql-2)
SET mysql-have_ssl=true;
SET mysql-ssl_p2s_ca='/etc/proxysql/certs/aurora-global-bundle.pem';
LOAD MYSQL VARIABLES TO RUNTIME;
SAVE MYSQL VARIABLES TO DISK;
Per-server TLS is also controlled by use_ssl in mysql_servers: setting use_ssl=1 on a row tells ProxySQL to use TLS for that specific backend. The interaction with Aurora’s auto-discovery is where it gets complicated — and where the footgun lives.
Direct-connection tests to Aurora to verify behavior before relying on ProxySQL config:
| Test | ssl-mode flag |
CA bundle | Result |
|---|---|---|---|
| Default TLS | none | none | TLSv1.3 / TLS_AES_256_GCM_SHA384 |
| TLS disabled | --ssl-mode=DISABLED |
none | Accepted — Ssl_cipher empty |
| VERIFY_CA — correct bundle | --ssl-mode=VERIFY_CA |
aurora-global-bundle.pem |
SUCCESS — TLSv1.3 |
| VERIFY_CA — wrong CA | --ssl-mode=VERIFY_CA |
system CAs (no AWS roots) | ERROR 2026: certificate verify failed |
AUTO-DISCOVERY DEFEATS PER-SERVER TLS SETTINGS — VERIFY IN runtime_mysql_servers. When mysql_aws_aurora_hostgroups is active, the Aurora monitor thread populates runtime_mysql_servers with rows for every discovered endpoint. Those auto-discovered rows are created with use_ssl=0, regardless of any use_ssl=1 you set in mysql_servers for manually-inserted entries.
Lab evidence: after UPDATE mysql_servers SET use_ssl=1 WHERE hostgroup_id IN (200,201); LOAD MYSQL SERVERS TO RUNTIME;, the static cluster endpoint seed kept use_ssl=1 in the runtime table. The auto-discovered reader and writer endpoints appeared with use_ssl=0. The Aurora monitor thread owns those rows and resets them on each discovery cycle.
The reliable enforcement path is mysql-have_ssl=true combined with mysql-ssl_p2s_ca. These are global defaults that apply to all backend connections capable of negotiating TLS, including auto-discovered endpoints. Per-server use_ssl is not the enforcement mechanism when Aurora auto-discovery is active. After any Aurora configuration change, verify with:
SELECT hostgroup_id, hostname, port, use_ssl
FROM runtime_mysql_servers
WHERE hostgroup_id IN (200, 201)
ORDER BY hostgroup_id, hostname;
A row showing use_ssl=0 on an auto-discovered endpoint isn’t unencrypted if mysql-have_ssl=true is set — it means TLS is negotiated via the global setting, not the per-server flag. But if mysql-have_ssl is false or unset, that same row is sending plaintext and won’t tell you.
The TLS footgun in auto-discovery is one of several configuration details that fail silently without surfacing an error. If you want a second pair of eyes on your ProxySQL configuration before it handles production Aurora failovers, book a free assessment call.
Query mirroring in ProxySQL routes each matched query to a secondary hostgroup simultaneously — fire-and-forget, results discarded, the calling application never knows. The mirror_hostgroup column in mysql_query_rules activates it per rule. This section is the latency measurement.
100 queries with mirroring active to a secondary hostgroup: 3,907ms total / 39ms average. 100 queries without mirroring: 4,081ms total / 40ms average. Delta: −174ms total, −1ms per query — within measurement noise and not a meaningful latency penalty.
ProxySQL sends mirrored queries from a separate goroutine. The primary query’s result is returned to the client immediately; the mirror is dispatched independently with no serialization point on the primary path. If the mirror hostgroup is unavailable, the primary path is unaffected. Enabling mirroring to a staging Aurora cluster or a new version under evaluation doesn’t require a performance conversation with your application team. The only cost is backend resources on the mirror target itself.
Three topics are deferred to Part 5 by design:
stats_mysql_query_digest for latency baselines, alerting on Aurora detection gaps via mysql_server_aws_aurora_log, and dashboards for connection pool headroom → Part 5check_interval_ms production sizing — this part used check_interval_ms=5000; Part 5 covers sizing it based on observed Aurora promotion time from your own event history → Part 5In Part 5, the system from Parts 1–4 is running and has been through a failover. Part 5 is about knowing it’s healthy: stats_mysql_query_digest for query latency baselining, mysql_server_aws_aurora_log for Aurora detection gap alerting, max_lag_ms tuning for excluding lagging readers under replication pressure, the rolling ProxySQL upgrade sequence, and the production-sizing decisions for check_interval_ms and multiplexing variables that weren’t worth making until the system had been under load.
M
ReliaDB is a specialist DBA team for PostgreSQL and MySQL performance, high availability, and cloud database optimization. More about ReliaDB →
Planet for the MySQL Community
https://reliadb.com/images/og-default.png
The Aurora cluster from Part 2 is torn down. Its lesson — 2 errors in 1,485 queries across a live failover — cost $0.15 and is documented. Part 3 is back to the Lima lab: the dbdeployer sandbox on mysql-backends (master on port 25001, two replicas on 25002 and 25003), ProxySQL 2.7.3 on proxysql-1 and proxysql-2, backends in HG 10 (writer) and HG 20 (readers) exactly as Part 1 left them.
The query routing and connection multiplexing mechanics covered here don’t depend on Aurora’s topology discovery — they work identically whether the backends are Aurora reader instances or vanilla MySQL replicas. Every rule and variable in this part carries forward unchanged when you point the same ProxySQL instance at an Aurora cluster. ProxySQL doesn’t know which kind of MySQL is behind it. The rule evaluation engine doesn’t either.
Part 2 confirmed that routing survives a failover and that ProxySQL detects topology changes before Aurora’s own control plane announces them. Part 3 asks what happens to the SQL once it arrives at the proxy: how does it get routed, how can it be rewritten, and what determines whether that backend connection can be shared with the next client or must stay pinned to this one?
-- Tested on Lima VMs, MySQL 8.0.41 via dbdeployer, ProxySQL 2.7.3, 2026-05-09
mysql_query_rules is a SQLite-backed table with around 30 columns. Six of them drive the vast majority of production configurations.
rule_id is the evaluation priority. ProxySQL sorts the full active rule set by rule_id ascending at LOAD MYSQL QUERY RULES TO RUNTIME. There’s no concept of insertion order — only the number matters. A rule at rule_id=1 evaluates before one at rule_id=100, always.
active is a 0/1 gate. An inactive rule exists in the MEMORY layer but is invisible at RUNTIME. This makes it the right tool for staging a rule before you commit to it — insert with active=0, inspect via SELECT ... FROM mysql_query_rules, flip to active=1 and LOAD when ready.
match_pattern and match_digest are two independent matching surfaces. match_pattern runs a regex against the raw query text as received from the client, case-insensitive by default. match_digest runs a regex against the normalized digest — the version of the query where all literals have been replaced with ? and whitespace normalized, the same form you see in stats_mysql_query_digest. A rule can specify both; both must match for the rule to fire. They serve different purposes: match_pattern handles structural rewrites and locking reads; match_digest targets known query shapes by their normalized form.
destination_hostgroup is where the matched query goes. Setting it to NULL means "don’t change the hostgroup for this query, but continue to the next rule" — useful for applying a side effect like flagOUT without overriding routing.
apply is the short-circuit switch. apply=1 stops rule evaluation the moment the rule fires: route the query, done. apply=0 fires the rule’s other effects (hostgroup override, flagOUT marker, replace_pattern) but continues evaluating. Every terminal routing rule should have apply=1. The only reason to use apply=0 is to build a multi-stage chain with flagIN/flagOUT.
replace_pattern rewrites the query before it reaches the backend. It requires match_pattern — there’s a CHECK constraint enforcing this. Section 5 covers rewriting in detail.
multiplex controls whether matching this rule affects the session’s multiplexing state: 0 disables multiplexing for the session, 1 forces it on (overriding session state that would normally pin the connection), 2 leaves the state unchanged (the default).
The evaluation flow looks like this:
mysql_query_rules evaluation flow
──────────────────────────────────────────────────────────────
  Incoming query from frontend
        │
        ▼
  Sort active rules by rule_id ASC  (done at LOAD TO RUNTIME)
        │
        ▼
  Rule N: does query match? (username, schemaname, match_pattern, match_digest)
   ├── NO  → advance to rule N+1
   └── YES → apply destination_hostgroup + replace_pattern + multiplex
               │
               ├── apply=1 → STOP. Send query. Evaluation ends here.
               │
               └── apply=0 → continue to rule N+1
                             (flagOUT may set a chain marker for later rules)
        │
        ▼
  No matching rule → route to user's default_hostgroup
──────────────────────────────────────────────────────────────
In practice, a standard read/write split is two rules:
-- mysql_query_rules: minimal read/write split
-- rule_id 1 must be lower than 2 — specific before greedy (see Section 3)
INSERT INTO mysql_query_rules (rule_id, active, match_pattern, destination_hostgroup, apply)
VALUES
  (1, 1, '^SELECT.*FOR UPDATE$', 10, 1),  -- locking reads → writer HG 10
  (2, 1, '^SELECT',              20, 1);  -- all other SELECTs → readers HG 20

LOAD MYSQL QUERY RULES TO RUNTIME;
SAVE MYSQL QUERY RULES TO DISK;
Changes in MEMORY are invisible at RUNTIME until explicitly promoted. Always verify the active rule set via SELECT ... FROM runtime_mysql_query_rules before promoting to production traffic.
This is what your application sees when query rule order is wrong:
-- client output through proxysql-1:6033 (wrong-order rules active)
ERROR 1290 (HY000): The MySQL server is running with the --super-read-only option
                    so it cannot execute this statement
That error came from SELECT * FROM t1 WHERE id=1 FOR UPDATE — a locking read that should have gone to the writer. It didn’t. It landed on a replica. The replica rejected it with super-read-only. In production, that error surfaces as an application exception mid-transaction.
Here’s the rule configuration that produced it:
-- runtime_mysql_query_rules on proxysql-1 (WRONG ORDER — rule_id=10 fires before 11)
rule_id  active  match_pattern          destination_hostgroup  apply
10       1       ^SELECT                20                     1   ← greedy, fires first
11       1       ^SELECT.*FOR UPDATE    10                     1   ← specific, never reached
ProxySQL evaluates by rule_id ascending. Rule 10 fires first. SELECT * FROM t1 WHERE id=1 FOR UPDATE starts with SELECT, so it matches rule 10 immediately — routed to HG 20, a replica. Rule 11 never evaluates. The ^SELECT.*FOR UPDATE pattern exists in the table but is effectively dead.
stats_mysql_query_digest is the confirmation:
-- stats_mysql_query_digest: SELECT FOR UPDATE routed to HG 20 (replica) — pre-fix
hostgroup  digest_text                                     count_star
20         SELECT * FROM t1 WHERE id=? FOR UPDATE         1
Hostgroup 20 is a replica. This locking read should be in hostgroup 10. The fix is to swap the rule_id values so the specific pattern evaluates first:
-- runtime_mysql_query_rules on proxysql-1 (CORRECT ORDER)
rule_id  active  match_pattern          destination_hostgroup  apply
10       1       ^SELECT.*FOR UPDATE    10                     1   ← specific, fires first
11       1       ^SELECT                20                     1   ← greedy, catches the rest
After the fix, the same query lands correctly:
-- stats_mysql_query_digest: SELECT FOR UPDATE on HG 10 (master) — post-fix
hostgroup  digest_text                                     count_star
10         SELECT * FROM t1 WHERE id=? FOR UPDATE         1
The rule to internalize: always order specific patterns before greedy ones. rule_id=10 evaluates before rule_id=11 because ProxySQL sorts by rule_id at load time — the number is the priority, full stop. The same ordering principle governs rewrite rules, which we’ll hit again in Section 5.
match_pattern and match_digest aren’t the only dimensions. Rules can also filter on the connecting user, the current schema, or both — and default_hostgroup on the user itself routes traffic without any rule at all. These three routing contexts compose: a rule can require a matching user AND schema AND digest, and it’s still evaluated in rule_id order like any other rule.
User-level routing requires no query rules. mysql_users.default_hostgroup is the destination when no rule matches, and transaction_persistent controls whether that assignment sticks for the duration of an open transaction.
In the lab, the app user has default_hostgroup=10 and transaction_persistent=1 — it follows query rules for routing and holds hostgroup affinity through open transactions. The analytics user has default_hostgroup=20 and transaction_persistent=0:
-- mysql_users: per-user routing configuration
username   default_hostgroup  transaction_persistent
app        10                 1
analytics  20                 0
The same SELECT @@hostname, @@port from two users returns different backends:
-- stats_mysql_query_digest: per-user routing proof
hostgroup  username   digest_text               count_star
20         analytics  SELECT @@hostname,@@port  1
20         app        SELECT @@hostname,@@port  1
10         app        INSERT INTO t1(val)...    1
10         app        DELETE FROM t1 WHERE...   1
analytics routes to HG 20 for every query — no rules needed, no rules to mis-order. The app user’s writes land on HG 10 via a write-routing rule. The primary use case for per-user routing is exactly this: analytics or reporting accounts that must never touch the writer get a default_hostgroup pointing at a dedicated reader and transaction_persistent=0. The routing enforcement lives in one row of mysql_users, not in application code.
The schemaname column in mysql_query_rules scopes a rule to a specific database. Queries issued against any other schema skip the rule entirely.
-- runtime_mysql_query_rules: schemaname filter
rule_id  active  schemaname    match_pattern  destination_hostgroup  apply
3        1       analytics_db  NULL           20                     1
This rule has no match_pattern. It fires on any query issued against analytics_db, regardless of statement type, and routes it to HG 20. An app user connecting to analytics_db goes to a replica. The same user connecting to lab_test follows the normal pattern rules. One row in mysql_query_rules separates two traffic streams at the schema boundary, without touching application code or the database schema itself.
The production pattern: a dedicated analytics database pinned to a read-only replica, a transactional database following the standard write/read split. Multi-tenant deployments use the same mechanism to keep per-tenant schemas on specific infrastructure without changes to application routing logic.
match_digest targets the normalized query shape — literals replaced with ?, whitespace normalized — rather than the raw text. This makes it more stable than match_pattern for ORMs that emit structurally identical queries with different parameter values: the normalized form is the same regardless of which user ID or date range the ORM substituted in.
The most common production use case for match_digest is not what you’d expect. It isn’t routing by query type — pattern rules handle that cleanly. It’s quarantine: pinning a known-heavy or known-problematic digest to a specific hostgroup until you can fix the underlying issue.
Imagine a reporting tool that just discovered the replicas and is now hammering them with a specific aggregation pattern that’s slowing OLTP reads. Or an ORM-generated query causing replication lag while the application team works on a fix. Or a compliance query that needs writer-fresh data but was accidentally configured to read from a replica. match_digest handles all three cases: find the offending pattern in stats_mysql_query_digest, copy the digest_text, escape the regex metacharacters, drop it into a match_digest rule with the target hostgroup. The rule fires on that normalized shape regardless of parameter values and leaves everything else untouched.
-- runtime_mysql_query_rules: match_digest quarantine rule
rule_id  active  match_digest                   destination_hostgroup  apply
8        1       ^SELECT COUNT\(\*\) FROM        10                     1
-- stats_mysql_query_digest: digest-matched routing proof
hostgroup  digest                digest_text                           count_star
10         0xB154770BDBDAC823    SELECT COUNT(*) FROM t1              1
10         0xF676D3098284E26A    SELECT COUNT(*) FROM t1 WHERE id>?   1
Both queries, different parameter sets, same normalized shape — both redirected by one rule. stats_mysql_query_digest is the authoritative source for the right pattern: run the offending query through ProxySQL, read the digest_text, and that’s what goes into match_digest.
ProxySQL can rewrite a query before it reaches MySQL. The replace_pattern column substitutes a new query text whenever match_pattern fires. The backend sees the rewritten form; the client receives results from the rewritten query, not the original.
Rewriting is a surgical tool, not a first resort. Before using it, ask whether the application can be fixed instead. A rewritten query is invisible to developers running the statement in isolation — the behavior they see in a MySQL client won’t match what the application gets through the proxy, and the discrepancy is silent. It’s a maintenance burden that compounds over time.
With that caveat stated, the textbook case is fully demonstrable. The big_table table in the lab has 1,000 rows. An unbounded SELECT * against it would return all of them. A rewrite rule intercepts it first:
-- mysql_query_rules: inject LIMIT 100 on unbounded table scan
-- rule_id=4 must come before the greedy ^SELECT rule at rule_id=11
INSERT INTO mysql_query_rules (
  rule_id, active, match_pattern, replace_pattern,
  destination_hostgroup, apply
) VALUES (
  4, 1,
  '^SELECT \* FROM big_table$',
  'SELECT * FROM big_table LIMIT 100',
  20, 1
);
Through the proxy, the client receives exactly 100 rows. The backend received SELECT * FROM big_table LIMIT 100. stats_mysql_query_digest is the proof:
-- stats_mysql_query_digest: rewrite proof — unbounded form absent, only LIMIT ? present
hostgroup  digest_text                          count_star
20         SELECT * FROM big_table LIMIT ?      1
There is no entry for SELECT * FROM big_table without the LIMIT. Because ProxySQL rewrote the query before forwarding it, the unbounded form never reached MySQL — and ProxySQL only records queries after the rewrite. That absence in the digest is the clearest confirmation the intercept happened at the proxy and not on the backend.
Rewriting and routing share the same priority pecking order. A rewrite rule placed after a greedy ^SELECT never fires — we hit this in the lab when we initially inserted the rewrite at rule_id=15. The catch-all ^SELECT at rule_id=11 matched first and forwarded the original unbounded query. The digest showed the unrewritten form still reaching the backend. Moving the rule to rule_id=4, ahead of the catch-all, fixed it immediately. The section ordering bug from Section 3 isn’t unique to routing rules — it bites rewrite rules in exactly the same way.
Two additional production warnings. First, replace_pattern only works with match_pattern, never with match_digest — a CHECK constraint enforces this. Second, treat the comment column as a required field for rewrite rules: document what the rule does, why it exists, and when it can be removed. Schema migrations and ORM upgrades routinely invalidate rewrites that made sense at the time, and a comment is the only in-band record of intent.
After a query completes, ProxySQL decides whether the backend connection that served it can go back into the free pool for other frontends to use, or whether it must stay assigned to this specific frontend. That decision is the multiplexing check.
If the session is clean — no active transaction, no user-defined variables, no temporary tables, no advisory locks — the backend connection is released. The frontend stays connected to ProxySQL; the backend is free. The next query from this frontend may land on any available connection in the pool. From the backend’s perspective, many client sessions arrive as a much smaller number of MySQL threads.
The numbers from the lab make this concrete. One hundred Python threads each connect to proxysql-1, run SELECT 1, and then hold the frontend connection open but idle for 45 seconds. During that idle window:
-- stats_mysql_connection_pool on proxysql-1 (T0+10s, 100 idle frontends, no session state)
-- ProxySQL 2.7.3 / MySQL 8.0.41 / Lima lab / 2026-05-09
hostgroup  srv_host       srv_port  ConnUsed  ConnFree
10         192.168.105.6  25001     0         100
20         192.168.105.6  25002     0          42
20         192.168.105.6  25003     0          61
ConnFree vs client count: In stats_mysql_connection_pool, ConnFree is how many idle connections ProxySQL holds in its pool toward that backend row (bounded by max_connections and how many connections the proxy has opened). It is not the number of frontend sessions. ConnUsed is how many pooled backend connections are in use or pinned for session state. With strong multiplexing you expect ConnUsed=0 under idle clients while ConnFree can still read high — that is spare capacity on the proxy–MySQL leg, not a 1:1 mapping to application threads.
ConnUsed is zero across all three backends. One hundred frontend sessions are open. Zero backend connections are pinned to any of them. After SELECT 1 completed, ProxySQL returned all 100 backend connections to the free pool. The frontends are still connected — they just don’t hold a reserved MySQL thread on the other side.
MULTIPLEXING ON, MULTIPLEXING OFF: 100 idle frontend connections held against ProxySQL → 0 backend connections held against MySQL. Add one SET @user_var = 1 per session and the same workload pins 100 backend connections — one per frontend. Multiplexing is the default; user-defined variables turn it off.
The four pinning patterns below — user-defined variable, explicit transaction, temporary table, advisory lock — all collapse to the same 100/100 outcome. They are four doors to the same broken state.
Multiplexing state — five scenarios (proxysql-1, HG 10, T0+10s after 100 connections)
────────────────────────────────────────────────────────────────────────────────────────
Scenario                              Frontend  HG10 ConnUsed  Multiplexing
────────────────────────────────────────────────────────────────────────────────────────
Baseline: SELECT 1, no session state  100       0              ✓ Active
SET @user_var = idx                   100       100            ✗ Pinned
BEGIN (explicit transaction)          100       100            ✗ Pinned
CREATE TEMPORARY TABLE tmp (id INT)   100       100            ✗ Pinned
SELECT GET_LOCK('mylock_N', 0)        100       100            ✗ Pinned
────────────────────────────────────────────────────────────────────────────────────────
MySQL 8.0.41 / ProxySQL 2.7.3 / Lima lab / 2026-05-09
Each pattern pins for a different structural reason.
User-defined variables (SET @user_var = value) create session-scoped state in MySQL’s UDV store on that specific backend connection. ProxySQL cannot replay a UDV on a different connection — the variable name and value are opaque to it, unlike tracked session attributes. The backend connection must stay assigned to this frontend so that subsequent queries can read the variable back.
Explicit transactions (BEGIN or START TRANSACTION) bind an in-progress transaction’s undo log to one backend connection. Moving an open transaction to a different backend mid-flight is impossible — you’d need to replay every statement from the beginning, and the new backend’s state wouldn’t match. ProxySQL holds the connection until COMMIT or ROLLBACK arrives.
Temporary tables exist in MySQL’s in-memory storage, scoped to the connection that created them. Returning the backend to the pool destroys the table. ProxySQL pins the connection for the session’s lifetime.
Advisory locks (GET_LOCK()) are connection-scoped named locks in MySQL. Returning the backend to the pool silently releases the lock, breaking any application-level serialization that depends on it. ProxySQL holds the connection until the lock is explicitly released.
A fifth lever is mysql_users.transaction_persistent. Setting it to 1 (the default) pins all queries in a detected transaction to the same hostgroup — not the same backend connection. This is hostgroup affinity, not multiplexing: it ensures reads during an open transaction stay on the writer rather than jumping to a replica, but it doesn’t prevent ProxySQL from handing different backend connections within HG 10 to successive queries in the transaction. Setting it to 0 allows per-query routing even inside a transaction, which is useful for analytics users that never hold open transactions but risky for application users that do.
Connection pool behavior through ProxySQL changes in specific, identifiable ways. If your backend thread count is tracking 1:1 with your frontend connection pool and you can’t find why, a 30-minute assessment call usually surfaces the culprit.
Despite what older guides say, your HikariCP defaults are probably not breaking multiplexing in modern ProxySQL. The thing actually hurting you is somewhere else — and your audit middleware probably put it there.
When HikariCP acquires a connection from the pool, it runs an initialization sequence before handing the connection to application code. The sequence looks like this:
-- HikariCP standard initialization sequence (per connection acquisition)
SET autocommit=1;
SET sql_mode='STRICT_TRANS_TABLES';
SET time_zone='+00:00';
SET SESSION TRANSACTION ISOLATION LEVEL READ COMMITTED;
SELECT 1;  -- HikariCP validation query
In the lab, 50 Python threads each issue exactly this sequence, run three SELECT COUNT(*) queries, then hold the connection idle for 45 seconds. The pool state during that idle window:
-- stats_mysql_connection_pool on proxysql-1 (T0+10s, 50 frontends, standard HikariCP SETs)
hostgroup  srv_host       srv_port  ConnUsed  ConnFree
10         192.168.105.6  25001     0         100
Fifty frontend connections are open, yet ConnFree on HG 10 can read 100: same meaning as above — ConnFree reflects idle slots in ProxySQL’s writer pool, not “twice the client count.” The signal that multiplexing is healthy here is ConnUsed=0 with traffic not pinned.
ConnUsed is zero. Fifty frontend connections are open. Zero backend connections are pinned. The standard HikariCP initialization sequence does not break multiplexing in ProxySQL 2.7.3.
The reason: ProxySQL tracks the values of these session attributes — sql_mode, time_zone, transaction isolation level, autocommit — and can replay them transparently when handing a backend connection to a new frontend session. The SET statement itself doesn’t pin the connection; the value is portable across backend connections. ProxySQL reads the current value after each SET, remembers it on the connection object, and re-applies it when that connection gets reused by a different frontend. From the backend’s point of view, the session state is consistent. From the application’s point of view, the connection behaves as initialized.
One important precision here. The SET statements are replayable because they only express a configuration intent, not a stateful operation. The moment a transaction actually opens — started by BEGIN, or by any DML statement after SET autocommit=0 — the situation changes entirely. An in-flight transaction’s state cannot be migrated to a different backend mid-flight. So SET autocommit=0 issued in isolation is replayable; SET autocommit=0 followed by INSERT INTO orders ... pins, because that INSERT opened an implicit transaction on a specific backend whose undo log now holds the pending write. The HikariCP default is autocommit=1 — which means individual statements autocommit and no implicit transactions accumulate. That’s precisely why the standard HikariCP sequence is safe.
Add one line to the same initialization sequence and the picture changes immediately:
-- HikariCP sequence + one UDV line (common Spring/audit middleware pattern)
SET autocommit=1;
SET sql_mode='STRICT_TRANS_TABLES';
SET time_zone='+00:00';
SET SESSION TRANSACTION ISOLATION LEVEL READ COMMITTED;
SET @app_request_id = 'req-47-1746741602';  -- ← this line
SELECT 1;
Same 50-connection workload. Same idle period. Pool state during the idle window:
-- stats_mysql_connection_pool on proxysql-1 (T0+10s, 50 frontends, HikariCP + UDV)
hostgroup  srv_host       srv_port  ConnUsed  ConnFree
10         192.168.105.6  25001     50        50
ConnUsed is 50. One backend connection per frontend, held for the duration of the session. The UDV is the pin.
User-defined variables are opaque to ProxySQL. It can’t know what @app_request_id holds or whether the application will read it back later. It has no choice but to keep the backend connection attached to that frontend until the session ends — because if it released the connection and the application issued SELECT @app_request_id next, the query might land on a backend that never saw the SET, and would return NULL with no error. Silent data loss.
Where UDVs appear in real codebases:
@ variables by a MyBatis plugin for access inside SQL maps that reference @variable_name directly.SET @debug_user = ? line added during an incident three years ago, never removed from the connection initialization hook, now running on every connection in every environment.Three options, in order of preference.
App-level (the correct fix). Audit your HikariCP initSQL and every connection interceptor. For each SET @ statement, answer: does the application read this variable back in a subsequent query? If not, remove it. Most UDVs in connection init hooks are vestigial — they were added for a debug session, never cleaned up, and have been multiplexing-pinning every connection in production ever since. Removing them takes minutes and has no application-visible effect.
ProxySQL-level (secondary, with an explicit caveat). Add a query rule targeting the UDV pattern with multiplex=1:
-- mysql_query_rules: multiplex=1 mitigation for write-only UDV
-- SAFE ONLY IF the application does not read back @app_request_id in the same session
INSERT INTO mysql_query_rules (
  rule_id, active, match_pattern, destination_hostgroup, multiplex, apply, comment
) VALUES (
  1, 1, '^SET @app_request_id', 10, 1, 1,
  'UDV is write-only (tracing); force multiplex=1 — do not use if app reads this var back'
);
LOAD MYSQL QUERY RULES TO RUNTIME;
SAVE MYSQL QUERY RULES TO DISK;
multiplex=1 tells ProxySQL: process this SET, but do not disable multiplexing for the session. With this rule active, ConnUsed drops back to zero — same 50 frontends, same UDV, same workload, multiplexing restored.
The caveat is real and must be stated clearly: this mitigation works only when the UDV is write-only. If the application later issues SELECT @app_request_id in the same session, ProxySQL may route that query to a backend that never received the SET. The result is NULL. There is no error, no log entry, no visible failure — just a missing value. If your tracing middleware writes @app_request_id on every connection and never reads it back, this rule is safe. If anything in the request path reads it, the app-level fix is the only correct answer.
User-level. Set transaction_persistent=0 for service accounts that don’t hold open transactions. This doesn’t eliminate UDV pinning, but it narrows the blast radius — the pinned connection stays on one backend rather than holding hostgroup affinity across an entire transaction.
Three topics are deferred intentionally.
Query mirroring — cloning live traffic to a secondary hostgroup for validation under real load, without affecting the critical path or modifying application code. It pairs naturally with Part 4’s HA validation story, where we use mirroring to test the second ProxySQL node under the same query patterns the first node is serving.
stats_mysql_query_digest as an operational tool — slow query identification by digest, per-user query profiling, alerting on rewritten-query rate spikes, and using digest data to drive index decisions. Part 5 covers this in depth alongside the full monitoring stack.
mysql-monitor_* global variable tuning — check_interval_ms, connect_timeout_ms, ping_interval_server_ms, and how to size them against observed Aurora promotion times vs. vanilla replication lag characteristics. Also Part 5.
TLS on backend connections — encrypting the ProxySQL → MySQL leg for in-transit data protection. Part 4.
In Part 4, we wire the ProxySQL Cluster sync layer. Every query rule, user definition, and hostgroup configuration in this part lives on proxysql-1. Part 4 demonstrates how the cluster propagates them to proxysql-2 automatically — and what failure modes exist when it doesn’t. We also add TLS on the backend connections, test the full two-node HA stack under a live Aurora promotion, and work through the NLB health-check configuration that determines which ProxySQL node receives traffic after a cluster event. Everything built in Part 3 becomes the baseline that Part 4 puts under pressure.
M
ReliaDB is a specialist DBA team for PostgreSQL and MySQL performance, high availability, and cloud database optimization. More about ReliaDB →
Planet for the MySQL Community
https://reliadb.com/images/og-default.png
Two errors in 1,485 queries. Both within a 0.1-second window. Then clean traffic again — and the topology had silently changed underneath. That’s the result we recorded running a live failover against a real Aurora MySQL cluster with ProxySQL in front of it. The baseline without ProxySQL, using the Aurora reader endpoint alone: roughly 60 seconds of mixed timeouts, stale reads, and connection pool churn.
Part 1 was architecture — where to place ProxySQL, why you’d bother, how the dedicated cluster pair pattern works. Part 2 is the first set of commands. Everything from Part 1 stays the same: the two-node ProxySQL Cluster on Lima VMs, ProxySQL 2.7.3, the same lab infrastructure. What changes is the backends. We swap the three-node MySQL sandbox for a real Aurora MySQL 3.x cluster, and we configure mysql_aws_aurora_hostgroups — the table that replaces mysql_replication_hostgroups for Aurora-native topology discovery.
Standard replication hostgroups poll read_only to determine which backend is the writer. Aurora readers do have read_only=ON, so you might expect that mechanism to just work. It mostly does — until it doesn’t, and the ways it fails are specific to Aurora’s promotion model.
The first failure mode is a race condition during failover. When Aurora promotes a reader to writer, there’s a brief window where the promoted instance has read_only=OFF (it’s the new writer) but the old writer’s read_only=ON update hasn’t fully propagated yet. If ProxySQL polls in that window, it can see two read_only=OFF instances simultaneously and flip both into the writer hostgroup — or flip and immediately flip back when the old writer’s state catches up. This "flapping" is a documented race condition that mysql_aws_aurora_hostgroups avoids by reading SESSION_ID rather than read_only. We didn’t trigger this race in the lab, but avoiding it is precisely why mysql_aws_aurora_hostgroups exists in the first place — the table was added to ProxySQL specifically because read_only polling can’t be made reliable on Aurora’s failover model.
The second failure mode is replica lag visibility. Aurora tracks replica lag in INFORMATION_SCHEMA.REPLICA_HOST_STATUS as replica_lag_in_milliseconds. Standard replication hostgroups read lag from SHOW SLAVE STATUS (or SHOW REPLICA STATUS on 8.0+), which on Aurora returns data that doesn’t reflect Aurora’s actual internal replication lag. mysql_aws_aurora_hostgroups reads directly from REPLICA_HOST_STATUS, so lag values are accurate and can drive the max_lag_ms threshold that excludes lagging replicas from the reader hostgroup.
The third failure mode is custom endpoint handling. Aurora custom endpoints — commonly used for analytics replicas — can appear with is_current=0 in REPLICA_HOST_STATUS when they’re not receiving writes or are otherwise isolated from the replication stream. mysql_replication_hostgroups has no mechanism to filter on that field and will route reads to those instances regardless. mysql_aws_aurora_hostgroups accounts for this during discovery.
The mechanism that solves all three is the same: mysql_aws_aurora_hostgroups queries REPLICA_HOST_STATUS directly, identifies the writer by SESSION_ID=MASTER_SESSION_ID, and populates writer and reader hostgroups from that ground truth — not from read_only. There’s no read_only poll, no race window, and no dependency on MySQL replication status tables that Aurora doesn’t maintain in the standard way.
Key columns you’ll configure in the next section:
domain_name — a suffix that all backends in this cluster share. Must start with a dot. ProxySQL enforces this with a CHECK constraint; without the leading dot the INSERT fails.writer_hostgroup / reader_hostgroup — which HG numbers receive the writer and readers after each poll cycle.check_interval_ms — how often ProxySQL polls REPLICA_HOST_STATUS on each backend.writer_is_also_reader — whether the writer instance also appears in the reader hostgroup. Accepts 0 or 1 only in ProxySQL 2.7.3 — more on this below.max_lag_ms — replicas lagging beyond this threshold are excluded from the reader hostgroup until lag recovers.Smallest viable lab cluster: one writer, one reader, db.t4g.medium instances, Aurora MySQL 3.12.0 (MySQL 8.0.44 wire protocol), us-east-1. The cluster ran in a default VPC with --publicly-accessible set on each instance so the Lima VM host could reach Aurora directly over the host machine’s public IP. The security group was locked to that single /32. In production, Aurora lives inside a VPC with no public access — this configuration exists only so the Lima VMs could connect without a VPN or bastion.
Lab provenance: Tested live on Aurora MySQL 3.12.0 / MySQL 8.0.44 in us-east-1 on 2026-05-08. Cluster destroyed post-capture. Estimated cost: $0.15.
Two CLI commands provision the cluster, followed by one per instance:
# -- create-db-cluster
# Note: --publicly-accessible is an instance-level flag for aurora-mysql,
# not a cluster-level flag. Passing it here returns InvalidParameterCombination.
aws rds create-db-cluster \
  --db-cluster-identifier proxysql-aurora-EXAMPLE \
  --engine aurora-mysql \
  --engine-version 8.0.mysql_aurora.3.12.0 \
  --master-username admin \
  --master-user-password "<password>" \
  --db-subnet-group-name <subnet-group> \
  --vpc-security-group-ids <sg-id>

# -- create writer instance (--publicly-accessible goes here, not on create-db-cluster)
aws rds create-db-instance \
  --db-instance-identifier proxysql-aurora-EXAMPLE-writer \
  --db-cluster-identifier proxysql-aurora-EXAMPLE \
  --db-instance-class db.t4g.medium \
  --engine aurora-mysql \
  --publicly-accessible

# -- create reader instance
aws rds create-db-instance \
  --db-instance-identifier proxysql-aurora-EXAMPLE-reader \
  --db-cluster-identifier proxysql-aurora-EXAMPLE \
  --db-instance-class db.t4g.medium \
  --engine aurora-mysql \
  --publicly-accessible
Once both instances are available, the topology ProxySQL will discover looks like this:
             ┌──────────────────────────────────────┐
             │    proxysql-1 / proxysql-2           │
             │    ProxySQL 2.7.3 Cluster            │
             │    HG 100: writer                    │
             │    HG 101: reader                    │
             └────────────────┬─────────────────────┘
                              │
         domain_name match: .EXAMPLE-SUFFIX.us-east-1.rds.amazonaws.com
         ProxySQL polls REPLICA_HOST_STATUS every check_interval_ms
                              │
          ┌───────────────────▼──────────────────────────────────────┐
          │            Aurora MySQL 3.12.0 Cluster                   │
          │  proxysql-aurora-EXAMPLE.cluster-EXAMPLE-SUFFIX...       │
          ├─────────────────────────┬────────────────────────────────┤
          │ WRITER → HG 100         │ READER → HG 101                │
          │ …-writer.EXAMPLE-SUFFIX │ …-reader.EXAMPLE-SUFFIX        │
          │ SESSION_ID =            │ lag_ms = 0                     │
          │   MASTER_SESSION_ID     │                                │
          └─────────────────────────┴────────────────────────────────┘
Three tables to configure, in order: mysql_aws_aurora_hostgroups, mysql_servers, mysql_users. Each needs a LOAD ... TO RUNTIME and SAVE ... TO DISK after its changes. That’s the complete wiring.
-- mysql_aws_aurora_hostgroups: one row tells ProxySQL how to discover this Aurora cluster
INSERT INTO mysql_aws_aurora_hostgroups (
  writer_hostgroup, reader_hostgroup, active,
  aurora_port, domain_name,
  max_lag_ms, check_interval_ms, check_timeout_ms,
  writer_is_also_reader, new_reader_weight,
  comment
) VALUES (
  100, 101, 1,
  3306, '.EXAMPLE-SUFFIX.us-east-1.rds.amazonaws.com',
  600000, 2000, 800,
  0, 1,
  'part2 Aurora cluster'
);
Walking each column:
writer_hostgroup=100, reader_hostgroup=101 — HG numbers for this Aurora cluster. These must not overlap with the Lima MySQL HGs (10/20) already active in this ProxySQL instance.domain_name='.EXAMPLE-SUFFIX.us-east-1.rds.amazonaws.com' — the leading dot is not optional. ProxySQL matches this suffix against instance hostnames returned by REPLICA_HOST_STATUS to scope discovery to this cluster only. Omit the dot and the INSERT fails with a CHECK constraint violation.check_interval_ms=2000 — ProxySQL polls REPLICA_HOST_STATUS on each backend every 2 seconds. The floor on detection latency is Aurora’s internal promotion time (typically 6–30 seconds depending on instance class and cross-AZ conditions); check_interval_ms adds at most one additional polling cycle on top of that floor. Part 5 covers sizing this for production.check_timeout_ms=800 — a poll that takes longer than 800ms is treated as a connection failure. Must be less than check_interval_ms.writer_is_also_reader=0 — writes route to HG 100 only; the writer instance does not appear in HG 101 for reads. In ProxySQL 2.7.3, the only valid values are 0 and 1. Some older ProxySQL documentation references 2 as a valid setting, but the actual CHECK constraint in 2.7.3 rejects it with a constraint error. We confirmed this in the lab.max_lag_ms=600000 — 10 minutes; effectively no lag filtering for this lab. Part 5 covers production tuning.-- mysql_servers: insert the cluster writer endpoint as a discovery seed
-- ProxySQL bootstraps from this single row and auto-discovers all instances
INSERT INTO mysql_servers (hostgroup_id, hostname, port, comment)
VALUES (
100,
'proxysql-aurora-EXAMPLE.cluster-EXAMPLE-SUFFIX.us-east-1.rds.amazonaws.com',
3306,
'Aurora cluster writer endpoint (seed for discovery)'
);
One row. The cluster endpoint — not an instance endpoint — in HG 100. Once the mysql_aws_aurora_hostgroups row is active and loaded to RUNTIME, ProxySQL polls this seed’s REPLICA_HOST_STATUS and auto-populates the actual writer and reader instance endpoints. You don’t enumerate instances manually. More on what happens next in Section 5.
-- mysql_users: point the app user at HG 100 (writer) by default
-- If the user already exists from a previous lab step, use UPDATE instead of INSERT
-- to avoid a UNIQUE constraint error on (username, frontend)
UPDATE mysql_users SET default_hostgroup=100 WHERE username='app';

-- mysql_query_rules: lower rule_id = higher priority; order matters
-- rule_id 10 must come before 11, or SELECT FOR UPDATE would match ^SELECT first
INSERT INTO mysql_query_rules (rule_id, active, match_pattern, destination_hostgroup, comment)
VALUES
  (10, 1, '^SELECT.*FOR UPDATE$', 100, 'SELECT FOR UPDATE → Aurora writer HG 100'),
  (11, 1, '^SELECT',              101, 'all SELECTs → Aurora reader HG 101');
-- Promote all four config layers to runtime, then persist
LOAD MYSQL SERVERS TO RUNTIME;     SAVE MYSQL SERVERS TO DISK;
LOAD MYSQL USERS TO RUNTIME;       SAVE MYSQL USERS TO DISK;
LOAD MYSQL QUERY RULES TO RUNTIME; SAVE MYSQL QUERY RULES TO DISK;
LOAD MYSQL VARIABLES TO RUNTIME;   SAVE MYSQL VARIABLES TO DISK;
Run these on either ProxySQL node. The ProxySQL Cluster syncs runtime state to the peer within approximately 200ms — you apply once, both nodes converge.
After LOAD MYSQL SERVERS TO RUNTIME, the monitor thread begins polling immediately. No restart needed. Give it a few seconds, then check runtime_mysql_servers.
We inserted one mysql_servers row. About 2 seconds after LOAD TO RUNTIME, ProxySQL had finished its first poll cycle and discovered the writer and reader. By the time we captured the snapshot below — about 60 seconds in — the picture had stabilized:
-- runtime_mysql_servers on proxysql-1 (~60s after LOAD TO RUNTIME)
hostgroup_id  hostname                                                           port  status  comment
100           proxysql-aurora-EXAMPLE-reader.EXAMPLE-SUFFIX.us-east-1...        3306  ONLINE  (auto-discovered — actual writer)
100           proxysql-aurora-EXAMPLE.cluster-EXAMPLE-SUFFIX.us-east-1...       3306  ONLINE  Aurora cluster writer endpoint (seed for discovery)
101           proxysql-aurora-EXAMPLE-writer.EXAMPLE-SUFFIX.us-east-1...        3306  ONLINE  (auto-discovered — actual reader)
ProxySQL adds, it doesn’t replace. The cluster endpoint we inserted as a seed stays in HG 100 alongside the auto-discovered writer instance endpoint. In production you’d typically remove the seed once discovery is verified, since the cluster endpoint resolves to the current writer’s instance endpoint anyway and the duplicate entry serves no useful purpose. For this lab we left it in place.
To watch the polling live, query the Aurora monitor log — which lives in the monitor schema, not in main or stats:
-- monitor.mysql_server_aws_aurora_log: 3-row excerpt, DESC by time
-- Correct schema is monitor — not main.mysql_server_aurora_log (that table does not exist in 2.7.3)
SELECT check_utc, hostname, is_writer_per_replica_host_status AS writer_detected, lag_ms
FROM monitor.mysql_server_aws_aurora_log
ORDER BY check_utc DESC
LIMIT 3;
check_utc               hostname (polled)                                         writer_detected                  lag_ms
2026-05-08 10:52:40     proxysql-aurora-EXAMPLE-writer.EXAMPLE-SUFFIX...          proxysql-aurora-EXAMPLE-reader       0
2026-05-08 10:52:38     proxysql-aurora-EXAMPLE-reader.EXAMPLE-SUFFIX...          proxysql-aurora-EXAMPLE-reader       0
2026-05-08 10:52:37     proxysql-aurora-EXAMPLE-reader.EXAMPLE-SUFFIX...          proxysql-aurora-EXAMPLE-reader       0
Every ~2 seconds, ProxySQL polls each backend it knows about. From each backend, it queries INFORMATION_SCHEMA.REPLICA_HOST_STATUS. The writer_detected column shows the instance whose SESSION_ID=MASTER_SESSION_ID — the current writer, as Aurora itself reports it. Notice the row at 10:52:40: ProxySQL polled the instance named "writer", but REPLICA_HOST_STATUS said the actual writer was the instance named "reader". Why?
NAMES DON’T MATCH TOPOLOGY — AND THAT’S FINE: During lab setup, a rename operation with apply-immediately triggered an implicit Aurora failover. The instance we had named "writer" became a reader, and the instance named "reader" became the writer. ProxySQL ignored both instance names entirely. It queried INFORMATION_SCHEMA.REPLICA_HOST_STATUS on each backend and looked for SESSION_ID=MASTER_SESSION_ID — that’s the only signal it uses to determine topology. It correctly placed the actual writer in HG 100 and the actual reader in HG 101, without any reconfiguration. Instance names in the AWS console are labels. Topology lives in REPLICA_HOST_STATUS.
There are more footguns in this setup than the docs let on — writer_is_also_reader constraints, domain_name leading-dot rules, query rule ordering when you have both local MySQL and Aurora backends active in the same ProxySQL instance. If you want a second pair of eyes on your configuration before it goes live, book a free assessment call.
Before triggering a failover, verify that query rules route correctly. Two checks: 50 SELECTs all land on the reader, and 5 INSERTs all land on the writer.
# -- 50 SELECTs through proxysql-1:6033 — expect all to hit HG 101 (Aurora reader)
for i in $(seq 1 50); do
  mysql -h 192.168.105.7 -P 6033 -u app -p'<password>' \
    -sN -e 'SELECT @@hostname;'
done | sort | uniq -c
50 ip-10-1-X-X
All 50 returned the same internal hostname — the reader instance — with zero variance. The ^SELECT rule (rule_id 11) caught every query and sent it to HG 101.
# -- 5 INSERTs through proxysql-1:6033 — expect all to hit HG 100 (Aurora writer)
for i in $(seq 1 5); do
  mysql -h 192.168.105.7 -P 6033 -u app -p'<password>' \
    -sN -e "INSERT INTO failover_test (payload, hostname)
            VALUES ('write-test', @@hostname);"
done

# -- verify write routing: read the inserted rows back through the reader path
mysql -h 192.168.105.7 -P 6033 -u app -p'<password>' \
  -e "SELECT payload, hostname, COUNT(*) cnt
      FROM failover_test
      WHERE payload='write-test'
      GROUP BY hostname;"
payload     hostname         cnt
write-test  ip-10-1-X-XXX      5
The INSERT wrote @@hostname — the current backend’s internal IP — directly into each row. The follow-up SELECT (routed to the reader via the ^SELECT rule) read those rows back and confirmed: all five writes landed on ip-10-1-X-XXX, the writer instance, and replicated to the reader. This pattern — write a value, read it back through the proxy’s reader path — verifies routing end-to-end, not just that ProxySQL parsed the query rule correctly. It confirms the write actually reached the writer and that the reader returned the replicated result. Use it whenever you need to validate routing through the full path rather than by inspecting ProxySQL internals alone.
A Python script ran 10 SELECTs per second through proxysql-1:6033, logging each result with a UTC timestamp. Each SELECT routes to HG 101 (Aurora reader) via the ^SELECT rule.
#!/usr/bin/env python3
# -- load-generator.py — 10 SELECTs/sec through proxysql-1:6033
import subprocess, time, datetime

LOG = "/tmp/failover-traffic.log"
INTERVAL = 0.1  # 10 requests/sec

with open(LOG, "a") as f:
    while True:
        t = datetime.datetime.utcnow().isoformat(timespec="milliseconds")
        try:
            r = subprocess.run(
                ["mysql", "-h", "192.168.105.7", "-P", "6033",
                 "-u", "app", "-p<password>",
                 "--connect-timeout=3", "-e", "SELECT @@hostname;"],
                capture_output=True, text=True, timeout=5
            )
            status = (r.stdout.strip().split()[-1]
                      if r.returncode == 0
                      else f"ERR:{r.stderr.strip()[:60]}")
        except subprocess.TimeoutExpired:
            status = "TIMEOUT"
        f.write(f"{t} {status}\n")
        f.flush()
        time.sleep(INTERVAL)
One command. T0 is the moment the API call returned:
# -- trigger Aurora cross-AZ failover — T0 = API accepted
aws rds failover-db-cluster --db-cluster-identifier proxysql-aurora-EXAMPLE
Marker   Elapsed    Event
------   -------    -----
T0       +0.0s      failover-db-cluster API accepted
—        +9.8s      Aurora: "Started cross AZ failover to proxysql-aurora-EXAMPLE-writer"
T1       +10.2s     First application error (connection timeout at ProxySQL)
T2       +10.3s     Last application error — total error window: 0.1s
T3       +15.3s     Queries resume through ProxySQL (new writer now accepting connections)
—        +18.0s     monitor.mysql_server_aws_aurora_log: first successful poll
                    showing new writer (SESSION_ID=MASTER_SESSION_ID flipped)
T4       +19.1s     runtime_mysql_servers updated — HG 101 now routes to new reader
—        +21.4s     Aurora: "Completed customer initiated failover"
—        +44.0s     Cluster status: available
Total application-visible errors: 2. Both within the same 0.1-second window at T1–T2. The remaining 1,483 queries ran without error.
PROXYSQL UPDATED BEFORE AURORA DECLARED COMPLETE: ProxySQL updated its hostgroup topology at T0+19.1s. Aurora declared the failover complete at T0+21.4s. ProxySQL knew the topology had changed 2.3 seconds before Aurora’s own completion event arrived. It doesn’t wait for AWS — it reads REPLICA_HOST_STATUS directly, on its own polling schedule, on every cycle regardless of what Aurora’s control plane is doing.
The monitor log shows exactly what happened between T1 and T3:
-- monitor.mysql_server_aws_aurora_log — failover detection window
-- Rows filtered to MASTER_SESSION_ID (writer-identifying polls only)
check_utc               hostname (polled)                                    writer_detected
2026-05-08 10:53:06     proxysql-aurora-EXAMPLE.cluster-EXAMPLE-SUFFIX...   proxysql-aurora-EXAMPLE-reader  ← last pre-failover confirmation
2026-05-08 10:53:10     proxysql-aurora-EXAMPLE-reader.EXAMPLE-SUFFIX...    proxysql-aurora-EXAMPLE-reader  ← last poll before the gap

  [gap: 10:53:10 → 10:53:16]
  [Aurora mid-promotion — backends temporarily unreachable]
  [ProxySQL continued polling on schedule; all attempts failed to connect]

2026-05-08 10:53:16     proxysql-aurora-EXAMPLE-writer.EXAMPLE-SUFFIX...    proxysql-aurora-EXAMPLE-writer  ← new writer detected
The 6-second gap between 10:53:10 and 10:53:16 was not ProxySQL skipping polling cycles. ProxySQL was polling on schedule — check_interval_ms=2000 means it attempted a connection every 2 seconds — but Aurora’s backends were temporarily unreachable while the promotion was in progress. The endpoints went dark during the promotion and became reachable again once Aurora finished. ProxySQL detected the topology change on its first successful poll after Aurora’s internal promotion completed.
The correct model for detection latency:
detection latency = (Aurora internal promotion time)
                  + (at most one check_interval_ms cycle)
In this lab: approximately 6 seconds of Aurora internal promotion time, plus up to 2 seconds of polling lag, equals roughly 6–8 seconds from when Aurora initiated the promotion to when ProxySQL first read the new topology successfully. Lowering check_interval_ms from 2000ms to 500ms would not have produced 4× faster detection here. It would have shaved at most 1.5 seconds off the lag above the promotion floor. The floor is Aurora’s promotion time — that’s opaque to ProxySQL and set by instance class, workload, and cross-AZ replication state. Part 5 covers production sizing of check_interval_ms with that constraint in mind.
At T0+44s, runtime_mysql_servers on proxysql-1 shows the fully inverted topology:
-- runtime_mysql_servers on proxysql-1 (post-failover, T0+44s)
hostgroup_id  hostname                                                          port  status
100           proxysql-aurora-EXAMPLE-writer.EXAMPLE-SUFFIX.us-east-1...        3306  ONLINE  (new writer)
101           proxysql-aurora-EXAMPLE-reader.EXAMPLE-SUFFIX.us-east-1...        3306  ONLINE  (new reader)
101           proxysql-aurora-EXAMPLE.cluster-EXAMPLE-SUFFIX.us-east-1...       3306  ONLINE  (seed — still present)
HG 100 now holds the promoted instance. HG 101 holds the demoted instance plus the cluster endpoint seed (which now resolves to the new writer, but is still valid for read traffic in HG 101 since all ONLINE instances in a reader hostgroup are eligible).
Part 1 described roughly 60 seconds of pain using the Aurora reader endpoint alone — stale DNS TTLs, connection pool churn, reads landing on a replica still behind the new writer’s binlog position. That figure was conservative for the reader endpoint under realistic production conditions: JVM DNS caching, long keepalive intervals, and a connection pool configured for throughput rather than fast reconnect after a backend change.
What ProxySQL changed: instead of waiting for DNS propagation, ProxySQL polls REPLICA_HOST_STATUS directly and reroutes at the TCP connection level. There’s no DNS layer between ProxySQL and Aurora’s instance endpoints. Application clients connected to proxysql-1:6033 stayed connected to ProxySQL throughout the failover — they never saw the backend change. The 2 errors we recorded were connection timeouts during the brief promotion window when no backend was reachable. Not stale-read errors, not reconnection storms, not silent misrouting. Two timeouts in a 0.1-second window, then normal operation resumed.
This part covers one thing: wiring ProxySQL to Aurora and verifying the configuration survives a live failover. Three topics are deferred by design:
transaction_persistent behavior under mixed read/write workloads → Part 3mysql_server_aws_aurora_log in production, sizing check_interval_ms based on observed promotion time, alerting on detection gaps → Part 5In Part 3, we wire the query routing layer. The cluster is connected and survives a failover — now we make the routing configuration production-grade. That means mysql_query_rules in depth: regex ordering, per-user routing, per-schema routing, and transaction_persistent behavior under sessions that mix reads and writes. If your ORM doesn’t always mark transactions explicitly, Part 3 is where the routing gets genuinely interesting.
M
ReliaDB is a specialist DBA team for PostgreSQL and MySQL performance, high availability, and cloud database optimization. More about ReliaDB →
Planet for the MySQL Community
https://reliadb.com/images/og-default.png
At 14:32 on a Tuesday, a writer failover hit an Aurora MySQL cluster in production. Aurora did its job: within about 30 seconds, a reader had been promoted, the cluster endpoint had been updated, and replication was running in reverse. From the database’s perspective, the failover was clean.
From the application’s perspective, it was messy. The reader endpoint kept serving connections — sort of. For roughly 60 seconds, a portion of connections returned ETIMEDOUT, others silently fetched data from a replica that was still several seconds behind the new writer, and the connection pool on the now-promoted writer climbed past 900 as every idle connection in every app tier tried to reconnect simultaneously. No data was lost. The failover was technically successful. But that 60-second window caused real downstream pain: cache misses, stale reads that bypassed business-logic checks, and an alert storm that took another 20 minutes to quiet.
AWS managed MySQL is genuinely excellent at operating a database. It handles patching, replication, storage scaling, and failover without you touching the binaries. What it does not do — and was never designed to do — is solve the proxy layer. That problem is still yours.
This five-part series is about exactly that problem: deploying ProxySQL in front of RDS and Aurora MySQL, from the first architectural decision all the way to operating it in production. Part 1 is conceptual. It covers the why, the where, and the decision framework. No shell commands here — those start in Part 2.
WHAT YOU’LL BUILD: A production-representative ProxySQL topology sitting in front of Aurora MySQL — connection multiplexing, read/write splitting with query-level rules, a ProxySQL Cluster for config HA, and Aurora-native topology discovery. The same lab topology runs unchanged across all five parts so you can follow each step end-to-end.
Before reaching for any proxy, it’s worth naming the specific problems you’re trying to solve. RDS and Aurora expose several endpoint types — cluster endpoint, reader endpoint, instance endpoints — and they cover a lot of ground. But each has a hard limit that surfaces when your workload grows or your topology changes under pressure.
The reader endpoint distributes connections across all reader instances in the cluster via DNS-based round-robin. It works, and for many workloads it’s entirely sufficient. The limits emerge when you need more than "roughly even distribution."
The first limit is routing intelligence: it has none. The reader endpoint routes TCP connections, not SQL. It doesn’t know what query is being sent. You can’t direct long-running analytics queries to a larger reader instance while keeping the smaller one for OLTP reads. Every connection gets identical treatment regardless of what it does next.
The second limit is failover behavior. When Aurora promotes a reader to writer, the cluster endpoint updates within seconds. The reader endpoint takes longer to settle because it reflects the current set of available readers, and clients that already have a DNS answer are holding a cached TTL. Depending on your connection pool’s DNS TTL handling and JVM settings, reads can land on the old writer — now a reader — or on replicas that haven’t fully caught up to the new writer’s binlog position yet. Two consecutive reads in the same application session can hit different replicas with different replication lag, which produces read-your-own-writes violations that are difficult to reproduce and infuriating to debug in production.
RDS Multi-AZ keeps a synchronous standby in a separate Availability Zone. That standby absorbs the failover cleanly — RDS flips the CNAME, the old primary becomes the new standby, and writes resume. It’s a solid HA story.
The limitation is that the standby is not readable. You pay for a full second instance — same CPU, same memory, same storage class — and get exactly zero read capacity in return. All read traffic still runs through the primary. If your goal is to distribute read load, Multi-AZ does nothing for you.
The failover experience also has a rough edge. The DNS flip typically takes 60–120 seconds to propagate through resolver caches. During that window, apps that don’t aggressively detect dead connections will queue or block against the old endpoint. Connection pools configured with long keepalive intervals or no TCP keepalive will sit on dead sockets without noticing. And there’s no graceful drain — in-flight transactions die the moment the standby promotes. Any retry logic is entirely on the application side.
Every client connection to RDS or Aurora is a real MySQL thread on the backend server. There’s no pooling at the managed endpoint layer. A single connection pool with 500 connections means 500 threads on the writer, each holding allocated memory, regardless of whether any of them are actively executing a query at that moment.
This matters at steady state, but it bites hardest during recovery. After a failover, all connections across all your app tiers try to reconnect at roughly the same moment — the thundering herd. Aurora’s max_connections is derived from the instance class: a db.r6g.large supports around 1,000 connections. Three app tiers with 200 connections each, plus monitoring tools and any administrative overhead, and you’re approaching that ceiling before the reconnect storm hits. The instinctive response — upsize the instance — is expensive and doesn’t change the underlying reconnect pattern.
The RDS and Aurora endpoint layer is connection-aware, not query-aware. Once a TCP connection is established, what travels over it is invisible to AWS. This means you have no mechanism at the managed layer to block a SELECT * without a WHERE clause from a poorly-written ORM, mirror production traffic to a staging replica to validate a schema change under real load, throttle an analytics query that’s crowding out OLTP reads, or enforce per-application connection limits so one service can’t exhaust the pool for everyone else. These are DBA problems. The managed endpoint layer doesn’t solve them, and it’s not going to.
SYMPTOMS YOU’VE PROBABLY SEEN: Thundering herd on the writer immediately after failover as all connection pools reconnect simultaneously. Stale reads surfaced by a sticky-session bug when a load balancer pins a user to a lagging replica. Connection storms during blue-green deploys when both environments briefly hold a full connection pool against the same writer endpoint.
ProxySQL is a MySQL-protocol proxy. It sits between your application and your MySQL backends, speaking the MySQL client/server protocol on both sides — the application thinks it’s talking to MySQL directly, and the MySQL backends think ProxySQL is just another client. Nothing changes at either end. You don’t modify your driver, your connection string format (beyond hostname and port), or your SQL. The proxy layer is fully transparent to the application.
What changes is what happens in the middle.
The three-layer config model is the first thing to internalize, because it’s unlike every other proxy you’ve probably used. ProxySQL maintains three distinct layers: MEMORY (a staging scratchpad), RUNTIME (the live, actively-used configuration), and DISK (the persisted sqlite3 database). You stage changes in MEMORY, validate them, then explicitly promote to RUNTIME with a LOAD ... TO RUNTIME command. You persist to DISK separately with SAVE ... TO DISK. There’s no config file reload, no signal to send, no service restart. Changes are atomic and deliberate by design.
Hostgroups are ProxySQL’s abstraction over backend servers. You assign each MySQL instance to a hostgroup — writer in HG 10, readers in HG 20 — and ProxySQL handles routing between them. It monitors backend health by polling read_only on standard MySQL replication. For Aurora clusters, Part 2 will show how mysql_aws_aurora_hostgroups tells ProxySQL to query INFORMATION_SCHEMA.REPLICA_HOST_STATUS instead, giving it true Aurora-native topology awareness that survives Aurora-specific failover events.
Query rules map SQL patterns to hostgroups. A rule matching ^SELECT routes reads to HG 20; a rule matching ^SELECT.*FOR UPDATE sends locking reads to HG 10. Rules can be stacked, prioritized, weighted, and scoped by user or schema. Part 3 covers query rules in depth — the point here is that routing happens per statement, not per connection.
Connection multiplexing lets N frontend connections share M backend connections, where M is much smaller than N. ProxySQL tracks per-session state — autocommit status, active transactions, SET variable assignments, temporary tables, advisory locks — to determine when a backend connection is safe to hand to a different frontend client. For workloads with many idle or short-lived connections, this can collapse backend thread counts by an order of magnitude.
Query mirroring clones traffic from the production hostgroup to a secondary hostgroup — a staging replica, a new Aurora cluster version, a read replica under evaluation. Mirrored queries are fire-and-forget: results are discarded, application latency is unaffected, and the calling code never knows the traffic was duplicated. It’s the cleanest way to validate infrastructure changes under real production query patterns without touching the critical path.
Native MySQL protocol means no driver changes and no protocol translation overhead. Applications see ProxySQL as a standard MySQL endpoint; the authentication handshake is transparent. If you’ve used pgBouncer for PostgreSQL connection pooling, ProxySQL multiplexing solves the same connection-count problem at the MySQL protocol layer — but with per-statement query awareness layered on top.
Where you deploy ProxySQL on AWS is the most consequential architectural decision in this series. Get it wrong and you’ll be managing config drift, single-AZ blast radius, or hidden latency for as long as the deployment lives. There are four viable patterns, each a legitimate choice, and none universally correct.
In the sidecar pattern, a ProxySQL process runs on every application server or alongside the application container in every ECS task. The app connects to 127.0.0.1:6033 — a loopback address. There’s zero extra network hop between the application and the proxy. For latency-sensitive workloads where even sub-millisecond overhead matters, this is the right answer.
The operational challenge matches the latency advantage: you now have N ProxySQL instances to keep aligned. If your fleet has 40 EC2 instances and you push a query rule change, that change needs to land on all 40 — or you’ll have instances routing traffic differently from each other, in a way that’s hard to reproduce during an incident. Config drift across instances is the primary failure mode of this pattern. It doesn’t surface immediately; it bites you three months later when you discover eight instances are running a config from six weeks ago.
You can manage this cleanly with automation: ProxySQL config delivered via SSM Parameter Store and applied at instance launch, AWS AppConfig for runtime pushes, or Ansible/Chef. Without that automation in place before you adopt this pattern, the pattern will work against you. AZ resilience is inherited from your application tier — if your app runs across three AZs, so do your sidecar ProxySQL instances.
Best for: teams with mature, tested config automation; workloads where sub-millisecond proxy latency matters; single-application environments connecting to a single cluster.
In the centralized pattern, two or more ProxySQL EC2 instances run in an Auto Scaling Group in private subnets, fronted by an AWS Network Load Balancer. Applications point at the NLB DNS name. The NLB handles health checks and distributes incoming TCP connections across the ProxySQL fleet.
The latency addition is real but small: an NLB in the same Availability Zone as the application typically adds under 0.5ms of round-trip time. Cross-AZ adds 1–2ms. For the vast majority of database workloads — even high-frequency OLTP — this is noise that won’t appear in your P99 latency graphs.
The operational win is significant: one config surface for every application connected to the database layer. Push a query rule change to two ProxySQL instances and every application sees it within seconds, with no per-host coordination. Rolling upgrades work cleanly via ASG instance refresh — drain one node, upgrade, re-add, repeat. The risk is blast radius: a misconfiguration that reaches RUNTIME on a centralized fleet affects all applications simultaneously. Mitigate this with a promotion discipline: apply to MEMORY on one node, smoke-test, then promote across the fleet. Part 5 covers a practical runbook for this.
Best for: environments with multiple applications sharing the same cluster; ops teams who want a single "database layer" to reason about; teams without mature per-host config automation.
On EKS, the sidecar pattern maps naturally to Kubernetes: ProxySQL runs as a container in the same pod as the application container, sharing the pod’s network namespace. The app connects to localhost:6033 — same zero-hop benefit as the EC2 sidecar.
Configuration arrives via a ConfigMap or Secret, with ProxySQL reloading on change via an init container, a lifecycle hook, or a purpose-built controller. The proxy lifecycle is tied to the pod: when a pod scales up, a new ProxySQL instance comes with it; when the pod terminates, so does the proxy. No orphaned state to clean up.
One metric demands attention from the start: the connection count arriving at Aurora. At 500 application pods with a ProxySQL sidecar each holding ~10 backend connections after multiplexing, you can land 5,000 MySQL threads on the writer. Multiplexing helps inside each sidecar — it doesn’t help across them. Aurora’s max_connections sees those 5,000 threads regardless of where they originate. Size your multiplexing configuration and your Aurora instance class together, and monitor max_connections headroom continuously.
Best for: EKS-native shops already running the sidecar pattern; environments where the application deployment model should own the proxy lifecycle.
Two ProxySQL instances configured as a ProxySQL Cluster, placed in separate Availability Zones, fronted by an NLB or round-robin DNS. This is what this series builds in the lab, and it’s the pattern we recommend for most production MySQL deployments.
The defining capability is automatic config synchronization. Configure the two nodes as a cluster via the proxysql_servers table, and any runtime config change applied to either node — new query rules, backend changes, user additions, global variable updates — propagates to the peer automatically, typically within a few hundred milliseconds. You apply a change once, and both nodes converge. No per-host coordination, no push scripts, no drift.
The upgrade story is clean: remove one node from NLB rotation, upgrade its ProxySQL binary, reconnect, then do the same for the second node. You never take the proxy layer entirely offline. AZ resilience comes from placing the two nodes in different Availability Zones — if one AZ becomes unavailable, the NLB routes all traffic to the surviving node.
This is the topology the lab runs throughout this series. Part 4 covers the complete HA and failover story for this pattern, including NLB health check configuration and Aurora-specific event handling.
| Deployment Model | Latency Add | Config Sync | Upgrade Path | AZ Resilience | Best For |
|---|---|---|---|---|---|
| App-side sidecar | 0 ms | Per-host automation required | Rolling per instance | Inherits app tier spread | Low-latency, single app, mature config automation |
| Centralized + NLB | < 0.5 ms intra-AZ | Centralized (one config surface) | ASG instance refresh | Multi-AZ ASG + NLB | Multi-app environments, ops-centric teams |
| K8s sidecar (EKS) | 0 ms | ConfigMap / Secret push | Rolling pod restart | Inherits pod spread | EKS-native teams, pod-lifecycle ownership |
| Dedicated cluster pair | < 0.5 ms intra-AZ | Auto-sync via proxysql_servers |
Rolling node-by-node, zero downtime | 2 nodes in different AZs | Production default; this series’ model |
A single ProxySQL node is a single point of failure in two distinct ways, and both matter.
The first is the obvious one: one node means one traffic failure point. If that instance goes down — kernel panic, OOM kill, network partition, or emergency maintenance — your application loses the proxy layer entirely. You could re-point apps directly at Aurora as a fallback, but that immediately eliminates the routing rules and multiplexing configuration your application has been relying on.
The second failure mode is less obvious: a single ProxySQL node is also a single point of config change failure. If you apply a config change that breaks routing and need to roll it back immediately, you need the node to be responsive. If the problem is the node itself, you have nothing to fall back to.
Two nodes in a ProxySQL Cluster solve both problems. The proxysql_servers table on each node lists the other as a peer. When you apply a config change — any LOAD ... TO RUNTIME paired with SAVE ... TO DISK — ProxySQL propagates that change to all configured peers automatically. What syncs between peers: mysql_servers, mysql_users, mysql_query_rules, and global_variables. Each node maintains its own disk state; cluster sync operates at the runtime layer only. When a new node joins, it auto-bootstraps from existing peers — given a populated proxysql_servers table and matching cluster credentials, the new node fetches the latest runtime config from the peer with the highest epoch on startup. The disk file is local; the cluster state is recoverable.
In the lab for this series, proxysql-1 at 192.168.105.7 and proxysql-2 at 192.168.105.8 are configured as a cluster and propagate changes at approximately 200ms under normal conditions. Smoke test 04-cluster-sync.sh validates this by applying a config change to proxysql-1 and verifying it arrives on proxysql-2 before timing out. Part 4 adds the NLB health-check configuration and Aurora-specific failover hooks that complete this foundation.
ProxySQL adds a component to your infrastructure that requires operational attention — upgrades, monitoring, understanding failure modes, training the team. Before committing to it, it’s worth being honest about whether you actually need what it provides. Several alternatives are simpler, and the right call for many RDS/Aurora environments is not ProxySQL.
If your read workload is uniform — all reads have roughly the same profile, target the same tables, and don’t require per-query routing — the Aurora reader endpoint is likely sufficient. It distributes connections across readers, integrates with Aurora’s native topology discovery, and costs nothing to operate beyond the reader instances themselves. The ~30–60s failover window is acceptable for most applications if the connection pool has sensible retry logic and a short TCP keepalive.
If the reason you’re looking at ProxySQL is that the reader endpoint does round-robin and you want "smarter" distribution, stop and ask whether the routing problem is real. If your readers are the same instance class and the load is uniform, round-robin is close to optimal. Adding ProxySQL for that case alone is operational overhead solving a problem that doesn’t exist.
HAProxy is battle-tested, handles high connection rates efficiently, and is simpler to operate than ProxySQL. For MySQL, it works at Layer 4: it routes TCP connections, not SQL queries. You can configure health checks against the MySQL port and distribute connections across backend pools, but routing decisions are based on the connection, not the query traveling over it.
If your only need is to spread connections across multiple read replicas with no SQL-layer intelligence, HAProxy or an NLB with IP target groups is a reasonable choice. You give up multiplexing, query rules, and the query digest, but if you don’t need those features, you also avoid the complexity of maintaining them. This is a legitimate trade-off, not a compromise.
RDS Proxy is AWS’s managed connection pooler for RDS and Aurora. It handles pooling at the managed layer, integrates with IAM authentication and AWS Secrets Manager for credential rotation, and requires no infrastructure to provision or maintain. For teams that want connection pooling without running their own proxy fleet, it’s worth evaluating seriously.
RDS Proxy added read/write splitting via session-aware routing in 2024, so the basic split is solved. The gap relative to ProxySQL sits in everything beyond that. As of mid-2026, RDS Proxy does not support user-defined query routing rules — you can’t write a rule that sends a specific query pattern to a specific instance. It doesn’t support query mirroring. It doesn’t support query rewriting. The per-statement observability that ProxySQL exposes via stats_mysql_query_digest has no equivalent. And the pricing model — charged per vCPU of the underlying database instance — becomes meaningful at scale.
| Feature | RDS Proxy | ProxySQL |
|---|---|---|
| Query routing rules | No | Yes — regex/digest, per-user, per-schema |
| Connection multiplexing | Yes (managed, opaque) | Yes (configurable, observable) |
| Query mirroring | No | Yes |
| Per-statement query digest | No | Yes (stats_mysql_query_digest) |
| IAM authentication | Yes (native) | No (requires workaround) |
| Operational overhead | Low — fully managed | Medium — self-managed fleet |
| Cost model | Per vCPU of DB instance | EC2 instance + NLB (~$16–20/mo) |
MySQL Connector/J’s replication protocol, the AWS JDBC Driver’s reader/writer splitting, and similar connector-side solutions route queries at the application layer. The driver inspects whether the current context is read-only and routes accordingly. This works — and it works without any proxy infrastructure.
The trade-off is that routing policy lives in application code. If you have five services connecting to the same Aurora cluster and you want to change which queries go to readers, you need to update five codebases and deploy five services. There’s no central audit trail, no place to add a rule that captures all traffic regardless of which service is sending it, and no way for the database team to adjust routing without going through a development cycle. For stable, simple routing that genuinely never changes, this is fine. For anything more dynamic, it’s the wrong layer to own the policy.
The honest summary: if your workload is simple and stable, RDS Proxy or connector-side routing covers the common case with significantly less operational overhead than ProxySQL. ProxySQL is the right tool when you need SQL-layer control that neither of those options provides — and when you’re willing to own the operational cost that comes with it.
ProxySQL setup and tuning is one of the most impactful changes a DBA can make for a scaling MySQL environment. If you want expert guidance on placement, query routing, or failover design before committing to an architecture, book a free assessment call.
TESTED ON LIVE VMs: All configurations and outputs across this series come from a Lima VM lab running on macOS — MySQL 8.0.41 managed by dbdeployer (master + 2 replicas), ProxySQL 2.7.3 (two-node cluster), end-to-end smoke-tested before publication. Four smoke tests cover read/write split, replica shunning, multiplexing, and cluster config sync.
Every part of this series builds on the same four-VM lab. Understanding the topology now means you won’t need to re-orient each time a new part adds configuration on top of it.
                    ┌──────────────────┐
                    │    client-vm     │
                    │  192.168.105.9   │
                    │ sysbench / mysql │
                    └────────┬─────────┘
                             │  MySQL protocol :6033
               ┌─────────────┴─────────────┐
               │                           │
  ┌────────────▼──────────┐   ┌────────────▼──────────┐
  │      proxysql-1       │◄──►│      proxysql-2       │
  │   192.168.105.7       │   │   192.168.105.8       │
  │   ProxySQL 2.7.3      │   │   ProxySQL 2.7.3      │
  │   HG 10: writer       │   │   HG 10: writer       │
  │   HG 20: readers      │   │   HG 20: readers      │
  │   admin :6032         │   │   admin :6032         │
  └────────────┬──────────┘   └────────────┬──────────┘
               │    ProxySQL Cluster sync   │
               │         (~200 ms)          │
               └─────────────┬─────────────┘
                             │  MySQL protocol
                    ┌────────▼─────────┐
                    │  mysql-backends  │
                    │  192.168.105.6   │
                    ├──────────────────┤
                    │ master   :25001  │  ← HG 10 (writer)
                    │ replica1 :25002  │  ← HG 20 (reader)
                    │ replica2 :25003  │  ← HG 20 (reader)
                    └──────────────────┘
| VM Name | IP | Role | Services |
|---|---|---|---|
mysql-backends |
192.168.105.6 | MySQL master + 2 replicas | mysqld ×3 (ports 25001 / 25002 / 25003) |
proxysql-1 |
192.168.105.7 | ProxySQL 2.7.3 (primary) | proxysql :6032 (admin) :6033 (app) |
proxysql-2 |
192.168.105.8 | ProxySQL 2.7.3 (cluster peer) | proxysql :6032 (admin) :6033 (app) |
client-vm |
192.168.105.9 | Client / load generator | mysql-client, sysbench |
PRODUCTION SUBSTITUTION: In the lab, all three MySQL backends run on a single VM managed by dbdeployer — three mysqld processes on different ports on the same host. In production, you’d replace those three endpoints with your Aurora cluster’s individual instance endpoints (not the cluster endpoint or reader endpoint), or your RDS writer endpoint plus read replica instance endpoints. ProxySQL 2.7.3 is binary-compatible with Aurora MySQL 2, which tracks the 8.0.x lineage. Part 2 makes this substitution concrete: we connect to a real Aurora cluster and configure mysql_aws_aurora_hostgroups for Aurora-native topology discovery.
Before spending time on the rest of this series, work through these six questions honestly. They’re designed to help you make the right call, not to steer you toward ProxySQL.
max_connections_per_user, error injection, or active/passive rule switching handle this without a code deploy or application-team involvement.If you answered yes to any of the first four, ProxySQL is worth the investment. If your situation fits only the last two, the simpler option is probably the right one. ProxySQL adds a real operational component — a binary to upgrade, a config layer to understand, failure modes to train for. That overhead pays for itself when the workload demands what ProxySQL provides. It doesn’t pay for itself when you just need round-robin reads.
In Part 2, we move from architecture to configuration. We’ll connect ProxySQL to a real Aurora MySQL cluster using mysql_aws_aurora_hostgroups — the Aurora-native table that directs ProxySQL to query INFORMATION_SCHEMA.REPLICA_HOST_STATUS for topology discovery, rather than relying on the read_only polling used for standard MySQL replication. With this configuration, ProxySQL auto-discovers the writer and all reader instances, adapts when Aurora promotes a reader during a failover event, and routes traffic correctly through the cluster-level changes that would trip up a replication hostgroup configured for vanilla MySQL. The lab and production configurations live side by side throughout so you can follow both paths.
M
ReliaDB is a specialist DBA team for PostgreSQL and MySQL performance, high availability, and cloud database optimization. More about ReliaDB →
Planet for the MySQL Community