https://severalnines.com/wp-content/uploads/2026/08/share-postgresql-and-clickhouse-1.png
The role of databases has shifted significantly as modern applications must deliver real-time analytics, dashboards, and machine learning alongside low-latency transaction processing. Handling these diverse demands with a single relational database has become unsustainable under growing data volumes. Consequently, organizations are adopting specialized database architectures where multiple engines work together based on their strengths, allowing transactional and analytical workloads to coexist without competing for system resources.
This shift highlights the combination of PostgreSQL and ClickHouse as a compelling solution for modern data platforms, with Postgres serving as the authoritative transactional system, and ClickHouse operating as a high-performance analytical platform for processing massive datasets in real time. Together, they function as complementary components connected through continuous Change Data Capture (CDC) synchronization. Before we get into the common architectural patterns, let’s briefly look at why Postgres + ClickHouse.
Why Postgres + ClickHouse?
PostgreSQL excels at Online Transaction Processing (OLTP). Utilizing mature ACID compliance, MVCC, and advanced indexing, it serves as the operational system of record for managing concurrent transactions like accounts, finance, and inventory.
In contrast, analytical workloads like BI dashboards and fraud detection require scanning millions or billions of historical records. Running these massive sequential scans continuously on a production OLTP system increases CPU, memory, and latency, ultimately degrading application performance.
ClickHouse solves this issue as a column-oriented Online Analytical Processing (OLAP) database designed for rapid queries over massive datasets. Instead of replacing PostgreSQL, ClickHouse complements it by offloading complex analytical processing.
Consequently, architectural focus has shifted from choosing between the two platforms to determine how they can work together effectively. This reflects a trend toward polyglot persistence, where specialized databases collaborate to handle distinct transactional and analytical workloads.
Pattern 1: Postgres to ClickHouse Real-Time Analytics
The widely adopted PostgreSQL and ClickHouse architecture uses PostgreSQL as the transactional source of truth while continuously replicating data to ClickHouse for analytical processing. This separates workloads without complex ETL pipelines, allowing applications and BI tools to query ClickHouse directly. Because ClickHouse is optimized for large scans and aggregations, dashboards load significantly faster while keeping production PostgreSQL tables responsive and isolated from heavy reporting risks.
This approach is ideal for real-time systems like SaaS, fintech, and IoT platforms, where fast dashboard updates are a key part of the product experience.
Architecture Overview
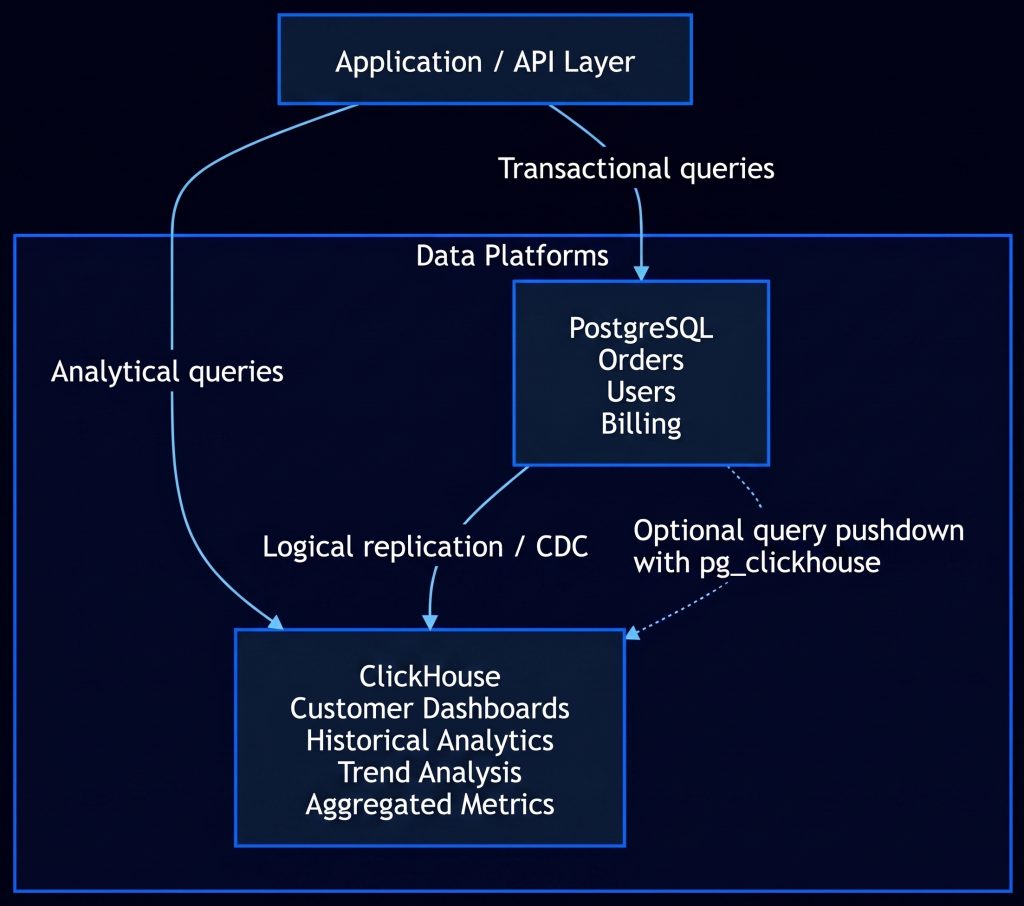
In a typical PostgreSQL and ClickHouse deployment, applications run transactional operations on PostgreSQL to ensure data consistency. Committed transactions are then replicated to ClickHouse via a Change Data Capture pipeline, enabling analytical queries to execute independently from the OLTP workload.
By separating the transaction plane from the analytics plane, organizations allow each database to focus on the workload for which it was designed, improving scalability, reducing resource contention, and simplifying performance tuning.
Keeping Analytics in Sync with Change Data Capture (CDC)
This architecture uses Change Data Capture (CDC) to continuously synchronize transactional changes from PostgreSQL to ClickHouse. By capturing inserts, updates, and deletes directly from PostgreSQL’s Write-Ahead Log (WAL) via logical decoding and replication, CDC avoids periodic ETL jobs, minimizing latency for near real-time operational dashboards and analytics.
Enabling this requires configuring the correct PostgreSQL WAL level and exposing individual tables via publications to stream changes.
ALTER SYSTEM SET wal_level = logical;

CREATE PUBLICATION app_events_pub
FOR TABLE
    orders,
    order_events,
    account_events;
CDC services (such as ClickHouse, ClickPipes, or PeerDB) continuously replicate PostgreSQL changes to ClickHouse, reducing data delays and operational overhead compared to traditional batch ETL.
However, monitoring operational factors like replication slots, WAL retention, schema changes, connectivity, backfills, and replication lag is essential, making latency a critical component of real-time dashboard SLOs.
Operational Readiness Checklist
Pre-production deployment of PostgreSQL alongside ClickHouse requires robust operations: identifying authoritative source tables, validating CDC pipelines, and setting replication lag alerts before dashboards rely on the data.
Schema design must transform normalized PostgreSQL tables into denormalized ClickHouse models, defining clear update/delete semantics for append-optimized engines like ReplacingMergeTree. Independently test backfills and run regular reconciliation jobs to detect sync issues early.
Finally, set clear data freshness objectives and monitor metrics like ingestion throughput, WAL growth, slot utilization, and latency, treating CDC as a production service to ensure a reliable platform.
Pattern 2: Hot / Cold Time-Series Data
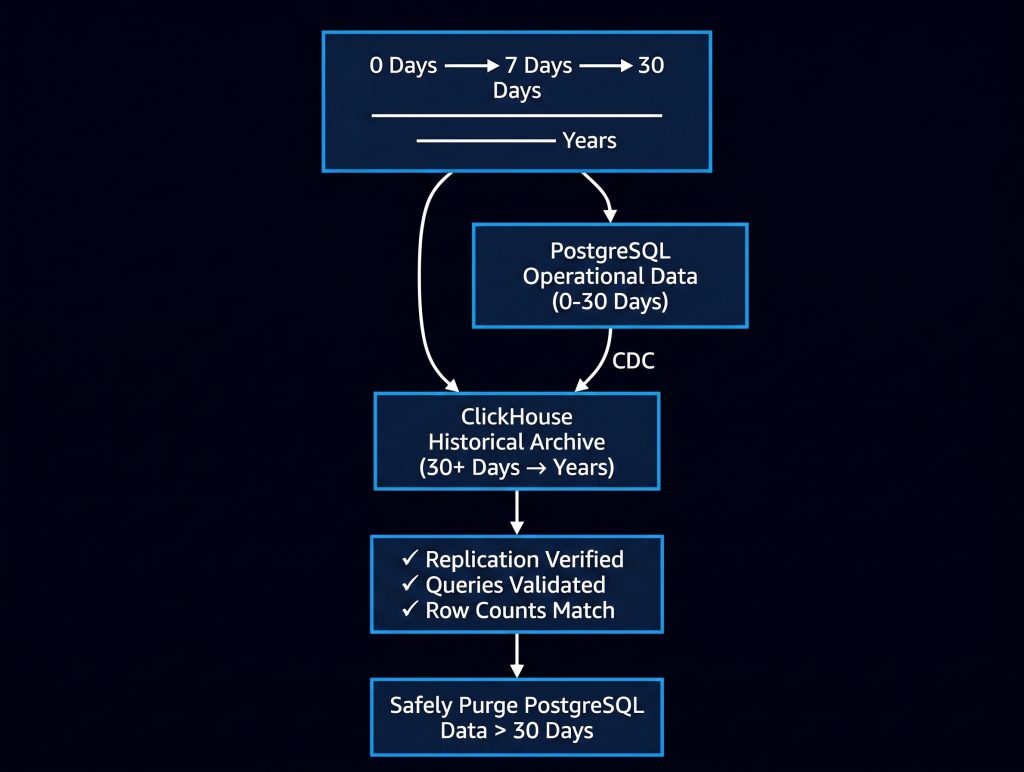
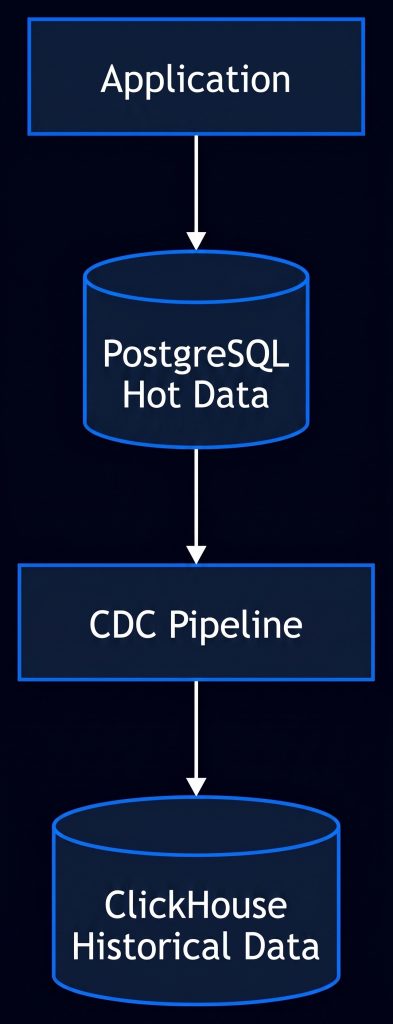
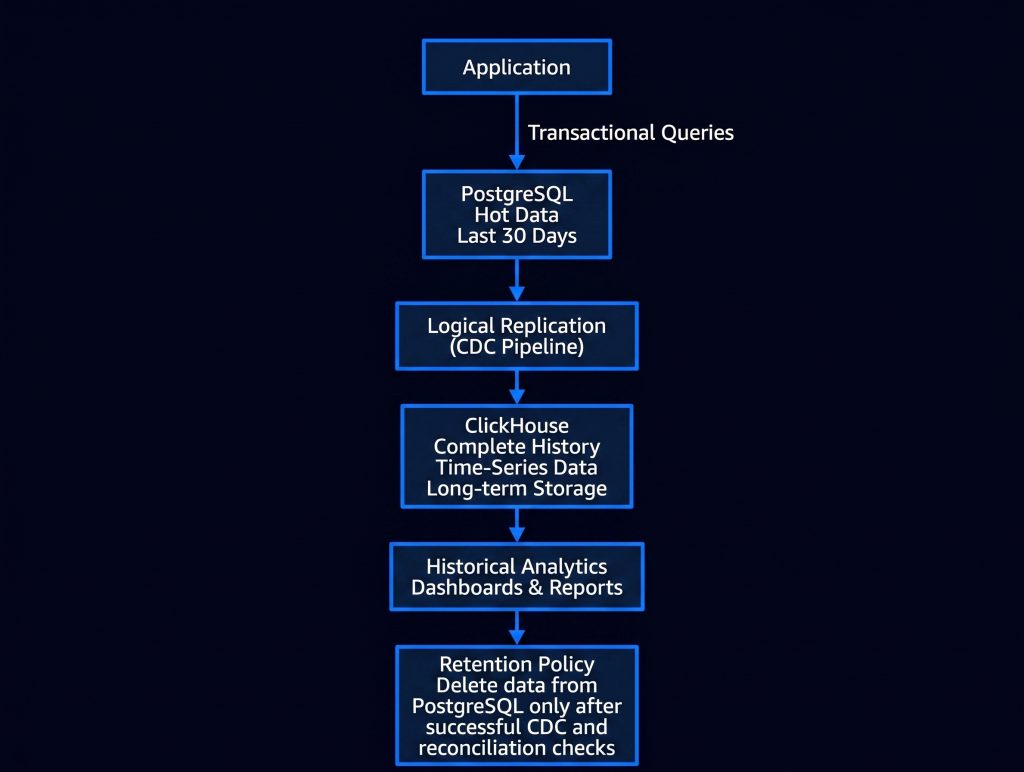
In this architecture, PostgreSQL stores only recent operational data for transactional processing, while ClickHouse holds the complete historical record. A continuous CDC pipeline synchronizes changes into ClickHouse, enabling PostgreSQL to safely expire older data after verified replication.
Time-Series Data Lifecycle
Combining PostgreSQL and ClickHouse separates operational data from long-term analytical data. Organizations can store only day-to-day operational records in PostgreSQL, while continuously archiving historical data in ClickHouse via a Change Data Capture (CDC) pipeline.
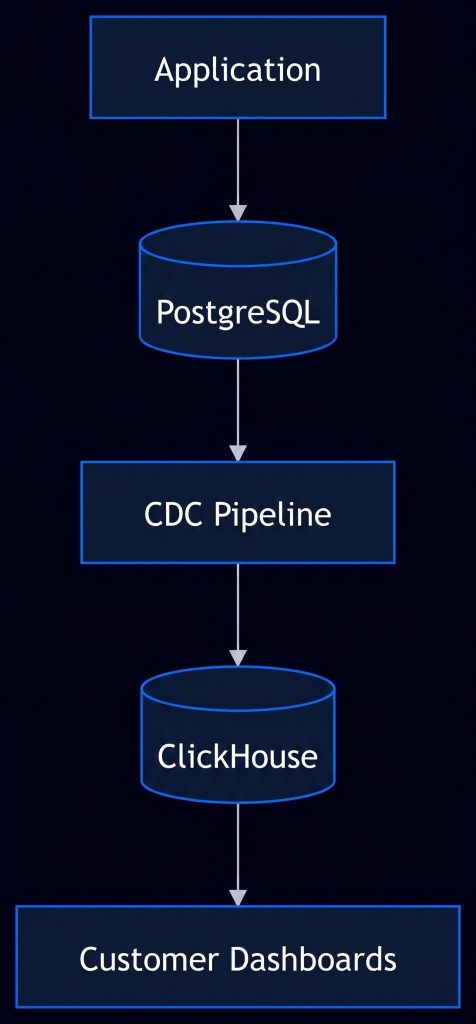
In a typical deployment, PostgreSQL serves as the system of record for transactional workloads, storing recent data, e.g., the last 30 days, to support low-latency OLTP operations. Simultaneously, committed transactions are streamed to ClickHouse via logical replication and a CDC connector such as Debezium, PeerDB, or native decoding. ClickHouse maintains a complete historical archive optimized for analytical queries without affecting operational database performance.
Pattern 3: Federated Query with pg_clickhouse
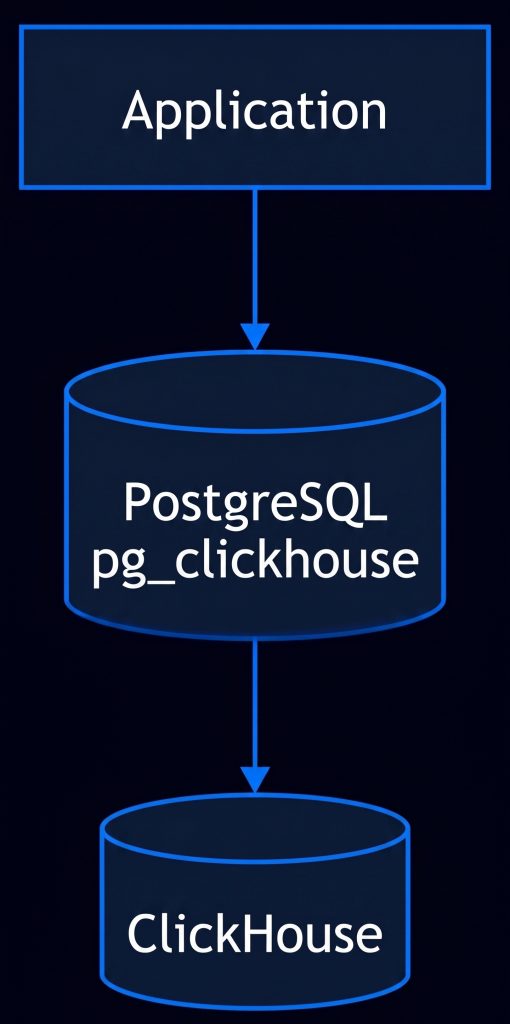
Instead of forcing applications and BI tools to communicate directly with ClickHouse, PostgreSQL remains the primary SQL endpoint. The pg_clickhouse extension transparently pushes supported analytical queries to ClickHouse while preserving PostgreSQL compatibility.
Federated Query Execution Flow
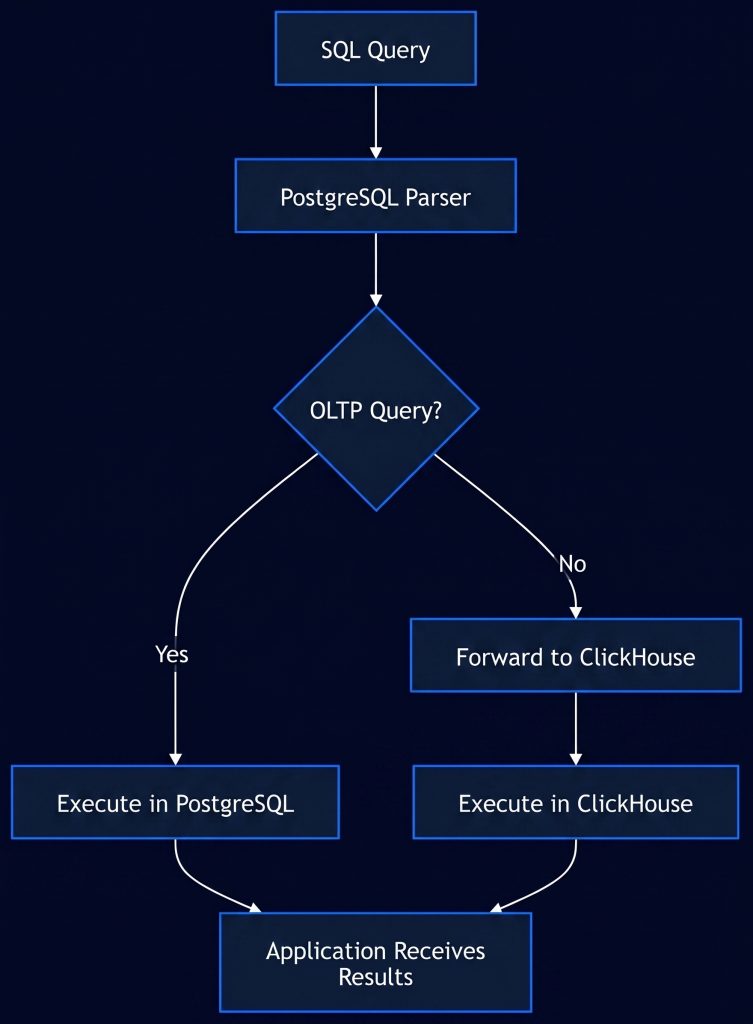
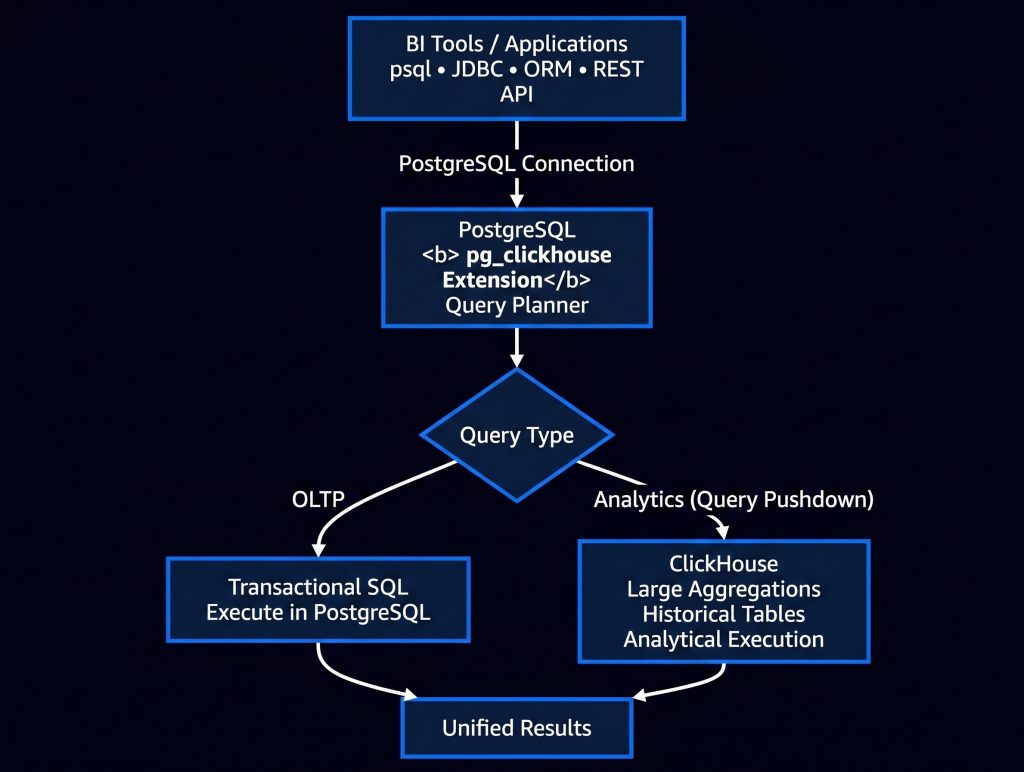
Upon reaching PostgreSQL, a query is processed by the parser and query planner. The pg_clickhouse extension then automatically determines if it is a transactional (OLTP) or analytical (OLAP) workload. This routing happens before execution and is completely transparent to the application.
OLTP queries, such as inserting orders or retrieving records by primary key, execute locally within PostgreSQL to maintain ACID guarantees, MVCC concurrency control, and low-latency transaction processing.
Analytical queries, like large aggregations or historical reporting scanning millions of rows, are forwarded to ClickHouse, leveraging its columnar storage engine, vectorized execution, and compression for significantly faster performance.
Pattern 4: Embedded Analytics in SaaS Applications
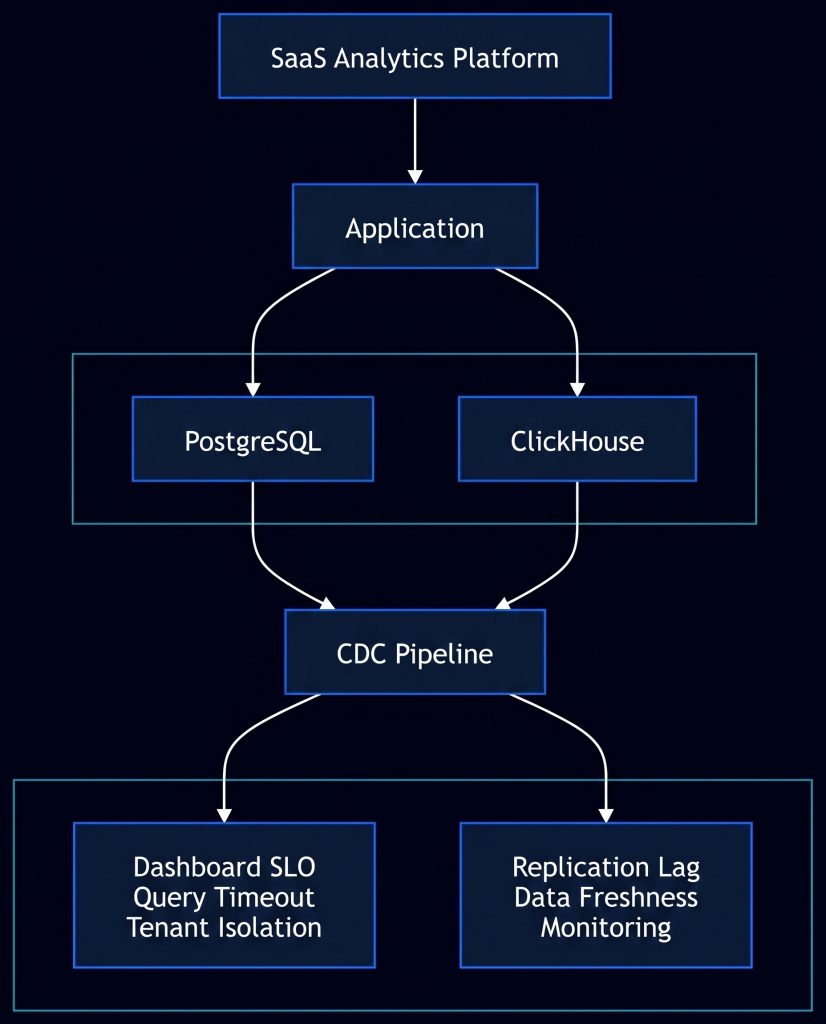
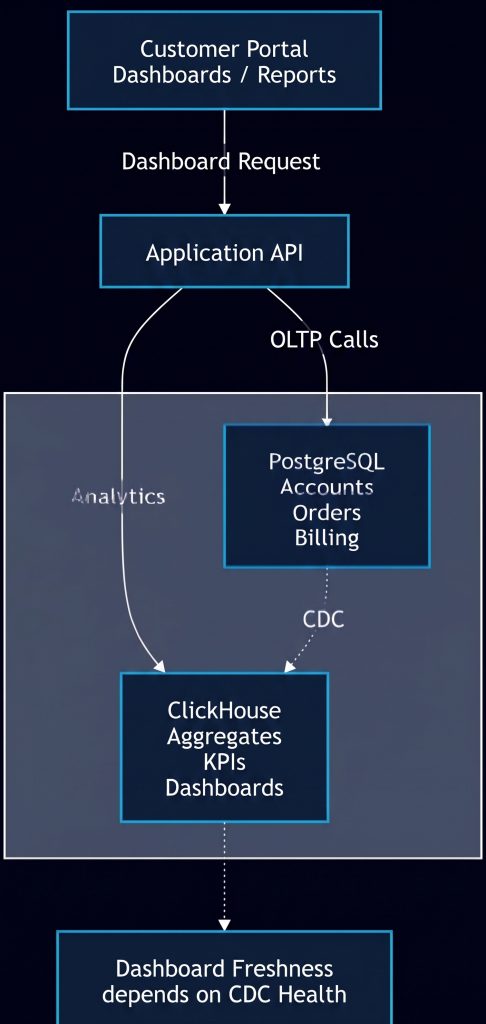
Customer-facing dashboards require analytics to become part of the production application itself. Every customer request may trigger analytical queries while transactional operations continue independently. This makes CDC freshness, query latency, and workload isolation part of the application’s reliability requirements.
Embedded Analytics Operational Components
While PostgreSQL and ClickHouse serve different workloads, the success of a hybrid analytics platform depends on the operational components that ensure data consistency, low latency, and service reliability. The CDC pipeline is only one part of the architecture and operators must also continuously monitor the health of the entire data flow.
End-to-end observability is critical for production deployments. Monitoring should include PostgreSQL replication health, CDC connector status, ClickHouse ingestion throughput, query performance, storage utilization, and dashboard latency. A centralized monitoring platform enables operators to correlate issues across the entire pipeline, reducing mean time to detection (MTTD) and mean time to recovery (MTTR).
Pattern 5: Hybrid
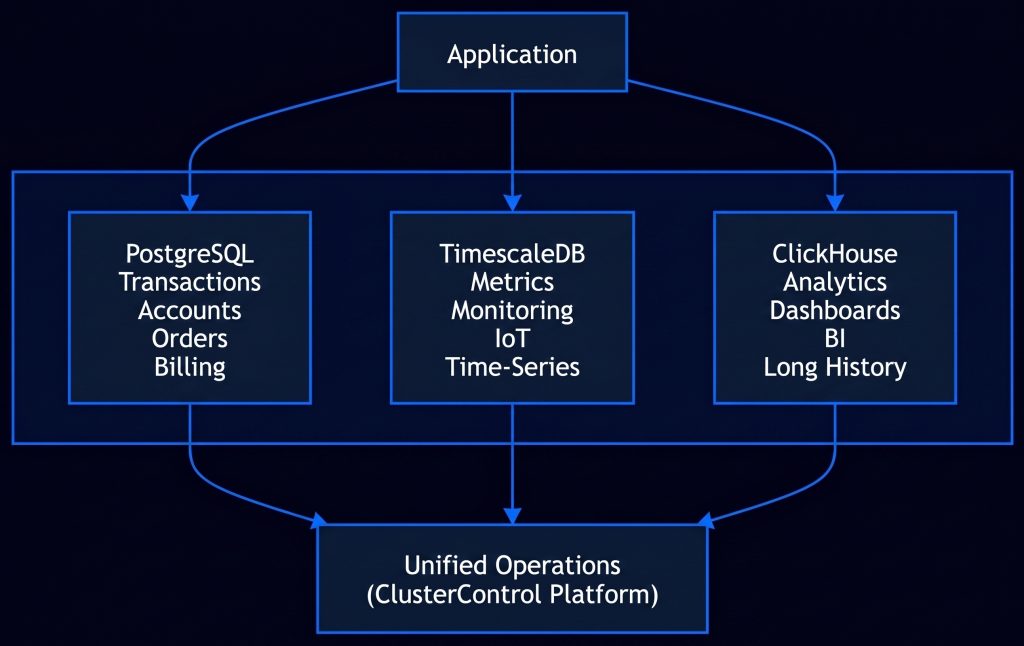
Many production environments combine three specialized database platforms. PostgreSQL serves as the transactional system of record for business-critical operations like user management, orders, accounts, and billing. Its ACID compliance, MVCC model, and mature ecosystem suit Online Transaction Processing (OLTP) workloads requiring strong consistency.
Meanwhile, TimescaleDB handles operational time-series workloads like application metrics, IoT readings, and telemetry. Hypertables, native compression, continuous aggregates, and automated retention enable efficient storage and querying while maintaining full PostgreSQL compatibility.
For analytical processing, ClickHouse offers a column-oriented database optimized for Online Analytical Processing (OLAP). It runs complex queries across billions of rows for dashboards, BI, and trend analysis. Isolating analytical workloads prevents reports and insights from impacting operational application performance.
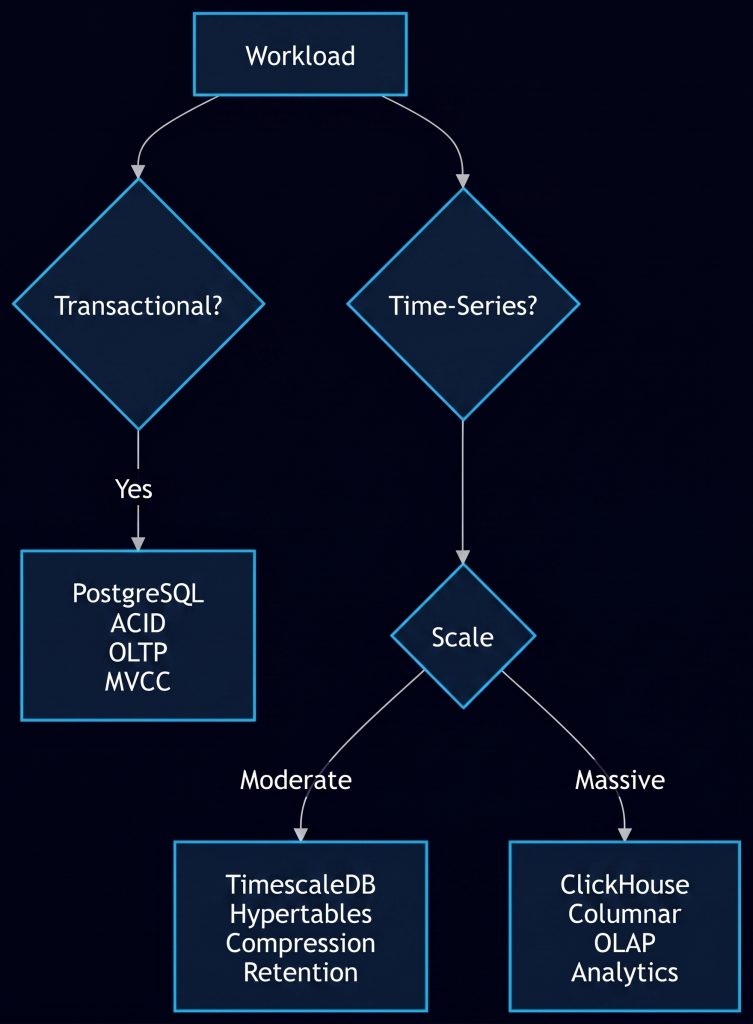
Postgres vs. TimescaleDB vs. ClickHouse Decision Tree
To optimize performance, scalability, and operational efficiency, a simple decision process helps determine whether PostgreSQL, TimescaleDB, or ClickHouse is the best fit for a particular use case.
Operating Postgres + ClickHouse in Production
Previously, we explored how PostgreSQL and ClickHouse complement each other through real-time operational analytics, hot/cold storage, and federated queries using pg_clickhouse. However, successfully operating them in production requires understanding Change Data Capture (CDC) behavior under failure conditions, monitoring health, preparing runbooks, and establishing clear ownership across all layers. I’ll look at the operational perspective, examining how to keep the architecture healthy, diagnose common problems, and run a reliable production platform.
Native CDC for Operators
Change Data Capture (CDC) is the foundation of PostgreSQL and ClickHouse synchronization, ensuring ClickHouse operates as a near-real-time analytical platform rather than an outdated copy. For operators, understanding its internal mechanics is essential.
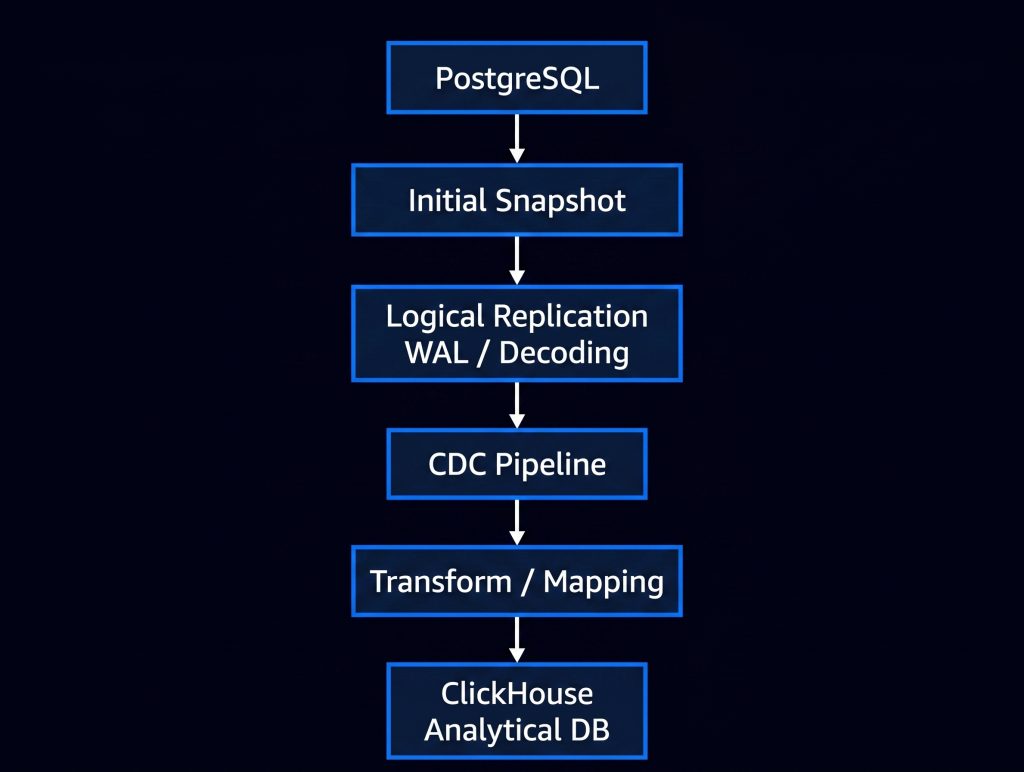
In PostgreSQL, CDC utilizes the Write-Ahead Log (WAL), logical decoding, and logical replication instead of scheduled ETL jobs. PostgreSQL continuously records committed transactions in the WAL, which logical replication decodes into inserts, updates, and deletes. The process starts with an initial snapshot of existing data before transitioning into continuous streaming, keeping ClickHouse perfectly synchronized.
While modern services like ClickPipes and PeerDB simplify deployment over traditional Kafka- or Debezium-based architectures, native CDC still requires operational responsibility. Complexity merely shifts to monitoring, validation, and operational governance.
Crucially, operators must monitor logical replication slots. If a CDC consumer stops, PostgreSQL retains unconsumed WAL files, causing uncontrolled disk growth that can exhaust storage and disrupt the primary database.
A useful operational query for monitoring replication slots is shown below:
SELECT
    slot_name,
    plugin,
    active,
    restart_lsn,
    confirmed_flush_lsn
FROM pg_replication_slots;
This information allows operators to verify whether replication slots remain active and downstream consumers acknowledge changes.
Distinguishing between the initial snapshot and continuous replication is critical. Initial snapshots transfer gigabytes or terabytes of data, where replication lag is expected and should not trigger alerts. Afterward, continuous replication must meet defined freshness objectives, limiting delay to seconds or minutes.
ClickHouse managed CDC services require direct PostgreSQL connectivity and do not support proxy layers like PgBouncer, Amazon RDS Proxy, or Supabase Pooler. This must be considered during network, firewall, and infrastructure deployment.
Operational Failure Modes
The primary challenge in PostgreSQL and ClickHouse architectures lies in system interactions, making an effective troubleshooting strategy vital when incidents span multiple layers.
The most frequent operational issue is CDC (Change Data Capture) lag, which leads to stale dashboards and visible delays for users even if PostgreSQL remains healthy. Operators must monitor a range of metrics, including replication lag, slot status, WAL generation rates, ClickHouse throughput, and end-to-end freshness, rather than just basic database health.
Schema evolution also presents difficulties, as application releases regularly modify PostgreSQL tables. Because ClickHouse schemas are denormalized for analysis, schema updates require precise transformations to avoid pipeline interruptions or data gaps.
Furthermore, updates and deletes require deliberate management. While PostgreSQL modifies rows directly, ClickHouse is built for append-heavy workloads. Managing updates demands strategies like ReplacingMergeTree, version columns, or deduplication, while deletes rely on tombstones, soft-delete flags, or scheduled merges.
Query routing errors frequently impact performance; analytical queries on PostgreSQL exhaust resources, whereas point lookups on ClickHouse introduce latency. Federated query setups add further complexity, as performance hinges on whether execution is successfully pushed to ClickHouse or falls back to PostgreSQL.
Finally, security and governance grow more complex because user accounts, roles, authentication, and auditing differ between the platforms. Replicated analytical data often requires distinct access controls, encryption, and logging compared to the source transactional system.
Hybrid Operations with ClusterControl
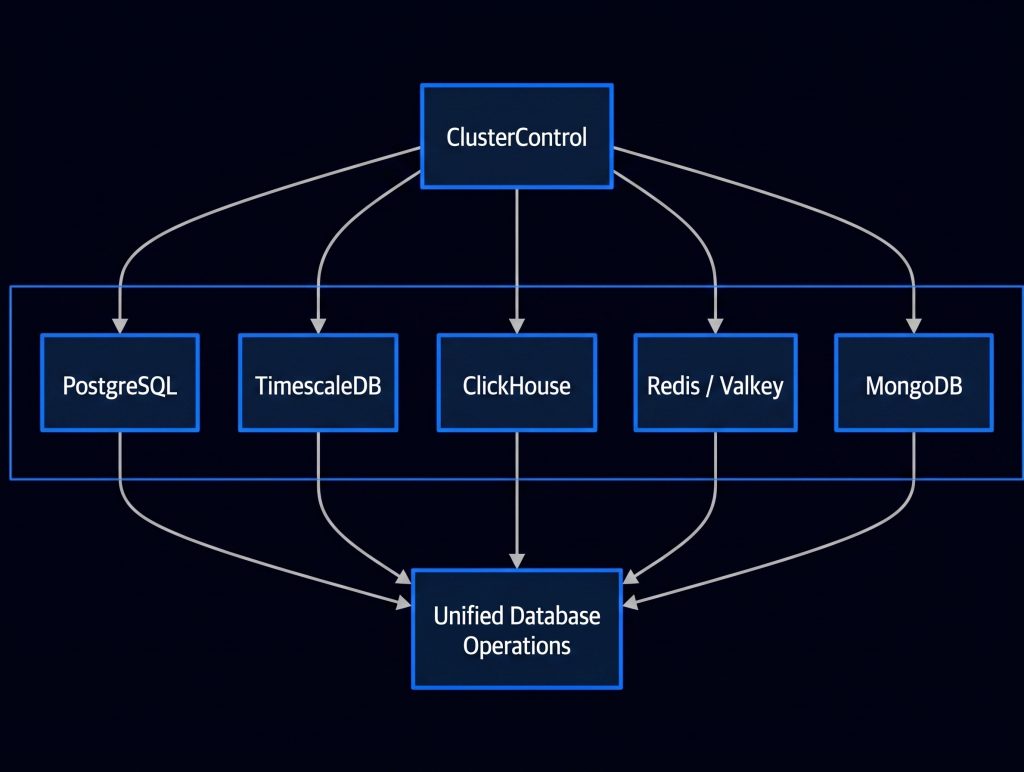
As organizations adopt specialized databases like PostgreSQL, ClickHouse, TimescaleDB, Redis, Valkey, MongoDB, MySQL, and MariaDB, operational complexity grows. Rather than managing each technology independently, platform teams require unified tooling to support these heterogeneous environments.
ClusterControl fits this strategy by delivering unified lifecycle management, including deployment, monitoring, backup, recovery, and automation, for multiple open-source databases across on-premises and cloud environments. As PostgreSQL and ClickHouse architectures grow more common, its operational management extends well beyond simple server provisioning.
PostgreSQL management involves deployment automation, high availability, backups, PITR, replication monitoring, and upgrade planning. ClickHouse adds backup strategies, merge monitoring, storage capacity planning, and query optimization. The connecting CDC pipeline also requires production-level monitoring, health checks, and incident response.
Support teams must prepare operational runbooks before production deployment. These should document reference architectures, failure modes, CDC troubleshooting, reconciliation workflows, schema migrations, and team escalation paths.
Recommended Reference Architectures
Although PostgreSQL and ClickHouse can be combined in numerous ways, several architectural patterns have consistently emerged across production deployments.
Architecture A: SaaS Operational Analytics
This architecture positions PostgreSQL as the transactional system of record while ClickHouse powers customer-facing dashboards through near-real-time CDC replication. Optionally, pg_clickhouse provides SQL compatibility for existing applications. This pattern is particularly suitable for SaaS platforms, product analytics, billing systems, and customer usage reporting.
Architecture B: Hot / Cold Time-Series Data
Recent operational data remains inside PostgreSQL while historical records migrate into ClickHouse after successful replication. Data expiration is governed by replication watermarks rather than fixed retention schedules, ensuring historical data remains protected.
Architecture C: Federated Analytics
Applications continue connecting to PostgreSQL while pg_clickhouse pushes analytical execution into ClickHouse. This minimizes migration effort while improving analytical performance.
Architecture D: Hybrid Cloud Analytics
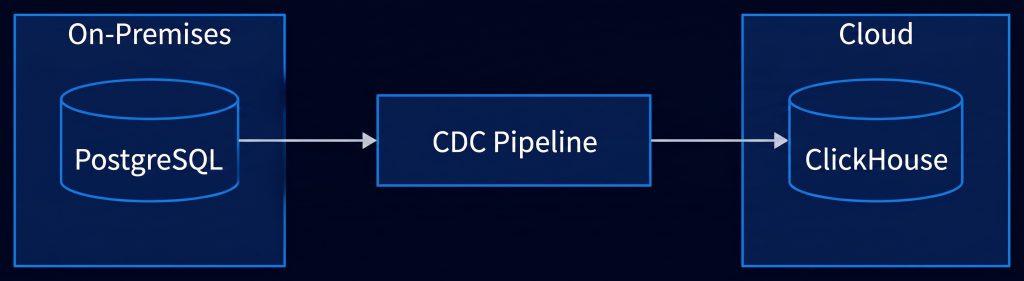
Transactional PostgreSQL clusters remain within customer-controlled environments while ClickHouse operates as a managed analytical platform in the cloud. Secure connectivity is established through VPNs, private networking, or dedicated links.
Production Readiness Checklist
Before deploying PostgreSQL and ClickHouse into production, organizations should validate both technical implementation and operational preparedness. Successful production environments depend as much on operational discipline as on architectural design.
Before Deployment
- Identify authoritative source-of-truth tables.
- Define which datasets require CDC.
- Enable logical replication.
- Design ClickHouse analytical schemas.
- Define update and delete handling.
- Establish naming conventions.
- Validate firewall and network connectivity.
- Review proxy limitations.
- Plan initial snapshots and historical backfills.
During Rollout
- Execute the initial snapshot.
- Enable continuous CDC.
- Compare row counts and business metrics.
- Benchmark representative analytical queries.
- Test failover scenarios.
- Validate schema migrations.
- Verify dashboard freshness.
- Ensure retention policies do not remove data prematurely.
After Go-Live
- Monitor replication lag continuously.
- Observe WAL growth.
- Monitor ClickHouse insert throughput.
- Watch merge activity.
- Reconcile PostgreSQL and ClickHouse data regularly.
- Review schema drift after every application release.
- Maintain operational documentation and escalation procedures.
Conclusion
Modern data platforms use specialized architectures where each database handles specific workloads. PostgreSQL serves as a reliable transactional system of record, while ClickHouse enables high-performance real-time analytics without impacting transactional performance.
Operating this architecture requires managing Change Data Capture, replication health, schema evolution, and data reconciliation. In hybrid database environments, platforms like
ClusterControl provide valuable unified management across multiple database technologies.
Ultimately, the future involves combining both technologies into a cohesive platform. Organizations that invest in both the architecture and its supporting operational processes will ensure long-term scalability and production reliability.
Install ClusterControl and try Postgres and ClickHouse free for 30 days
Script Installation Instructions
The installer script is the simplest way to get ClusterControl up and running. Run it on your chosen host, and it will take care of installing all required packages and dependencies.
Offline environments are supported as well. See the Offline Installation guide for more details.
On the ClusterControl server, run the following commands:
wget https://severalnines.com/downloads/cmon/install-cc
chmod +x install-cc
sudo ./install-cc     # omit sudo if you run as root
After the installation is complete, open a web browser, navigate to https://<ClusterControl_host>/, and create the first admin user by entering a username (note that “admin” is reserved) and a password on the welcome page. Once you’re in, you can deploy a new database cluster or import an existing one.
The installer script supports a range of environment variables for advanced setup. You can define them using export or by prefixing the install command.
See the list of supported variables and example use cases to tailor your installation.
Planet for the MySQL Community